Integrated Report | BASF
Integrated corporate report on economic, environmental and social performance
BASF Report 2021 Integrated corporate report on economic, environmental and social performance
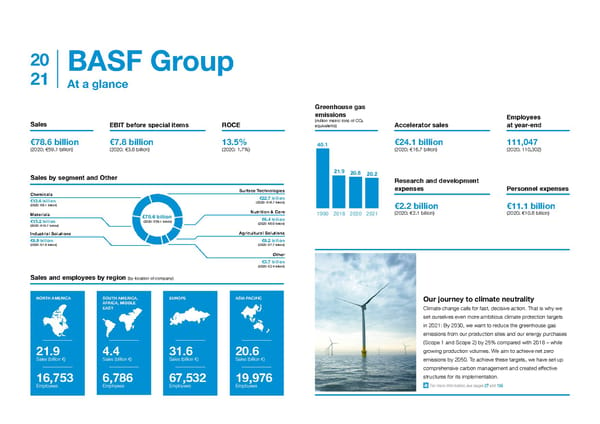
20 BASF Group 21 At a glance Greenhouse gas emissions Employees (million metric tons of CO Sales EBIT before special items ROCE equivalents) 2 Accelerator sales at year-end €78.6 billion €7.8 billion 13.5% 40.1 €24.1 billion 111,047 (2020: €59.1 billion) (2020: €3.6 billion) (2020: 1.7%) (2020: €16.7 billion) (2020: 110,302) 21.9 20.8 20.2 Sales by segment and Other Research and development Surface Technologies expenses Personnel expenses Chemicals €22.7 billion €13.6 billion (2020: €16.7 billion) (2020: €8.1 billion) €2.2 billion €11.1 billion Materials Nutrition & Care 1990 2018 2020 2021 (2020: €2.1 billion) (2020: €10.6 billion) €78.6 billion €6.4 billion €15.2 billion (2020: €59.1 billion) (2020: €6.0 billion) (2020: €10.7 billion) Industrial Solutions Agricultural Solutions €8.9 billion €8.2 billion (2020: €7.6 billion) (2020: €7.7 billion) Other €3.7 billion (2020: €2.4 billion) Sales and employees by region (by location of company) NORTH AMERICA SOUTH AMERICA, EUROPE ASIA PACIFIC Our journey to climate neutrality AFRICA, MIDDLE EAST Climate change calls for fast, decisive action. That is why we set ourselves even more ambitious climate protection targets in 2021: By 2030, we want to reduce the greenhouse gas emissions from our production sites and our energy purchases (Scope 1 and Scope 2) by 25% compared with 2018 – while 21.9 4.4 31.6 20.6 growing production volumes. We aim to achieve net zero Sales (billion €) Sales (billion €) Sales (billion €) Sales (billion €) emissions by 2050. To achieve these targets, we have set up comprehensive carbon management and created effective 16,753 6,786 67,532 19,976 structures for its implementation. Employees Employees Employees Employees For more information, see pages 27 and 126
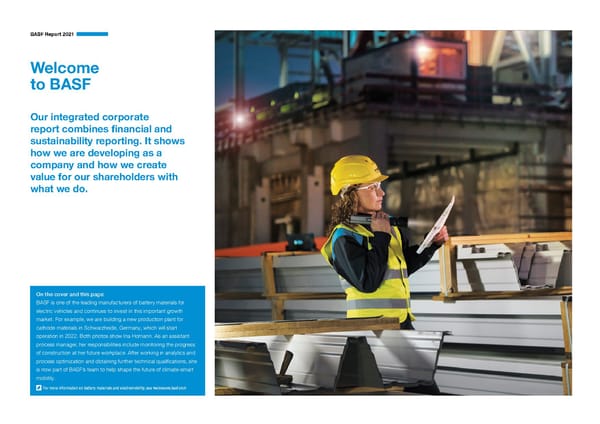
BASF Report 2021 Welcome to BASF Our integrated corporate report combines financial and sustainability reporting. It shows how we are developing as a company and how we create value for our shareholders with what we do. On the cover and this page: BASF is one of the leading manufacturers of battery materials for electric vehicles and continues to invest in this important growth market. For example, we are building a new production plant for cathode materials in Schwarzheide, Germany, which will start operation in 2022. Both photos show Ina Homann. As an assistant process manager, her responsibilities include monitoring the progress of construction at her future workplace. After working in analytics and process optimization and obtaining further technical qualifications, she is now part of BASF’s team to help shape the future of climate-smart mobility. For more information on battery materials and electromobility, see weloveevs.basf.com
BASF Report 2021 4 Contents Contents To Our Shareholders Management’s Report Corporate Governance Consolidated Financial Statements Overviews About This Report 5 1 | To Our Shareholders 7 3 | Corporate Governance 161 5 | Overviews 286 Letter from the Chairman of the Board of Executive Directors 8 Corporate Governance Report 162 Ten-Year Summary 287 The Board of Executive Directors of BASF SE Glossary and Trademarks 289 11 Compliance 171 BASF on the Capital Market 12 Management and Supervisory Boards 174 Report of the Supervisory Board 177 Declaration of Conformity Pursuant to Section 161 AktG 184 2 | Management’s Report 16 Declaration of Corporate Governance 185 Overview 17 20 The BASF Group 4 | Consolidated Financial Statements 186 Our Strategy 26 Statement by the Board of Executive Directors 187 The BASF Group’s Business Year 52 Independent Auditor’s Report 188 Sustainability Along the Value Chain 96 Statement of Income 194 Forecast 145 195 Statement of Income and Expense Recognized in Equity Balance Sheet 196 Statement of Cash Flows 198 199 Statement of Changes in Equity Notes 200
BASF Report 2021 About This Report 5 About This Report GRI 102, 305 Integrated reporting and online services At a glance progress report on BASF’s implementation of the 10 principles of the This integrated report documents BASF’s economic, environmental U.N. Global Compact. and social performance in 2021. We show how sustainability con- ▪ Integrated BASF Report serves as U.N. Global Compact progress tributes to BASF’s long-term success as an integral part of our cor- report The GRI and Global Compact Index can be found in the online porate purpose and our strategy, and how we as a company create ▪ Nonfinancial reporting in accordance with HGB and additional report. It provides an overview of all relevant information to fulfill the value for our stakeholders. sustainability reporting in accordance with GRI GRI indicators and shows how we contribute to the United Nations’ ▪ Financial reporting in accordance with IFRS, HGB and GAS Sustainable Development Goals (SDGs) and the principles of the Symbols U.N. Global Compact. The results of the limited assurance of this ▪ Editorial deadline: February 21, 2022 gesell - information conducted by KPMG AG Wirtschaftsprüfungs You can find more information in this report. ▪ External audit by KPMG AG Wirtschaftsprüfungsgesellschaft schaft can also be found there. We also publish online additional information on sustainability in accordance with the industry-specific You can find more information online. The content of these requirements of the SASB. links are voluntary disclosures that were not audited by the auditor. Content and structure The information on the financial position and performance of the BASF Group comply with the requirements of International Financial The content of this section is not part of the statutory audit but The BASF Report, which is published each year in English and Reporting Standards (IFRS), and, where applicable, the German has undergone a separate limited assurance by our auditor. German, combines the major financial and sustainability-related Commercial Code (HGB), German Accounting Standards (GAS) and information necessary to comprehensively evaluate our performance. the guidelines on alternative performance measures from the Euro- The content of this section is voluntary, unaudited information, We select the report’s topics based on the following principles: pean Securities and Markets Authority (ESMA). Internal control which was critically read by the auditor. materiality, sustainability context, completeness, balance and stake- mechanisms ensure the reliability of the information presented in this holder inclusion. In addition to this report, we publish further informa- report. BASF’s Board of Executive Directors confirmed the effective- tion online. The relevant links can be found at the end of each chapter. ness of the internal control measures and compliance with the regu- lations for financial reporting. Our sustainability reporting has been based on Global Reporting Initiative (GRI) guidelines and standards since 2003. We have applied Material topics along the value chain form the focal points of report- the “Comprehensive” option since 2017. ing and define the limits of this report. We take three dimensions into account in identifying and evaluating material topics: the impact on We have been active in the International Integrated Reporting Council BASF, the impact of BASF and relevance for our stakeholders. (IIRC) since 2014 and have supported the work of the Value Report- For more information on our sustainability reporting, see from page 45 and 96 onward ing Foundation, formed by the merger of the IIRC and the Sustain- Our value creation based on the IIRC framework can be found on page 24 and in the online report ability Accounting Standards Board (SASB), since 2021. This involve- For more information on our control and risk management system, see page 151 onward ment gives us the opportunity to discuss our experiences of The 2021 BASF Online Report can be found at basf.com/report integrated reporting with stakeholders and at the same time, receive The GRI and Global Compact Index can be found at basf.com/en/gri-gc inspiration for enhancing our reporting. BASF’s report addresses ele- The SASB index can be found at basf.com/sasb ments of the IIRC framework by illustrating how we create value, for example. The information contained in this report also serves as a
BASF Report 2021 About This Report 6 Data reported in full. Unless otherwise indicated, data on social responsi- steering target in 2022. The links and additional content provided on bility and transportation safety refers to BASF SE and its consolidated linked internet sites are not part of the audited information. All information and bases for calculation in this report are founded subsidiaries. on national and international standards for financial and sustain- KPMG also conducted a limited assurance of the nonfinancial group ability reporting. The data and information for the reporting period The divested pigments business is included in the disclosures and statement (NFS). were sourced from the expert units responsible using representative indicators on employees, the environment, and health and safety on The Independent Auditor’s Report can be found on page 188 onward methods. Due to rounding, individual figures may not add up exactly a pro rata basis until June 30, 2021. Sales from the divested pig- An assurance statement on the sustainability information in the BASF Report 2021 can be found at to the totals shown and percentages may not correspond exactly to ments business are no longer integrated in the portfolio to be evalu- basf.com/sustainability_information the figures shown. ated under the Sustainable Solution Steering method for 2021. An assurance statement of the NFS can be found at basf.com/nfs-audit-2021 BASF Shanshan Battery Materials Co., Ltd., which was formed on The reporting period is the 2021 business year. Relevant information August 31, 2021, is included in the sustainability disclosures and Forward-looking statements and forecasts is included up to the editorial deadline of February 21, 2022. indicators on a pro rata basis. The company’s sales to third parties are already included in the sum of relevant sales according to This report contains forward-looking statements. These statements BASF Group’s scope of consolidation for its financial reporting com- the Sustainable Solution Steering method. They are listed as “not are based on current estimates and projections of the Board of prises BASF SE, with its headquarters in Ludwigshafen, Germany, assessed.” We will start classification in 2022. Executive Directors and currently available information. Forward- and all of its fully consolidated subsidiaries and proportionally con- For more information on companies accounted for in the Consolidated Financial Statements, see the looking statements are not guarantees of the future developments solidated joint operations. Shares in joint ventures and associated Notes from page 205 onward and results outlined therein. These are dependent on a number of companies are accounted for, if material, using the equity method in The list of shares held can be found at basf.com/en/corporategovernance factors; they involve various risks and uncertainties; and they are the BASF Group Consolidated Financial Statements and are thus based on assumptions that may not prove to be accurate. Such risk not included in the scope of consolidation. factors include those discussed in Opportunities and Risks on External audit pages 151 to 160. We do not assume any obligation to update the The section “Employees” refers to employees active in a company forward- looking statements contained in this report above and within the BASF Group scope of consolidation as of December 31, Our reporting is audited by a third party. KPMG AG Wirtschafts- beyond the legal requirements. 2021. prüfungsgesellschaft has audited the BASF Group Consolidated Financial Statements and the Management’s Report and has Our data collection methods for environmental protection and safety approved themn free of qualification. are based on the recommendations of the International Council of Chemical Associations (ICCA) and the European Chemical Industry The limited assurance of the sustainability information contained in Council (CEFIC). In the section “We Produce Safely and Efficiently,” the Management’s Report was conducted in accordance with we report all data of the worldwide production sites of BASF SE, its ISAE 3000 (Assurance Engagements other than Audits or Reviews fully consolidated subsidiaries, and proportionally consolidated joint of Historical Financial Information) and ISAE 3410 (Assurance operations. BASF SE subsidiaries that are fully consolidated in the Engagements on Greenhouse Gas Statements), the relevant inter- Group financial statements in which BASF holds an interest of less national assurance standards for sustainability reporting. KPMG than 100% are included in full in environmental reporting. The emis- conducted a reasonable assurance of all disclosures on the most sions of proportionally consolidated joint operations are disclosed important nonfinancial key performance indicators, accelerator pro rata according to our interest. Work-related accidents at all sites sales and CO emissions. The forecast for the key performance 2 of BASF SE and its subsidiaries as well as joint operations and joint indicator CO emissions is also part of the Management’s Report 2 ventures in which we have sufficient authority in terms of safety and is covered by the annual audit. No forecast has been made for management are compiled worldwide regardless of our interest and the previous Accelerator target as we plan to update our portfolio
BASF Report 2021 7 Contents To Our To Our Shareholders Management’s Report Corporate Governance Consolidated Financial Statements Shareholders Overviews 1 Letter from the Chairman of the Board of Executive 8 Directors 11 The Board of Executive Directors of BASF SE 12 BASF on the Capital Market
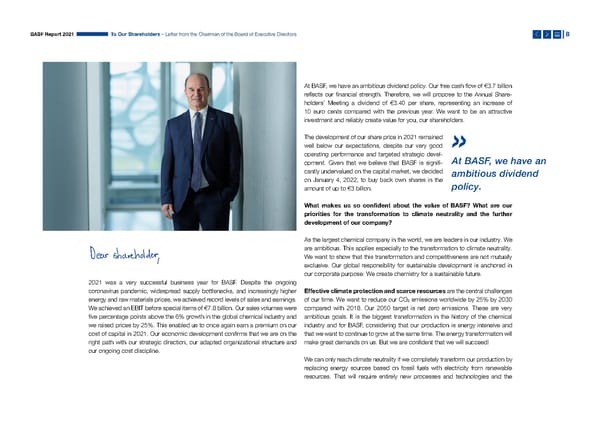
Letter from the Chairman of the Board of Executive Directors BASF Report 2021 To Our Shareholders – Letter from the Chairman of the Board of Executive Directors 8 At BASF, we have an ambitious dividend policy. Our free cash flow of €3.7 billion reflects our financial strength. Therefore, we will propose to the Annual Share- holders’ Meeting a dividend of €3.40 per share, representing an increase of 10 euro cents compared with the previous year. We want to be an attractive investment and reliably create value for you, our shareholders. The development of our share price in 2021 remained well below our expectations, despite our very good » operating performance and targeted strategic devel- At BASF, we have an op ment. Given that we believe that BASF is signifi- cantly under valued on the capital market, we decided ambitious dividend on January 4, 2022, to buy back own shares in the policy. amount of up to €3 billion. What makes us so confident about the value of BASF? What are our priorities for the transformation to climate neutrality and the further development of our company? As the largest chemical company in the world, we are leaders in our industry. We are ambitious. This applies especially to the transformation to climate neutrality. We want to show that this transformation and competitiveness are not mutually exclusive. Our global responsibility for sustainable development is anchored in our corporate purpose: We create chemistry for a sustainable future. 2021 was a very successful business year for BASF. Despite the ongoing coronavirus pandemic, widespread supply bottlenecks, and increasingly higher Effective climate protection and scarce resources are the central challenges energy and raw materials prices, we achieved record levels of sales and earnings. of our time. We want to reduce our CO2 emissions worldwide by 25% by 2030 We achieved an EBIT before special items of €7.8 billion. Our sales volumes were compared with 2018. Our 2050 target is net zero emissions. These are very five percentage points above the 6% growth in the global chemical industry and ambitious goals. It is the biggest transformation in the history of the chemical we raised prices by 25%. This enabled us to once again earn a premium on our industry and for BASF, considering that our production is energy intensive and cost of capital in 2021. Our economic development confirms that we are on the that we want to continue to grow at the same time. The energy transformation will right path with our strategic direction, our adapted organizational structure and make great demands on us. But we are confident that we will succeed! our ongoing cost discipline. We can only reach climate neutrality if we completely transform our production by replacing energy sources based on fossil fuels with electricity from renewable resources. That will require entirely new processes and technologies and the
BASF Report 2021 To Our Shareholders – Letter from the Chairman of the Board of Executive Directors 9 courage to think in new directions. It will involve converting the big steam CO -free chemical production is the future. And BASF wants to be among the 2 crackers from heating based on fossil fuels to electrical heating. In these plants, first there. It all starts with transparency, which is why we provide our custom ers at the beginning of the value chains, steam is used to split naphtha into basic with Product Carbon Footprints (PCF) – the carbon footprint associated with chemicals at about 850 degrees Celsius. Other production per kilogram of sales product – for each of our 45,000 sales products. examples include the CO -free production of hydro- Furthermore, we help our customers develop strategies to reduce their carbon » 2 With our innovation power, gen by water electrolysis and methane pyrolysis, and footprint, to use resources more efficiently, and to manufacture products in a using waste heat recovered with heat pumps instead more environmentally friendly way. We expect that demand for such emission-free crea tivity and entre pre of con ven tional steam generation in gas-fired power or emission-reduced products will exceed supply in the medium term, and that neurial courage, we look plants. We will invest roughly €4 billion to reach our their market value will more than compensate for the higher production costs. It 2030 emission reduction targets. therefore also makes good economic sense to take a leading role here. That is to the future with why we want to be among the first to provide as many products as possible from optimism. We are also redefining raw material cycles through our portfolio with a reduced carbon footprint in large volumes by the end of the recycling. Good examples of this are the chemical decade. This differentiates us, increases our competitiveness and enables growth recycling process in which a new raw material, above market. pyrolysis oil, is obtained from plastic waste; the recycling of mattresses, which are broken down into polyurethane precursors; and the use of bio-based raw Profitable growth lays the foundation for a success- materials. There is a great feeling of excitement in the BASF team! With our inno- ful transformation. This is why we continue to focus » vation power, creativity and entrepr eneurial courage, we look to the future with our portfolio and business activities on organic CO free chemical optimism. growth. And the reverse is also true: The transforma - 2 tion is the foundation for a wide range of growth production is the future. Electricity from renewable sources in great quantities and at favorable prices opportunities! Neither future prosperity nor climate And BASF wants to be would enable us to achieve a climate-neutral future. This is made possible by the neutrality is possible without a competitive chemical electrification of entire value chains. To achieve this, we need to massively expand industry and innovative chemical products. Extensive among the first there . renewable energies worldwide. Currently, this is not happening fast enough. That regulations driven by policymakers and society do is why we are leading the way and securing access to green power. We already present a tremendous challenge to industry in general announced several projects in 2021 as part of the implementation of our and particularly to the chemical industry. At the same time, however, they lead to Make & Buy strategy: We have secured a half share in a 1.5 gigawatt offshore new business opportunities. The dynamic development from the combustion wind park from Vattenfall in the North Sea off the coast of the Netherlands. It engine to electromobility is a good example of this. As a leading chemical supplier should be connected to the grid in 2023. It will be the world’s biggest offshore to the automotive industry and producer of innovative cathode active materials wind farm – and all this without any public subsidies. We are taking a different for electric vehicle batteries, we are able to profit from this development. Growth approach with Ørsted and Engie: We have concluded attractive electricity supply and climate protection go hand in hand: Our materials not only support the contracts with both energy companies for a term of 25 years. In other regions dynamic growth of this market, but their low carbon footprint also paves the way as well, for example, in the United States and China, we are securing access to for climate-neutral mobility. green power. In this way, we are planning proactively and laying the foundation to ensure a long-term supply of electricity from renewable resources.
BASF Report 2021 To Our Shareholders – Letter from the Chairman of the Board of Executive Directors 10 China is already the largest chemical market in the world and has high growth potential in the long term. With the construction of our new Verbund site in Zhanjiang in the southern Chinese province of Guangdong, we want to further accelerate our profitable growth in the region. We are setting new standards in energy transformation there as well. By taking advantage of a new regulatory framework and signing a supply agreement for electricity from renewable sources with China » Resources Power in June 2021, we will be able Climate neutrality and to operate the first plants at the new Verbund site in Zhanjiang completely with green power. sustainable resource use Sustainable solutions and innovative products are not possible without a across our entire portfolio enable us to remain on our growth path and systematically drive the competitive chemical transformation to greater sustainability. industry. We act swiftly and systematically in the imple- mentation of our long-term strategy for profitable growth. I am convinced that climate neutrality and sustainable resource use are not possible without a competitive chemical industry. Our company is very well positioned. We make our contribution to society and at the same time, secure our long-term competitiveness. I am pleased that you support us on our path to a sustainable future. Many thanks for your trust. Yours, Martin Brudermüller
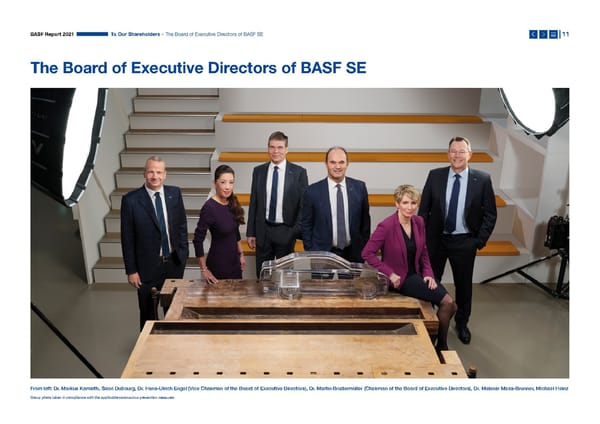
BASF Report 2021 To Our Shareholders – The Board of Executive Directors of BASF SE 11 The Board of Executive Directors of BASF SE From left: Dr. Markus Kamieth, Saori Dubourg, Dr. Hans-Ulrich Engel (Vice Chairman of the Board of Executive Directors), Dr. Martin Brudermüller (Chairman of the Board of Executive Directors), Dr. Melanie Maas-Brunner, Michael Heinz Group photo taken in compliance with the applicable coronavirus prevention measures
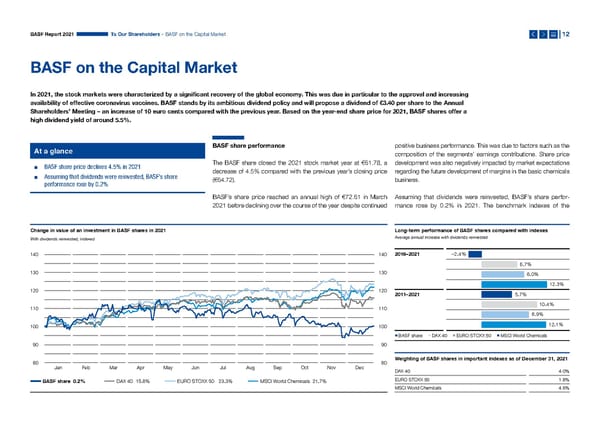
BASF Report 2021 To Our Shareholders – BASF on the Capital Market 12 BASF on the Capital Market In 2021, the stock markets were characterized by a significant recovery of the global economy. This was due in particular to the approval and increasing availability of effective coronavirus vaccines. BASF stands by its ambitious dividend policy and will propose a dividend of €3.40 per share to the Annual Shareholders’ Meeting – an increase of 10 euro cents compared with the previous year. Based on the year-end share price for 2021, BASF shares offer a high dividend yield of around 5.5%. At a glance BASF share performance positive business performance. This was due to factors such as the composition of the segments’ earnings contributions. Share price ▪ BASF share price declines 4.5% in 2021 The BASF share closed the 2021 stock market year at €61.78, a development was also negatively impacted by market expectations ▪ Assuming that dividends were reinvested, BASF’s share decrease of 4.5% compared with the previous year’s closing price regarding the future development of margins in the basic chemicals performance rose by 0.2% (€64.72). business. BASF’s share price reached an annual high of €72.61 in March Assuming that dividends were reinvested, BASF’s share perfor- 2021 before declining over the course of the year despite continued mance rose by 0.2% in 2021. The benchmark indexes of the Change in value of an investment in BASF shares in 2021 Long-term performance of BASF shares compared with indexes With dividends reinvested; indexed Average annual increase with dividends reinvested 140 140 2016–2021 –2.4% 6.7% 130 130 8.0% 12.3% 120 120 2011–2021 5.7% 110 110 10.4% 8.9% 100 100 12.1% ▪ ▪ ▪ ▪ BASF share DAX 40 EURO STOXX 50 MSCI World Chemicals 90 90 80 80 Weighting of BASF shares in important indexes as of December 31, 2021 Jan Feb Mar Apr May Jun Jul Aug Sep Oct Nov Dec DAX 40 4.0% BASF share 0.2% DAX 40 15.8% EURO STOXX 50 23.3% MSCI World Chemicals 21.7% EURO STOXX 50 1.8% MSCI World Chemicals 4.6%
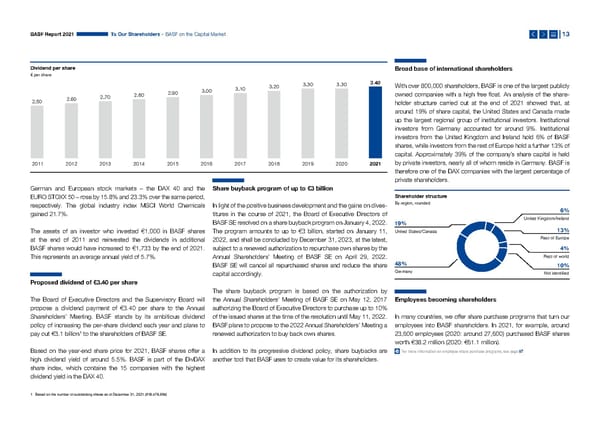
BASF Report 2021 To Our Shareholders – BASF on the Capital Market 13 Dividend per share Broad base of international shareholders € per share 3.20 3.30 3.30 3.40 With over 800,000 shareholders, BASF is one of the largest publicly 2.90 3.00 3.10 2.70 2.80 owned companies with a high free float. An analysis of the share- 2.50 2.60 holder structure carried out at the end of 2021 showed that, at around 19% of share capital, the United States and Canada made up the largest regional group of institutional investors. Institutional investors from Germany accounted for around 9%. Institutional investors from the United Kingdom and Ireland hold 6% of BASF shares, while investors from the rest of Europe hold a further 13% of capital. Approximately 39% of the company’s share capital is held 2011 2012 2013 2014 2015 2016 2017 2018 2019 2020 2021 by private investors, nearly all of whom reside in Germany. BASF is therefore one of the DAX companies with the largest percentage of private shareholders. German and European stock markets – the DAX 40 and the Share buyback program of up to €3 billion EURO STOXX 50 – rose by 15.8% and 23.3% over the same period, Shareholder structure respectively. The global industry index MSCI World Chemicals In light of the positive business development and the gains on dives- By region, rounded gained 21.7%. titures in the course of 2021, the Board of Executive Directors of 6% BASF SE resolved on a share buyback program on January 4, 2022. United Kingdom/Ireland 19% The assets of an investor who invested €1,000 in BASF shares The program amounts to up to €3 billion, started on January 11, United States/Canada 13% at the end of 2011 and reinvested the dividends in additional 2022, and shall be concluded by December 31, 2023, at the latest, Rest of Europe BASF shares would have increased to €1,733 by the end of 2021. subject to a renewed authorization to repurchase own shares by the 4% This represents an average annual yield of 5.7%. Annual Shareholders’ Meeting of BASF SE on April 29, 2022. Rest of world BASF SE will cancel all repurchased shares and reduce the share 48% 10% capital accordingly. Germany Not identified Proposed dividend of €3.40 per share The share buyback program is based on the authorization by The Board of Executive Directors and the Supervisory Board will the Annual Shareholders’ Meeting of BASF SE on May 12, 2017 Employees becoming shareholders propose a dividend payment of €3.40 per share to the Annual authorizing the Board of Executive Directors to purchase up to 10% Shareholders’ Meeting. BASF stands by its ambitious dividend of the issued shares at the time of the resolution until May 11, 2022. In many countries, we offer share purchase programs that turn our policy of increasing the per-share dividend each year and plans to BASF plans to propose to the 2022 Annual Shareholders’ Meeting a employees into BASF shareholders. In 2021, for example, around pay out €3.1 billion1 to the shareholders of BASF SE. renewed authorization to buy back own shares. 23,600 employees (2020: around 27,600) purchased BASF shares worth €38.2 million (2020: €61.1 million). Based on the year-end share price for 2021, BASF shares offer a In addition to its progressive dividend policy, share buybacks are For more information on employee share purchase programs, see page 97 high dividend yield of around 5.5%. BASF is part of the DivDAX another tool that BASF uses to create value for its shareholders. share index, which contains the 15 companies with the highest dividend yield in the DAX 40. 1 Based on the number of outstanding shares as of December 31, 2021 (918,478,694)
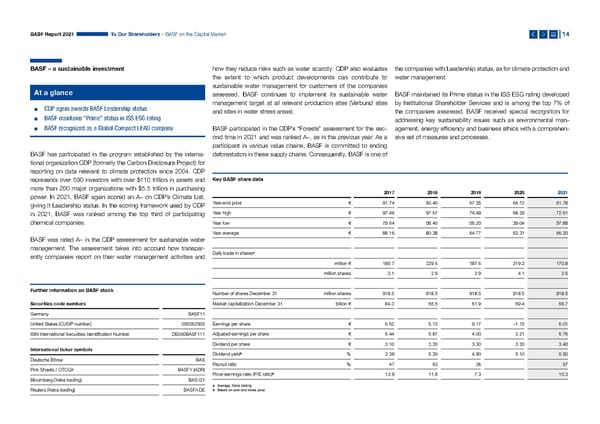
BASF Report 2021 To Our Shareholders – BASF on the Capital Market 14 BASF – a sustainable investment how they reduce risks such as water scarcity. CDP also evaluates the companies with Leadership status, as for climate protection and the extent to which product developments can contribute to water management. sustainable water management for customers of the companies At a glance assessed. BASF continues to implement its sustainable water BASF maintained its Prime status in the ISS ESG rating developed ▪ CDP again awards BASF Leadership status management target at all relevant production sites (Verbund sites by Institutional Shareholder Services and is among the top 7% of and sites in water stress areas). the companies assessed. BASF received special recognition for ▪ BASF maintains “Prime” status in ISS ESG rating address ing key sustainability issues such as environmental man- ▪ BASF recognized as a Global Compact LEAD company BASF participated in the CDP’s “Forests” assessment for the sec- agement, energy efficiency and business ethics with a comprehen- ond time in 2021 and was ranked A–, as in the previous year. As a sive set of measures and processes. participant in various value chains, BASF is committed to ending BASF has participated in the program established by the interna- deforestation in these supply chains. Consequently, BASF is one of tional organization CDP (formerly the Carbon Disclosure Project) for reporting on data relevant to climate protection since 2004. CDP represents over 590 investors with over $110 trillion in assets and Key BASF share data more than 200 major organizations with $5.5 trillion in purchasing 2017 2018 2019 2020 2021 power. In 2021, BASF again scored an A– on CDP’s Climate List, giving it Leadership status. In the scoring framework used by CDP Year-end price € 91.74 60.40 67.35 64.72 61.78 in 2021, BASF was ranked among the top third of participating Year high € 97.46 97.67 74.49 68.29 72.61 chemical companies. Year low € 79.64 58.40 56.20 39.04 57.88 Year average € 88.16 80.38 64.77 53.31 66.20 BASF was rated A– in the CDP assessment for sustainable water management. The assessment takes into account how transpar - ently companies report on their water management activities and Daily trade in sharesa million € 185.7 229.6 187.6 219.2 170.8 million shares 2.1 2.9 2.9 4.1 2.6 Further information on BASF stock Number of shares December 31 million shares 918.5 918.5 918.5 918.5 918.5 Securities code numbers Market capitalization December 31 billion € 84.3 55.5 61.9 59.4 56.7 Germany BASF11 United States (CUSIP number) 055262505 Earnings per share € 6.62 5.12 9.17 –1.15 6.01 ISIN International Securities Identification Number DE000BASF111 Adjusted earnings per share € 6.44 5.87 4.00 3.21 6.76 Dividend per share € 3.10 3.20 3.30 3.30 3.40 International ticker symbols Dividend yieldb % 3.38 5.30 4.90 5.10 5.50 Deutsche Börse BAS Payout ratio % 47 63 36 . 57 Pink Sheets / OTCQX BASFY (ADR) Price-earnings ratio (P/E ratio)b 13.9 11.8 7.3 . 10.3 Bloomberg (Xetra trading) BAS GY a Average, Xetra trading Reuters (Xetra trading) BASFn.DE b Based on year-end share price
BASF Report 2021 To Our Shareholders – BASF on the Capital Market 15 1 In Sustainalytics’ ESG Risk Ratings, BASF is ranked among the top Close dialog with the capital market At a virtual Investor Update in September 2021, Dr. Martin 10% of companies in diversified chemicals. It was commended for Brudermüller and Dr. Markus Kamieth informed investors about the fact that its sustainability targets are reflected in the compensa- the BASF Group’s two major growth projects: our future Verbund tion for the Board of Executive Directors, underlining strong overall At a glance site in Zhanjiang, China, and our battery materials activities. management of environmental, social and governance matters. ▪ Virtual formats facilitate dialog during coronavirus pandemic Finally, Dr. Melanie Maas-Brunner offered analysts and investors an BASF was again recognized as a Global Compact LEAD company ▪ Capital Markets Day in March 2021, Investor Update in insight into the BASF Group’s research and development in Decem- by the U.N. Global Compact in 2021. BASF consistently supports September 2021 and R&D Webcast in December 2021 ber 2021. In a webcast, she presented, among other topics, contri- the U.N. Global Compact and its 10 principles of responsible busi- butions of research to sustainability in the field of electromobility. ness conduct and the Sustainable Development Goals. Our corporate strategy aims to create long-term value. We support this strategy through regular and transparent communication with Analysts and investors have confirmed the quality of our financial BASF was among the top 10% in the World Benchmarking Alliance’s the capital market. In light of the coronavirus pandemic, we almost market communications. For instance, we were again named “Best (WBA) Food and Agriculture Benchmark, which assessed 350 com- exclusively used virtual formats such as video or conference calls for IR” in the materials sector in the annual survey conducted by Britain’s panies from the food and agricultural sector on sustainable business dialog in 2021. We engage with institutional investors and rating IR Magazine. practices. agencies in numerous one-on-one meetings, as well as at road- For more information about BASF stock, see basf.com/share For more information on the key sustainability indexes, see basf.com/sustainabilityindexes shows and conferences worldwide, and give private investors an For more information on the 2022–2023 share buyback program, see basf.com/sharebuyback For more information on energy and climate protection, see page 126 onward insight into BASF at informational events. For more information on the Capital Markets Day 2021, see basf.com/CMD21 For more information on air and soil, see page 133 For more information on the Investor Update 2021, see basf.com/investor-update For more information on the procurement of certified palm oil and palm kernel oil, see page 112 In March 2021, Dr. Martin Brudermüller presented our path and our For more information on the R&D Webcast 2021, see basf.com/rd-webcast-2021 onward ambitious climate neutrality targets at a virtual Capital Markets Day. Register for the newsletter with current topics and dates at basf.com/share/newsletter BASF aims to achieve net zero CO emissions2 by 2050. Based on Contact the Investor Relations team by phone at +49 621 60-48230 or email ir@basf.com 2 Analysts’ recommendations its progress in developing low-emission and carbon-free technolo- gies, BASF is also setting an ambitious medium-term 2030 target Around 30 financial analysts regularly publish studies on BASF. The for reductions in greenhouse gas emissions: BASF now wants to latest analyst recommendations for our shares as well as the reduce its greenhouse gas emissions worldwide by 25% compared average target share price ascribed to BASF by analysts can be with 2018 – and to achieve this despite targeted growth and the found online at basf.com/analystestimates. construction of a large Verbund site in Zhanjiang, China. Dr. Markus Kamieth and Saori Dubourg also presented the Industrial Solutions and Nutrition & Care segments in more detail during the virtual Capital Markets Day. 1 Sustainalytics provides institutional investors and companies with ESG and corporate governance research, ratings and analytics. 2 Based on the BASF Group’s Scope 1 and Scope 2 emissions; other greenhouse gases are converted into CO equivalents in accordance with the Greenhouse Gas Protocol 2
BASF Report 2021 16 Contents Management’s To Our Shareholders Management’s Report Corporate Governance Consolidated Financial Statements Report Overviews 2 Overview 17 The BASF Group’s Business Year 52 Sustainability Along the Value Chain 96 Nonfinancial Statement Disclosures 18 Economic Environment 52 We Value People and Treat Them with Respect 97 TCFD Recommendations Index 19 Results of Operations 56 Responsible Procurement 109 Net Assets 61 Safe and Efficient Production 117 The BASF Group 20 Financial Position 63 Sustainable Solutions 141 How We Create Value 24 Actual Development Compared With Outlook for 2021 67 Forecast 145 Our Strategy 26 Business Review by Segment 69 Economic Environment in 2022 145 Chemicals 72 Our Strategic Action Areas 28 Outlook 2022 148 Materials 76 Our Values and Global Standards 31 Opportunities and Risks 151 Industrial Solutions 79 Business Models of the Segments 33 Surface Technologies 82 Targets and Target Achievement 2021 36 Nutrition & Care 85 Material Investments and Portfolio Measures 38 ricultural Solutions Ag 88 Our Steering Concept 42 Other 92 Our Sustainability Concept 45 Non-Integral Oil and Gas Business 93 Innovation 49 Regional Results 94 E.U. Taxonomy 95
BASF Report 2021 Management’s Report – Overview 17 Overview share of the Group’s taxonomy-eligible sales, investments (including Directors and the Supervisory Board (excluding the disclosures acquisitions) and operating expenses for the 2021 business year required by takeover law in accordance with section 315a HGB), relating to the environmental objectives of “climate change miti- compliance reporting and the Declaration of Conformity pursuant to The Management’s Report comprises the chapter of the gation” and “adaptation to climate change.” section 161 of the German Stock Corporation Act. Pur suant to same name on pages 16 to 160, as well as the disclosures section 317(2) sentence 6 HGB, the auditor checked that the disclo- required by takeover law and the Declaration of Corporate Within the scope of the annual audit, KPMG checked pursuant to sures according to section 315d HGB were made. Governance, which are presented in the Corporate Gover- section 317(2) sentence 4 HGB that the NFS was presented in nance chapter. The Nonfinancial Statement (NFS) is integrated accordance with the statutory requirements. KPMG also conducted into the Management’s Report. a limited assurance of the NFS. An assurance statement of the Compensation Report limited assurance can be found online at basf.com/nfs-audit-2021. The assurance was conducted in accordance with ISAE 3000 The Compensation Report is no longer a component of the Nonfinancial Statement (NFS) in accordance with (Assurance Engagements other than Audits or Reviews of Historical Management’s Report. The Compensation Report in accordance sections 315b and 315c of the German Commercial Code Financial Information) and ISAE 3410 (Assurance Engagements on with section 162 of the German Stock Corporation Act (AktG) and (HGB) Greenhouse Gas Statements), the relevant international assurance the assurance statement of the substantive and formal audit issued standards for sustainability reporting. by the auditor have been made publicly available on the BASF The NFS disclosures can be found in the relevant sections of the website at basf.com/compensationreport. Management’s Report and have been prepared in accordance with the appropriate frameworks: the Global Reporting Initiative Stan- Disclosures required by takeover law in accordance with dards (“Comprehensive” application option) and the reporting section 315a HGB Content and structure of the Management’s Report requirements of the U.N. Global Compact. The disclosures required by takeover law in accordance with sec- An overview of the segments’ business models is provided in a The table on the following page shows the sections and subsections tion 315a of the German Commercial Code (HGB) can be found in separate chapter. Material investments and portfolio measures by in which the individual disclosures can be found. In addition to a the Corporate Governance chapter starting on page 161. They form our segments have also been integrated into the chapter of the description of the business model, the NFS includes disclosures on part of the Management’s Report, which is audited as part of the same name. This improves the clarity of the information on our the following matters, to the extent that they are required to under- annual audit. segments. stand the development and performance of the business, the Group’s position and the impact of business development on the following matters: Consolidated Declaration of Corporate Governance in Recommendations of the Task Force on Climate-related accordance with section 315d HGB in connection with Financial Disclosures – Environmental matters section 289f HGB – Employee-related matters BASF supports the recommendations of the Task Force on Climate- – Social matters The Consolidated Declaration of Corporate Governance in accor- related Financial Disclosures (TCFD). Disclosures recommended by – Respect for human rights dance with section 315d HGB in connection with section 289f HGB the TCFD are presented in a number of places throughout this – Anti-corruption and bribery matters can be found in the Corporate Governance chapter from page 185 report. The table on page 19 shows the sections and subsections in onward and is a component of the Management’s Report. It com- which the relevant information can be found. The table is divided In accordance with the E.U. Taxonomy Regulation and the supple- prises the Corporate Governance Report including the description into four key areas in line with the TCFD recommendations: gover- mentary delegated acts, the NFS includes, for the first time, the of the diversity concept for the composition of the Board of Exe cu tive nance, strategy, risk management, and metrics and targets.
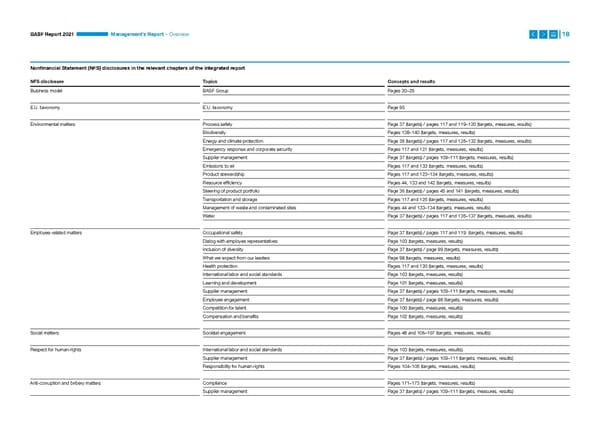
BASF Report 2021 Management’s Report – Overview 18 Nonfinancial Statement (NFS) disclosures in the relevant chapters of the integrated report NFS disclosure Topics Concepts and results Business model BASF Group Pages 20–25 E.U. taxonomy E.U. taxonomy Page 95 Environmental matters Process safety Page 37 (targets) / pages 117 and 119–120 (targets, measures, results) Biodiversity Pages 138–140 (targets, measures, results) Energy and climate protection Page 36 (targets) / pages 117 and 126–132 (targets, measures, results) Emergency response and corporate security Pages 117 and 121 (targets, measures, results) Supplier management Page 37 (targets) / pages 109–111 (targets, measures, results) Emissions to air Pages 117 and 133 (targets, measures, results) Product stewardship Pages 117 and 123–124 (targets, measures, results) Resource efficiency Pages 44, 133 and 142 (targets, measures, results) Steering of product portfolio Page 36 (targets) / pages 45 and 141 (targets, measures, results) Transportation and storage Pages 117 and 125 (targets, measures, results) Management of waste and contaminated sites Pages 44 and 133–134 (targets, measures, results) Water Page 37 (targets) / pages 117 and 135–137 (targets, measures, results) Employee-related matters Occupational safety Page 37 (targets) / pages 117 and 119 (targets, measures, results) Dialog with employee representatives Page 103 (targets, measures, results) Inclusion of diversity Page 37 (targets) / page 99 (targets, measures, results) What we expect from our leaders Page 98 (targets, measures, results) Health protection Pages 117 and 120 (targets, measures, results) International labor and social standards Page 103 (targets, measures, results) Learning and development Page 101 (targets, measures, results) Supplier management Page 37 (targets) / pages 109–111 (targets, measures, results) Employee engagement Page 37 (targets) / page 98 (targets, measures, results) Competition for talent Page 100 (targets, measures, results) Compensation and benefits Page 102 (targets, measures, results) Social matters Societal engagement Pages 48 and 106–107 (targets, measures, results) Respect for human rights International labor and social standards Page 103 (targets, measures, results) Supplier management Page 37 (targets) / pages 109–111 (targets, measures, results) Responsibility for human rights Pages 104–105 (targets, measures, results) Anti-corruption and bribery matters Compliance Pages 171–173 (targets, measures, results) Supplier management Page 37 (targets) / pages 109–111 (targets, measures, results)
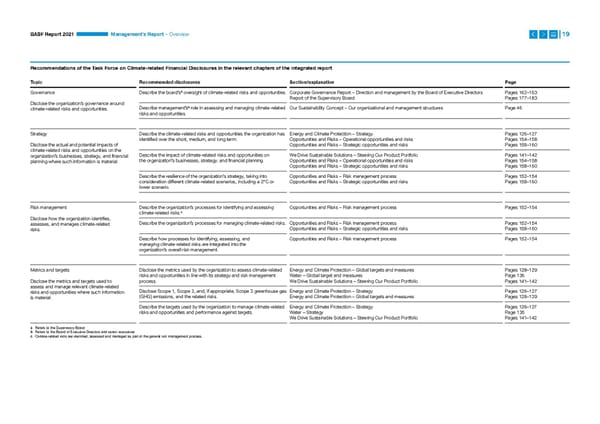
BASF Report 2021 Management’s Report – Overview 19 Recommendations of the Task Force on Climate-related Financial Disclosures in the relevant chapters of the integrated report Topic Recommended disclosures Section/explanation Page Governance Describe the board’sa oversight of climate-related risks and opportunities. Corporate Governance Report – Direction and management by the Board of Executive Directors Pages 162–163 Report of the Supervisory Board Pages 177–183 Disclose the organization’s governance around climate-related risks and opportunities. Describe management’sb role in assessing and managing climate-related Our Sustainability Concept – Our organizational and management structures Page 46 risks and opportunities. Strategy Describe the climate-related risks and opportunities the organization has Energy and Climate Protection – Strategy Pages 126–127 identified over the short, medium, and long term. Opportunities and Risks – Operational opportunities and risks Pages 154–158 Disclose the actual and potential impacts of Opportunities and Risks – Strategic opportunities and risks Pages 158–160 climate-related risks and opportunities on the organization’s businesses, strategy, and financial Describe the impact of climate-related risks and opportunities on We Drive Sustainable Solutions – Steering Our Product Portfolio Pages 141–142 planning where such information is material. the organization’s businesses, strategy, and financial planning. Opportunities and Risks – Operational opportunities and risks Pages 154–158 Opportunities and Risks – Strategic opportunities and risks Pages 158–160 Describe the resilience of the organization’s strategy, taking into Opportunities and Risks – Risk management process Pages 152–154 consideration different climate-related scenarios, including a 2°C or Opportunities and Risks – Strategic opportunities and risks Pages 158–160 lower scenario. Risk management Describe the organization’s processes for identifying and assessing Opportunities and Risks – Risk management process Pages 152–154 climate- related risks.c Disclose how the organization identifies, assesses, and manages climate-related Describe the organization’s processes for managing climate-related risks. Opportunities and Risks – Risk management process Pages 152–154 risks. Opportunities and Risks – Strategic opportunities and risks Pages 158–160 Describe how processes for identifying, assessing, and Opportunities and Risks – Risk management process Pages 152–154 managing climate-related risks are integrated into the organization’s overall risk management. Metrics and targets Disclose the metrics used by the organization to assess climate-related Energy and Climate Protection – Global targets and measures Pages 128–129 risks and opportunities in line with its strategy and risk management Water – Global target and measures Page 136 Disclose the metrics and targets used to process. We Drive Sustainable Solutions – Steering Our Product Portfolio Pages 141–142 assess and manage relevant climate-related risks and opportunities where such information Disclose Scope 1, Scope 2, and, if appropriate, Scope 3 greenhouse gas Energy and Climate Protection – Strategy Pages 126–127 is material. (GHG) emissions, and the related risks. Energy and Climate Protection – Global targets and measures Pages 128–129 Describe the targets used by the organization to manage climate-related Energy and Climate Protection – Strategy Pages 126–127 risks and opportunities and performance against targets. Water – Strategy Page 135 We Drive Sustainable Solutions – Steering Our Product Portfolio Pages 141–142 a Refers to the Supervisory Board b Refers to the Board of Executive Directors and senior executives c Climate-related risks are identified, assessed and managed as part of the general risk management process.
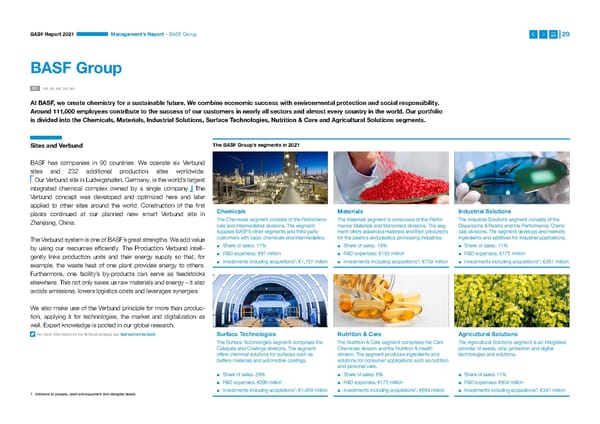
BASF Report 2021 Management’s Report – BASF Group 20 BASF Group GRI 102, 201, 202, 203, 301 At BASF, we create chemistry for a sustainable future. We combine economic success with environmental protection and social r esponsibility. Around 111,000 employees contribute to the success of our customers in nearly all sectors and almost every country in the world. Our portfolio is divided into the Chemicals, Materials, Industrial Solutions, Surface Technologies, Nutrition & Care and Agricultural Solutions segments. Sites and Verbund The BASF Group’s segments in 2021 BASF has companies in 90 countries. We operate six V erbund sites and 232 additional production sites worldwide. Our Verbund site in Ludwigshafen, Germany, is the world’s largest integrated chemical complex owned by a single company. The Verbund concept was developed and optimized here and later applied to other sites around the world. Construction of the first plants continued at our planned new smart Verbund site in Chemicals Materials Industrial Solutions Zhanjiang, China. The Chemicals segment consists of the Petrochemi- The Materials segment is composed of the Perfor- The Industrial Solutions segment consists of the cals and Intermediates divisions. The segment mance Materials and Monomers divisions. The seg- Dispersions & Resins and the Performance Chemi- supplies BASF’s other segments and third-party ment offers advanced materials and their precursors cals divisions. The segment develops and markets The Verbund system is one of BASF’s great strengths. We add value cus tomers with basic chemicals and intermediates. for the plastics and plastics processing industries. ingredients and additives for industrial applications. by using our resources efficiently. The Production Verbund intelli- ▪ Share of sales: 17% ▪ Share of sales: 19% ▪ Share of sales: 11% gently links production units and their energy supply so that, for ▪ R&D expenses: €97 million ▪ R&D expenses: €193 million ▪ R&D expenses: €175 million 1 1 1 example, the waste heat of one plant provides energy to others. ▪ Investments including acquisitions : €1,157 million ▪ Investments including acquisitions : €709 million ▪ Investments including acquisitions : €361 million Furthermore, one facility’s by-products can serve as feedstocks elsewhere. This not only saves us raw materials and energy – it also avoids emissions, lowers logistics costs and leverages synergies. We also make use of the Verbund principle for more than produc- tion, applying it for technologies, the market and digitalization as well. Expert knowledge is pooled in our global research. For more information on the Verbund concept, see basf.com/en/verbund Surface Technologies Nutrition & Care Agricultural Solutions The Surface Technologies segment comprises the The Nutrition & Care segment comprises the Care The Agricultural Solutions segment is an integrated Catalysts and Coatings divisions. The segment Chemicals division and the Nutrition & Health provider of seeds, crop protection and digital offers chemical solutions for surfaces such as division. The segment produces ingredients and technologies and solutions. battery materi als and automotive coatings. solutions for consumer applications such as nutrition and personal care. ▪ Share of sales: 29% ▪ Share of sales: 8% ▪ Share of sales: 11% ▪ R&D expenses: €296 million ▪ R&D expenses: €172 million ▪ R&D expenses: €904 million 1 1 1 ▪ Investments including acquisitions : €1,469 million ▪ Investments including acquisitions : €654 million ▪ Investments including acquisitions : €347 million 1 Additions to property, plant and equipment and intangible assets
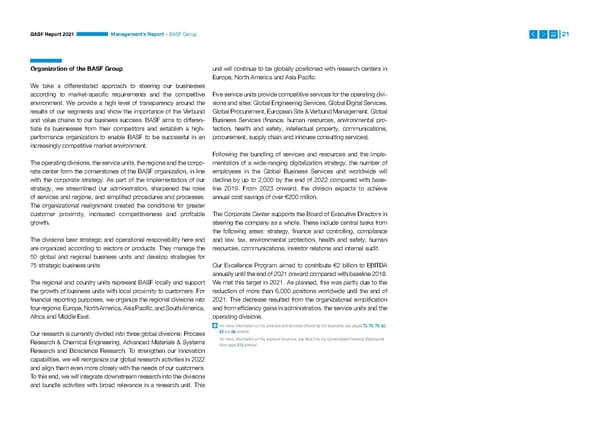
BASF Report 2021 Management’s Report – BASF Group 21 Organization of the BASF Group unit will continue to be globally positioned with research centers in Europe, North America and Asia Pacific. We take a differentiated approach to steering our businesses according to market-specific requirements and the competitive Five service units provide competitive services for the operating divi- environment. We provide a high level of transparency around the sions and sites: Global Engineering Services, Global Digital Services, results of our segments and show the importance of the Verbund Global Procurement, European Site & Verbund Management, Global and value chains to our business success. BASF aims to differen- Business Services (finance, human resources, environmental pro- tiate its businesses from their competitors and establish a high- tection, health and safety, intellectual property, communications, performance organization to enable BASF to be successful in an procurement, supply chain and inhouse consulting services). increasingly competitive market environment. Following the bundling of services and resources and the imple- The operating divisions, the service units, the regions and the corpo- mentation of a wide-ranging digitalization strategy, the number of rate center form the cornerstones of the BASF organization, in line employees in the Global Business Services unit worldwide will with the corporate strategy. As part of the implementation of our decline by up to 2,000 by the end of 2022 compared with base- strategy, we streamlined our administration, sharpened the roles line 2019. From 2023 onward, the division expects to achieve of services and regions, and simplified procedures and processes. annual cost savings of over €200 million. The organizational realignment created the conditions for greater customer proximity, increased competitiveness and profitable The Corporate Center supports the Board of Executive Directors in growth. steering the company as a whole. These include central tasks from the following areas: strategy, finance and controlling, compliance The divisions bear strategic and operational responsibility here and and law, tax, environmental protection, health and safety, human are organized according to sectors or products. They manage the resources, communications, investor relations and internal audit. 50 global and regional business units and develop strategies for 75 strategic business units. Our Excellence Program aimed to contribute €2 billion to EBITDA annually until the end of 2021 onward compared with baseline 2018. The regional and country units represent BASF locally and support We met this target in 2021. As planned, this was partly due to the the growth of business units with local proximity to customers. For reduction of more than 6,000 positions worldwide until the end of financial reporting purposes, we organize the regional divisions into 2021. This decrease resulted from the organizational simplification four regions: Europe, North America, Asia Pacific, and South America, and from efficiency gains in administration, the service units and the Africa and Middle East. operating divisions. For more information on the products and services offered by the segments, see pages 72, 76, 79, 82, Our research is currently divided into three global divisions: Process 85 and 88 onward Research & Chemical Engineering, Advanced Materials & Systems For more information on the segment structure, see Note 5 to the Consolidated Financial Statements from page 213 onward Research and Bioscience Research. To strengthen our innovation capabilities, we will reorganize our global research activities in 2022 and align them even more closely with the needs of our customers. To this end, we will integrate downstream research into the divisions and bundle activities with broad relevance in a research unit. This
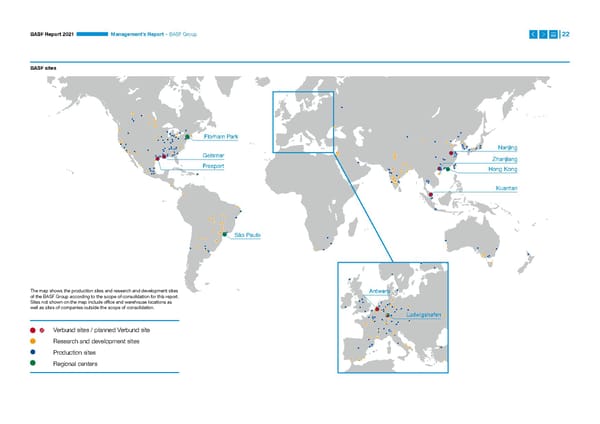
BASF Report 2021 Management’s Report – BASF Group 22 BASF sites Florham Park Nanjing Geismar Zhanjiang Freeport Hong Kong Kuantan São Paulo The map shows the production sites and research and development sites Antwerp of the BASF Group according to the scope of consolidation for this report. Sites not shown on the map include office and warehouse locations as well as sites of companies outside the scope of consolidation. Ludwigshafen Verbund sites / planned Verbund site Research and development sites Production sites Regional centers
BASF Report 2021 Management’s Report – BASF Group 23 BASF sales by region 2021 BASF sales by industry 2021 Corporate legal structure Location of customer Direct customers 7% As the publicly listed parent company of the BASF Group, BASF SE South America, Africa, > 20% Chemicals and plastics | Transportation (respectively) takes a central position: Directly or indirectly, it holds the shares in Middle East 39% 10%–20% Agriculture | Consumer goods (respectively) the companies belonging to the BASF Group, and is also one of Europe Construction | Electronics | Energy and resources | Health and the largest operating companies. The majority of Group companies €78,598 million < 10% nutrition (respectively) 27% cover a broad spectrum of our business. In the BASF Group Con- Asia Pacific solidated Financial Statements, 258 companies including BASF SE 27% are fully consolidated. We consolidate nine joint operations on a North America Business and competitive environment proportional basis and account for 27 companies using the equity method. BASF’s global presence means that it operates in the context For more information, see Note 2 to the Consolidated Financial Statements from page 205 onward Procurement and sales markets of local, regional and global developments and a wide range of conditions. These include: 1 BASF supplies products and services to around 90,000 customers – Global economic environment from various sectors in almost every country in the world. Our cus- – Legal and political requirements (such as European Union regula- tomer portfolio ranges from major global customers and small and tions) medium-sized enterprises to end consumers. – International trade agreements – Industry standards 2 We work with over 70,000 Tier 1 suppliers worldwide. They supply – Environmental agreements (such as the E.U. Emissions Trading us with important raw materials, chemicals, investment goods and System) consumables, and perform a range of services. Important raw – Social aspects (such as the U.N. Universal Declaration of Human materials (based on volume) include naphtha, liquid gas, natural Rights) gas, benzene and caustic soda. For more information on customers, see page 28 onward; for more information on suppliers, see BASF holds one of the top three market positions in around 80% page 109 onward of the business areas in which it is active. Our most important global competitors include Arkema, Bayer, Clariant, Corteva, Covestro, Dow, Dupont, DSM, Evonik, Huntsman, Lanxess, SABIC, Sinopec, Solvay, Sumitomo Chemical, Syngenta, Wanhua and many hundreds of local and regional competitors. We expect com- petitors from Asia and the Middle East in particular to continue to grow in significance in the years ahead. 1 The number of customers refers to all external companies (sold-to parties) that had contracts with the BASF Group in the business year concerned under which sales were generated. 2 BASF considers all direct suppliers of the BASF Group in the business year concerned as Tier 1 suppliers. These are suppliers that provide us with raw materials, investment goods, consumables and services. Suppliers can be natural persons, companies or legal persons under public law.
BASF Report 2021 Management’s Report – How We Create Value 24 How We Create Value 1 3 Inputs Outputs 2 Business The following overview provides examples of how we create value for our stakeholders. model It is modeled on the framework of the International Integrated Reporting Council (IIRC). 5 4 The content of the graphic has been audited within the scope of the relevant sections of Discover the interactive How We Create Value graphic in the Impact Outcomes the Management’s Report in which they appear. BASF Online Report at basf.com/how-we-create-value Inputs 1 Financial Innovation Operations Environment Employees Partnerships Our aim is to ensure solvency, We develop innovative Safety, quality, and reliability We use natural resources to Everything we do is based Trust-based relationships We use a wide range of limit financial risks and optimize solutions for and with our are key to excellence in our manufacture products and on the expertise, knowledge, are crucial to our license to resources to implement our the cost of capital. customers to expand our production and plant operations. solutions with high value added motivation and conduct of operate and our reputation. customer-focused strategy leading position. for our customers. our employees. €87.4 billion ~10,000 €3.4 billion 1.3 million metric tons 111,047 ~280 Total assets R&D employees Capex Renewable raw materials Employees around the world Research collaborations 3 48.2% €2.2 billion ~60 million MWh 1,695 million m €11.1 billion >70,000 Equity ratio R&D expenses Electricity and steam demand Total water usage Personnel expenses Suppliers Business model 2 Corporate purpose Our targets How we operate We create chemistry ▪ Profitable growth ▪ Our customers are at the core of our strategy. We implement our for a sustainable future ▪ Effective climate protection ▪ Sustainability and innovation is at the center of everything we do and a driver for growth and value. corporate purpose ▪ Product portfolio geared to innovation and sustainability ▪ Safety is always our number one priority. ▪ Responsible procurement ▪ BASF’s Verbund structure is the backbone of our efficient and reliable production. ▪ Resource-efficient and safe production ▪ Our six segments are aligned with value chains and address customer needs with differentiated solutions ▪ Employee engagement and diversity and business strategies. ▪ We have a global, customer-focused presence. ▪ Effective corporate governance ensures responsible conduct. ▪ We value our stakeholders and treat them with respect.
Outputs 3 Financial Innovation Operations Environment Employees Partnerships We focus on material €78.6 billion ~820 ~45,000 47.0% 25.6% 787 sustainability topics and Sales New patents worldwide Sales products Share of our waste recycled or Women in leadership positions Suppliers screened through evaluate the opportunities and thermally recovered Together for Sustainability risks of our actions €7.8 billion €24.1 billion 7.3 million metric tons 78.5% 82% 77 EBIT before special items Accelerator sales CO avoided by the Verbund Water demand Engagement index according to Internal audits on our 2 and combined heat and power generation recirculated 2020 employee survey compliance standards 1 Outcomes 4 Economic Environmental Social We aim to increase our positive contributions, minimize negative We make positive contributions by We make positive contributions by creating products that We make positive contributions because we impacts and carefully assess ▪ Driving forward growth, progress and value creation ▪ Contribute to climate protection ▪ Offer products that improve people’s quality of life conflicting goals ▪ Strengthening our customers’ competitiveness and innovative ▪ Conserve resources, avoid waste and strengthen circularity ▪ Provide attractive jobs and promote diversity strength ▪ Pave the way for climate-friendly mobility ▪ Pay taxes and competitive wages and salaries ▪ Accelerating the digital transformation of the industry ▪ Are environmentally friendly and safe to use ▪ Promote integration and help overcome social challenges ▪ Offering our investors an attractive dividend yield Potential negative impacts Negative impacts Potential negative impacts ▪ Weaker growth stimulus due to the coronavirus pandemic, the ▪ The emission of CO and other gases that affect the climate ▪ Risk of violation of labor, environmental and social standards 2 ongoing trade conflict between the United States and China, ▪ Resource consumption and non-recyclable waste in the production of the raw materials we procure and an escalation of geopolitical conflicts ▪ Potential misuse or spillage of products ▪ Lower demand for employees in some areas ▪ A weaker share performance Our countermeasures Our countermeasures Our countermeasures ▪ Disciplined implementation of our corporate strategy ▪ Carbon management ▪ Careful selection, evaluation and development of suppliers ▪ Active portfolio management ▪ Circular Economy Program ▪ Projects to improve sustainability in the supply chains ▪ Systematic cost management ▪ Sustainable water and energy management ▪ Compliance Program and Code of Conduct ▪ Optimizing the cost of capital ▪ Responsible Care management (including product stewardship) ▪ Employee training program Impact We achieve long-term business success by creating value for our shareholders, our company, 5 the environment and society (see page 47 and basf.com/en/value-to-society) 1 The outcomes category shows examples of positive contributions as well as negative impacts and the measures we take to mitigate them.
Our Strategy BASF Report 2021 Management’s Report – Our Strategy 26 Our Strategy In this section: Strategic Action Areas GRI 102 Values and Global Standards Chemistry is our passion. As an industry leader, we want to be the most attractive partner for challenges that can be solved Business Models of the Segments with chemistry. That is why our customers are at the center of everything we do. We want to grow profitably and at the same Targets and Target Achievement 2021 time, create value for society and the environment. We help to change the world for the better with our expertise, our innovative Investments and Portfolio Measures and entrepreneurial spirit, and the power of our Verbund integration. This is our goal, embedded in our corporate purpose: Steering Concept We create chemistry for a sustainable future. Sustainability Concept Innovation The world is changing at a rapid pace – more and more urgently We also see these disruptive changes as an opportunity. As the Good to know than ever, solutions are needed for a more sustainable future. world’s largest chemical company, we want to lead the way and Chemistry plays a key role here. In almost all areas of life, it can help actively and responsibly shape the change. That is why we are overcome pressing global challenges with innovative products gradually switching our energy and raw material supplies to renew- and technologies – from climate change and using resources more able sources. We are strengthening our Verbund structure as the sparingly to feeding the world’s population. This belief is expressed basis for resource-efficient, safe and reliable production. We are in our corporate purpose and is what motivates us day in and day developing pioneering low-carbon production processes for our out: We create chemistry for a sustainable future. products. We are accelerating our innovation processes and deep- ening cooperation with partners to develop high-performance Our corporate purpose products that also require fewer resources and have a lower carbon footprint. We are harnessing the many opportunities of digitalization. We create chemistry for a sustainable future We are systematically aligning our portfolio with growth areas and Net Zero Accelerator future technologies, and are integrating sustainability into our value chains even more strongly. We create a working environment in The new Net Zero Accelerator unit started work on January 1, Our mission and motivation is to grow profitably and make a positive which our employees can thrive and contribute to BASF’s long-term 2022. It bundles the extensive cross-company activities with contribution to society and the environment. For example, BASF’s success. This is how we live our corporate purpose. which we want to achieve our ambitious climate protection solutions contribute to climate protection and help to prevent or For more information on our strategic action areas, see page 28 onward targets. The unit will initially have around 80 employees and recycle waste, produce healthy and affordable food, and enable report directly to the Chairman of the Board of Executive climate-smart mobility. Directors. It will focus on accelerating and implementing projects relating to low-CO production technologies, circular 2 At the same time, as an energy and resource-intensive company, we economy and renewable energies – driving forward BASF’s are facing what is probably the biggest transformation in our over transformation to a climate-neutral company. In parallel, our 150-year history: The shift toward a carbon-neutral and circular operating divisions will continue to work on divisional-specific economy and the associated landmarks such as the European carbon reduction projects. Green Deal demand from us new concepts and approaches – for the For more information on climate neutrality, see pages 27 and 126 to 132 way we produce, for our raw material base and for our energy supply.
In Focus: Climate Neutrality BASF Report 2021 Management’s Report – In Focus: Climate Neutrality 27 In focus: Our Journey to Climate Neutrality Climate change is the greatest challenge of the 21st century. Swift and resolute action is needed to ensure that the targets agreed in the Paris Climate Agreement can be achieved. We stand by this responsibility. In many areas, products and innovations based on chemistry are the key to a climate- neutral future. At the same time, we are working intensively to significantly reduce the carbon footprint of our production and thus of our products. Our target: net zero emissions by 2050. We have set ourselves an One thing is clear: The transformation will require significantly more ambitious milestone on this path. By 2030, we want to reduce the energy from renewable sources. Initial estimates suggest that at the greenhouse gas emissions from our production sites and our energy Ludwigshafen site in Germany alone, we would need to roughly purchases by 25% compared with 2018 – while growing production triple or quadruple our current electricity use (2021: 6.0 TWh) to volumes. This corresponds to a decrease of around 60% compared fully implement new, low-carbon electricity-based production pro- with 1990. We are intensely pursuing our climate protection targets cesses. To meet this demand, we are investing in our own power with investments of up to €4 billion by 2030. Our focus here is on assets, especially for wind power, and are increasingly buying green five strategic levers: We are increasingly meeting our energy electricity on the market (make & buy approach). needs from renewable sources (gray-to-green lever). We are increasingly relying on energy recovery to produce steam (power- Also critical to success are prices for renewable energy. Substi- to-steam lever). We are working to further improve the energy and tuting fossil fuels is only economically feasible at production costs of process efficiency of our plants (continuous opex lever). We are 4 to 5 cents/kWh. Consequently, there is an urgent need to expand increasingly replacing fossil resources with bio-based raw materials supply and reduce the levies and fees on electricity prices. In addi- (bio-based feedstocks lever). And together with partners, we are tion, globally comparable carbon pricing – or at least at G20 level – is pioneering nearly carbon-free production processes, especially for needed to ensure that climate-friendly processes are competitive emission- intensive basic chemicals (new technologies lever). internationally. For more information on energy and climate protection, see page 126 onward We want to play an active and responsible role in shaping the For more information on raw materials, see page 112 onward transition toward a climate-neutral society. This calls for new ways of thinking and working together. And it needs a political and regu- Our global climate protection targets latory environment that promotes innovation in climate protection, makes it possible to develop new, climate-smart processes that are –25% Net zero competitive internationally and, above all, resolutely drives forward Renewable energy is a central building block on BASF’s journey to the expansion of renewable energies – including through the appro- Reduction in our greenhouse gas Greenhouse gas emissions by climate neutrality. To enable us to meet our growing demand in the priate land use designations, rapid planning and approval proce- emissions by 2030 compared 2050 (Scope 1 and 2) future, we are gradually switching our supply agreements to green dures and the swift expansion of grid infrastructure. with 2018 (Scope 1 and 2) power and investing in our own plants. Find out more about how we are driving forward the transformation of our energy supply in the online report at report.basf.com.
BASF Report 2021 Management’s Report – Our Strategic Action Areas 28 Our Strategic Action Areas Our customers are our number one priority and are at the heart innovation and growth potential together with them. For instance, Good to know of our strategy. We want to be their most attractive partner for chal- we established interdisciplinary teams in our business units to even lenges that can be solved with chemistry. BASF supplies products better and more quickly address the needs of our most important and services to around 90,000 customers1 from almost all sectors customers. and countries around the world. Our customer portfolio ranges from major global customers and small and medium-sized enterprises to BASF’s strategic orientation is founded on a comprehensive end consumers. Our comprehensive product portfolio means that analysis of our markets and competitors. We continuously monitor we are active in many value chains and value creation networks. We global trends and anticipate the resulting growth opportunities and use various business strategies, which we adapt to the needs of risks. The following six strategic focus areas enable us to focus on individual industries and markets. These range from cost leadership our customers while strengthening our leading position in an increas- in basic chemicals to tailored system solutions for specific customer ingly volatile and competitive environment. applications. Innovation Selected awards Innovation is the bedrock of our success. BASF is a leader in the chemical industry with around 10,000 employ ees in research and The virtual car ▪ Ford: World Excellence Award development and R&D spending of around €2.2 billion. We are ▪ Dulux: Supplier of the Year Award The automotive industry is one of our most important customer expand ing this position by strengthening specific research activities, sectors. In February 2021, we launched an interactive platform ▪ 3M: Supplier of the Year Award for example in battery materials, polymer technologies, catalyst that showcases BASF’s wide range of solutions and innovation processes or biotechnological methods. In addition, we are bringing expertise in mobility: Customers can explore over 500 application We continue to drive forward our customer focus. We have refined research and development even closer together, incorporating our areas in a new virtual car – from high-performance plastics and our organizational structure to enable our operating divisions to customers’ requirements into our innovation processes even earlier coatings to automotive fluids, catalysts, cathode materials and flexibly address specific market requirements and differentiate them- and more intensively, and expanding cooperation with customers, more. Detailed information is provided on all products and solu- selves from the competition. universities, research institutions and other partners. To further tions. The virtual car offers a selection of different powertrain strengthen our innovation power, we will reorganize our global technologies: combustion engine, plug-in hybrid, battery electric We are also improving our customer relationships with a range of research activities in 2022 and bundle them in a global research unit vehicle and fuel cell vehicle. E-mobility solutions can also be filtered measures. For example, since 2019 we have been using the Net based in Ludwigshafen, Germany. by material properties such as battery efficiency, corrosion protec- Promoter System® worldwide to systematically record and optimize tion or thermal protection. our problem-solving skills, product quality and delivery reliability Our innovation pipeline is geared to sustainability – especially Discover the virtual car at basf-vcar.com based on direct customer feedback. We have been using a new climate protection and the circular economy. This lays the founda- IT-based customer relationship management system, Salesforce, tion for future growth: We are working intensively on fundamental since 2020. The application helps our sales employees to provide innovations for products, processes and business models, for customer support and simplifies their work. Above and beyond this, example in the chemical recycling of plastics, battery and catalyst we have intensified cooperation with our customers to leverage technologies, low-carbon production of basic chemicals, and digital, 1 The number of customers refers to all external companies (sold-to parties) that had contracts with the BASF Group in the business year concerned under which sales were generated.
BASF Report 2021 Management’s Report – Our Strategic Action Areas 29 more environmentally friendly agriculture. At the same time, we are the Hollandse Kust Zuid offshore wind farm, which Vattenfall expects We plan to invest €25.6 billion worldwide between now and 2026 driving forward product improvements in all business units that offer to commission in 2023. Together with RWE, we are developing to expand capacities based on market demand and to further our customers sustainability and competitive advantages, such as in a project concept for an offshore wind farm in the North Sea. In increase the availability, efficiency and flexibility of our plants. Our aim lightweight construction and surface solutions for the automotive addition, we have signed long-term purchase agreements for here is to be close to our customers and to grow together with them. industry, bio-based and biodegradable active ingredients for the renewable energy with suppliers such as Ørsted and Engie. For more information on our production sites and the Verbund structure, see page 20 cosmetics, detergent and cleaner industries, and energy-efficient building materials. Another focus is our product portfolio. We already met our 2025 Digitalization For more information on innovation, see page 49 onward target of generating Accelerator sales of €22 billion in 2021. In the future, we want to align our product portfolio even more strongly We want to leverage the diverse growth potential of digitalization Sustainability with climate protection, carbon neutrality and circularity in order to and seize the associated opportunities to the benefit of our custom- meet the growing sustainability demands in our markets with inno- ers. To achieve this, we promote digital skills among our employees, We believe that the economy, environment and society are inex tri- vative solutions. Consequently, we will update our product portfolio cooperate with partners and make digital technologies and ways cably linked and interrelated. We want to create value in all three steering target in 2022. of working an integral part of our business. For example, we had areas with our products, solutions and technologies. We pledged For more information on energy and climate protection, see page 126 onward introduced augmented reality solutions at 340 plants worldwide our commitment to sustainability in 1994 and since then, have For more information on circular economy, see pages 44 and 142 as of the end of 2021. We plan to implement these at more than systematically aligned our activities with the principles of sustain- For more information on Accelerator products und Sustainable Solution Steering, see pages 45 and 141 80 other plants by the end of 2022. ability. We want to further strengthen our position as a thought Production leader in sustainability. We see sustainability as an integral part of Digitalizing our plants and systematically analyzing data enables us our strategy as well as our targets, steering processes and business to further automate processes and in this way, increase the capacity, models. This establishes us as a responsible and attractive partner Our core business is the production and processing of chemicals. availability and efficiency of our plants, for example with predictive supporting our customers, opens up new growth areas and secures Our strength here lies – both now and in the future – in the Verbund maintenance. Linking data from different sources and using artificial the long-term success of our company. Our approach covers the and its integrated value chains. The Verbund offers us many tech- intelligence for smart data analysis opens up numerous opportuni- entire value chain – from responsible procurement and safety and nological, market, production-related and digital advantages. Our ties for us to manage our business more efficiently and improve our resource efficiency in production to sustainable solutions for our comprehensive product portfolio, which ranges from basic chemi- processes, for example in logistics. customers. cals to tailored system solutions, enables us to meet the increasingly diverse needs of our customers with a differentiated offering. This The combination of products, services and digital offerings also Since 1990, we have almost halved our carbon emissions while is complemented by our global presence, coupled with our many opens up new business models and advantages for our customers, simultaneously doubling sales product volumes. By 2030, we want decades of experience, which have allowed us to develop an such as in agriculture or 3D printing. In addition, digitalization enables 1 to reduce our absolute CO emissions by 25% compared with in-depth understanding of the needs and landscape of local us to further strengthen our innovative power. BASF has one of the 2 2018 and will invest up to €4 billion to this end. By 2050, we aim to markets. most powerful supercomputers in the chemical industry – Quriosity. achieve net zero emissions from our production sites and our energy It can be used to significantly accelerate complex computational purchases. We are pursuing ambitious climate protection targets Our integrated Verbund structure enables efficient, reliable and processes such as the simulation of molecules, enabling new with our carbon management. This comprises five strategic levers carbon- optimized steering of our production activities. In 2021, for chemi cal products to be developed more quickly, for example. that we are systematically driving forward to reduce our greenhouse example, we avoided 7.3 million metric tons of CO worldwide At the same time, we are already working on groundbreaking 2 gas emissions (see page 27). To increase the share of renewables through the intelligent networking of our plants and combined heat tech nologies such as quantum computing, including as a founding in our energy supply, for instance, we entered into pioneering and power generation. coopera tion agreements in 2021. For example, we hold a share in 1 In March 2021, we replaced our previous target of CO -neutral growth until 2030 (baseline 2018: 21.9 million metric tons of CO e) with a new, more ambitious climate protection target to reduce absolute CO emissions by 25% compared with 2018 (new target: 16.4 million metric tons of CO e). 2 2 2 2
BASF Report 2021 Management’s Report – Our Strategic Action Areas 30 member of the Quantum Technology and Application Consortium We are expanding our battery materials business with further Employees (QUTAC) industry consortium launched in 2021. investments and strategic partnerships and are developing inno- For more information on digitalization in production, see page 119 vative recycling concepts, in particular to supply the fast-growing Our employees are key to BASF’s success. That is why we believe global e-mobility market with sustainable solutions. We are currently that it is important to have an inspiring working environment that 1 Portfolio building a precursor plant for cathode active materials in Harjavalta, fosters and develops employees’ individual talents and enables 2 Finland, and a production plant for cathode materials in Schwarz- them and their teams to perform at their best. We are pursuing three The acquisitions and divestitures made in the past few years heide, Germany. Both plants are scheduled for startup in 2022. In action areas to make our high-performance organization even more have oriented our portfolio even more strongly toward inno vation- Schwarzheide, we are also building a prototype plant for battery so: empowerment, differentiation and simplification. At the same 2 driven growth areas. In 2021, we successfully integrated the poly- recycling, which is expected to start up in 2023. We also reached time, we encourage and promote a leadership culture that empow- amide business acquired from Solvay, further strengthening our another important milestone in the development of a global value ers our employees to respond to customer needs quickly and effi- position in engineering plastics. We closed the divestiture of our chain for battery materials with the formation of BASF Shanshan ciently with a solution orientation. We value diversity in people, pigments business to the fine chemicals company DIC as planned in Battery Materials Co., Ltd. in China at the end of August 2021. With opinions and experience as being crucial to creativity and innovation. the first half of 2021. The sale of our shareholding in Solenis to production facilities in all key regions and a global capacity of 160 We embrace bold ideas, help our employees to implement them Platinum Equity was also completed as planned in November 2021. metric kilotons of cathode materials from 2022 onward, we are able and learn from setbacks. It is founded on an open feedback and We intend to close the divestiture of our kaolin minerals business to to serve cell manufacturers and OEM customers in all relevant mar- leadership culture based on mutual trust, respect and dedication to KaMin, announced in November 2021, in the second half of 2022, kets with tailored and sustainable solutions. We also entered into a top performance. subject to the approval of the relevant merger control authorities. number of cooperative agreements in 2021, including with battery For more information on employees, see page 97 onward cell manufacturers such as CATL and SVOLT and automotive manu- We steer our six segments along our value chains. Our operating facturers such as Porsche. The aim is to jointly drive forward the divisions drive forward our industry and customer orientation with development of innovative cathode materials and recycling differentiated strategies. technologies. The Asian market will play a key role in our future growth. With a The transition to electromobility is leading to fundamental changes in share of more than 45%, China is already the world’s largest chemi- the automotive industry. As a leading chemical supplier to the auto- cal market and will be an even stronger driver of growth in global motive industry, we will further strengthen our focus on battery chemical production in the future. Our strong innovation, production materials and battery recycling. To this end, in January 2022, we and sales base in Asia, and in particular in China, enables us to started the carve-out process for our mobile emissions catalysts respond to the needs of our customers in a differentiated way. To business, automotive catalysts recycling and the associated pre- further strengthen our position in this dynamic growth market, we cious metal services unit. The new, standalone organizational plan to build a second Verbund site in China, in Zhanjiang in the structure prepares the business for the upcoming changes in the southern Chinese province of Guangdong. Construction on the first internal combustion engine market. plants continued as planned in 2021. They are scheduled for startup For more information on material investments and portfolio measures, see page 38 onward in 2022. We will also expand the Verbund site we operate together with Sinopec in Nanjing, China, by 2023. This investment includes new production plants for selected products in the Petrochemicals and Intermediates divisions. 1 The investment in Finland is co-financed by Business Finland, the Finnish government organization for innovation funding and trade, travel and investment promotion. 2 Our investment and research activities in Schwarzheide and Ludwigshafen, Germany, receive funding from the German Federal Ministry for Economic Affairs and Climate Action and the Ministry for Economic Affairs, Labor and Energy of the German state of Brandenburg under the IPCEI on Batteries (funding code 16BZF101A/B).
BASF Report 2021 Management’s Report – Our Values and Global Standards 31 Our Values and Global Standards How we act is critical to the successful implementation of our strategy and how our stakeholders perceive us. This is what our four corporate values represent: creative, open, responsible, entrepreneurial (CORE). They are binding for all employees worldwide. Together with our Code of Conduct and our global standards and guidelines, they provide the framework for responsible conduct. Our CORE values define how we want to work together – as a team, – The Responsible Care® Global Charter with our customers and our partners. – The German Corporate Governance Code Good to know Creative: We make great products and solutions for our customers. We stipulate binding rules for our employees with standards that This is why we embrace bold ideas and give them space to grow. apply throughout the Group. We set ourselves ambitious goals with We act with optimism and inspire one another. voluntary commitments and regularly monitor our performance in environmental protection, health and safety with our Responsible Open: We value diversity, in people, opinions and experience. This Care Management System. We mainly approach our adherence to is why we foster feedback based on honesty, respect and mutual international labor and social standards using three elements: the trust. We learn from setbacks. Compliance Program including our Code of Conduct and compli- ance hotlines, close dialog with our stakeholders, and the global CORE Leadership Values Responsible: We value the health and safety of people above all management process to respect international labor norms. Our else. We make sustainability part of every decision. We are commit- business partners are expected to comply with prevailing laws and Leaders have a special responsibility for our success, especially in ted to strict compliance and environmental standards. regulations and to align their actions with internationally recognized challenging and changing times. Good leadership provides sup- principles. We have established appropriate monitoring systems to port and is vital to our employees’ motivation and performance. Entrepreneurial: We focus on our customers, as individuals and ensure this. That is why we have derived specific leadership skills from each as a company. We seize opportunities and think ahead. We take For more information on the Responsible Care Management System, see page 117 onward CORE corporate value – our CORE Leadership Values. They serve owner ship and embrace personal accountability. For more information on compliance, see page 171 onward as guiding principles and describe our expectations of leadership For more information on stakeholder engagement, see pages 47 and 106 behavior – such as living optimism, inspiring teams, promoting Our standards fulfill and in some cases, exceed existing laws and For more information on our expectations of our suppliers, see page 109 onward diversity and making even difficult decisions. regulations and take internationally recognized principles into We support our leaders at every stage of their careers in fulfilling account. We respect and promote: their responsibilities and acting as role models. One component of this is the CORE Leadership Upskilling program launched in 2021. – The 10 principles of the U.N. Global Compact It comprises a range of virtual training modules and learning – The Universal Declaration of Human Rights and the two U.N. resources that encourage self-reflection and provide opportunities Human Rights Covenants for global dialog. – The core labor standards of the ILO and the Tripartite Declaration For more information on what we expect from our leaders, see page 98 of Principles Concerning Multinational Enterprises and Social Policy (MNE Declaration) – The OECD Guidelines for Multinational Enterprises
In Focus: Global Trends BASF Report 2021 Management’s Report – In Focus: Global Trends 32 In focus: Global Trends and Growth Opportunities for BASF It is important for us to understand which global trends will shape the future. On this basis, we can identify opportunities, align our strategies and operations, monitor risks and create value added for our stakeholders. The transition to a climate-neutral society is the greatest Growing resource scarcity means that resources and materials challenge of the coming decades. Many of our products and tech- must be used responsibly. We develop and market innovative tech- nologies are key to this transformation. For example, we are nologies and products in a wide variety of areas to keep recyclable developing innovative battery materials, lightweight materials, and materials in circulation for as long as possible. Going forward, we will additives for climate-smart mobility. Catalysts and other emission align our business models, products and processes even more control technologies from BASF reduce emissions in many applica- strongly with the circular economy. For example, we are driving for- tions. Materials from BASF make buildings more energy efficient and ward the chemical recycling of plastics and improving mechanical generating power from wind and solar energy possible. We help recycling with new products and technologies. Other action areas farmers reduce carbon emissions with our integrated offering of include the use of renewable and recycled raw materials and the seeds, crop protection and digital solutions. We are continuously recovery of metals from spent batteries and catalytic converters. expanding our portfolio of climate protection products. At the same time, we are working hard to significantly reduce the carbon foot- Digitalization and connectivity offer many opportunities to opti- print of our production and our products in our carbon management. mize our processes: maintenance work can be planned in advance, innovation processes accelerated or logistics concepts and cus- Population growth and rising prosperity will increase demand tomer relationships improved. In addition, new business models are for food, household and personal care products, drugs, clothing opening up, for example in agriculture or with products for the and much more. At the same time, consumer behavior is changing. electronics and semiconductor industries. Sustainability aspects are playing an increasingly important role in our value chains. Our innovative solutions for agriculture enable In the emerging countries of Asia and South America, we have higher yields from the same land area, contributing to a food supply an innovation, production and sales base that has grown over that meets diverse economic, environmental and social require- several decades. We are strengthening this position with further ments. We offer food and feed manufacturers and customers in the investments. BASF is conducting research globally on innovative battery materials. pharmaceutical, cosmetics, detergents and cleaners industries a Kathrin Michel’s team, for example, is looking at how charging times product portfolio focused on sustainability, which we are continually can be shortened, ranges increased and battery life improved. Find expanding with bio-based and biodegradable solutions. out more about how BASF is contributing to climate-smart mobility in the online report at report.basf.com.
BASF Report 2021 Management’s Report – Business Models of the Segments 33 Business Models of the Segments Markets and consumer behavior are moving faster than ever, presenting our customers from a variety of industries and regions with a wide range of challenges. These include managing limited natural resources amid rising demand and the trend toward sustainable products. Our segments’ business models help to solve these challenges and show how we implement our corporate strategy in practical terms. Chemicals Strategic alignment of the segments Industrial Surface Nutrition & Agricultural The Chemicals segment is at the heart of the Verbund. It reliably Chemicals Materials Solutions Technologies Care Solutions supplies BASF’s other segments with chemicals to produce higher Verbund synergies Catalysis value-added products. It also markets high-quality basic chemicals Process technology and intermediates to customers in downstream industries. In this Automotive industry way, the Chemicals segment makes a significant contribution to BASF’s organic growth. Recycling and renewable raw materials Biosciences We create value through process and product innovation and invest Formulation in research and development to implement new, sustainable tech- Digitalization and artificial intelligence nologies and make our existing technologies even more efficient. Technological leadership, operational excellence and a clear focus Strategic focus Economies of scale in High-performance Additives Surface technology Ingredients for Connected offer on individual value chains are among our most important competi- basic chemicals and plastics platform platform consumer products across technologies intermediates for farmers tive advantages. We concentrate on the critical success factors of Innovation and Improved and Applications, Polymer dispersions, Battery materials, Biotechnology, Active ingredients, the traditional chemicals business: leveraging economies of scale sustainability focus new processes recycled and bio- resins coatings natural active seeds and traits, and the advantages of our Verbund, high asset reliability, continuous based materials ingredients, digital solutions formulations optimization of access to raw materials, lean and energy efficient processes, and reliable, cost-effective logistics. We continuously improve our value chains and are expanding our market position – Materials Additional differentiators are our products that contribute to the especially in Asia – with investments and collaborations in growth circular economy and our more sustainable production processes. markets. The Materials segment develops new plastics applications, BASF is active in substantial parts of plastic value chains, from high-performance materials, systems and digital solutions. Our monomers to polymers and their formulated specialties. Combined Furthermore, we are constantly improving our global production product portfolio is unique in the industry. We aim to grow mainly with our specific technology knowledge, this offers us the unique structures and aligning these with regional market requirements. organically by differentiating ourselves from our competitors with our ability to shape and close cycles ourselves. One concrete example For example, we closed a production plant for butanediol in Kuantan, systems-oriented application expertise and industry knowl- is our pilot projects for recycling used mattresses: Based on a wet Malaysia, in 2021. We also plan to expand our 2-ethylhexanoic acid edge, and creating maximum value in our isocyanate and polyamide chemical process developed by BASF, precursors recovered from plant there, which is scheduled for startup in 2024. value chains. Our advanced material simulation capabilities are a old mattresses can be used to produce new mattress-sized unique selling proposition in the industry and enable us to operate blocks of flexible polyurethane foam. Other examples include our TM close to our customers. ChemCycling project, biomass balanced products and certified
BASF Report 2021 Management’s Report – Business Models of the Segments 34 compostable bioplastics. This also enables us to meet growing products and technologies in close collaboration with our customers biodegradable products. In this connection, BASF has entered customer needs in all key markets. from the catalysts, coatings and battery materials sectors. We also into partnerships to further strengthen its position in the bio-based offer precious and base metal as well as surface treatment services. surfactants and actives market. One example is the technology Tailor-made service and product offerings enable us to continu- Our aim is to drive growth by leveraging our portfolio of technologies cooperation with Holiferm Ltd, Manchester, United Kingdom. The ously expand the range of applications in our portfolio. We operate to find the best solution for our customers in terms of functionality focus here is on the development of fermentatively accessible close to our customers with our global production network. and cost. This in turn helps our customers to drive forward inno- glycolipids for home and personal care and industrial formulator vation in their industries and contribute to sustainable development. applications. Industrial Solutions Key growth drivers for us are the positive medium-term develop- Our enzymes business enables us to pursue a targeted, accelerated The Industrial Solutions segment markets and develops ingredients ment of the automotive market, especially in Asia, the trend toward marketing strategy and expand our portfolio for natural and bio- and additives for industrial applications. These include fuel and sustainable, low-emission mobility, and the associated rise in technological products. Furthermore, we are investing in natural and lubricant solutions, ingredients for paints and coatings, electronic demand for battery materials for electromobility. Together with biological substances. BASF’s biopharma business supports the materials and plastic additives. We concentrate on research and our customers, we are developing customized, more sustainable biopharmaceutical industry by supplying the raw materials used to development and invest in the creation of innovations with the aim solutions in these growth areas for battery materials, emission con- produce biological drugs. of enabling more efficient resource use. This is why we develop trol, recycling and functional coatings. Our specialties and system more sustainable products and processes, for example, in polymer solutions in these areas enable customers to stand out from their In addition, acquisitions complement our focus on emerging dispersions, resins and plastic additives, and enable our customers competition. markets, new business models and sustainability trends in to contribute to sustainability through their applications and consumer markets. Future growth in our markets will be driven by processes. Other focus areas are efficient production setups, back- The above trends mean that the automotive industry is currently trends like growing consumer awareness and the resulting demand ward integration in our Production Verbund’s value chains, capacity undergoing a fundamental transformation. As one of the largest for sustainable product solutions, natural and organic ingredients management, and technology and cost leadership. chemicals suppliers to this industry, we will, as announced in and their traceability. Moreover, the shift toward individualization December 2021, further strengthen our focus on battery materials and local production supports new players and business models. Our global presence enables us to operate close to our customers and recycling and pursue an ambitious growth plan. We will also Digitali zation, a focused technology and product portfolio, and close and their industries. As a reliable partner, we offer high-quality establish a new entity (BASF Automotive Catalysts and Recycling) cooperation with our customers is crucial to meeting these dynamic products at good value. We work on new solutions together with within the Catalysts division for mobile emissions catalysts, auto- market requirements both now and in the future. our customers and strive for long-term partnerships that create motive catalysts recycling and associated precious metal services. profitable growth opportunities for both parties. To achieve this, The carve-out process started in January 2022. The new organiza- Agricultural Solutions we draw on our innovative strength and our many years of experience tional structure will prepare the business for the upcoming changes and in-depth industry expertise. Through our in-depth application in the internal combustion engine market and allow for future Farming is fundamental given that by 2050, the world’s population is 1 knowledge and technological innovations, we strengthen customer strategic options. expected to increase by two billion people. In the Agricultural Solu- relationships in key industries such as the automotive, plastics and tions segment, we believe that the way forward for agriculture is to electronics industries. Nutrition & Care find the right balance and create value for the environment, society and business. While the demand for food, feed, fiber and energy is Surface Technologies In the Nutrition & Care segment, we strive to expand our position as growing, natural resources are limited. Agriculture is a key enabler a leading provider of nutrition and care ingredients for consumer in providing enough healthy, affordable food and responding to In the Surface Technologies segment, our focus is on the protection, applications. We aim to enhance our capabilities in areas such changing consumer behavior while reducing the impact on the modification and development of surfaces. We develop innovative as biotechnology and broaden our portfolio with bio-based and environment. 1 Source: U.N. World Population Prospects 2019
BASF Report 2021 Management’s Report – Business Models of the Segments 35 As one of the world’s leading agricultural solutions companies, we are committed to making a positive impact on sustainable agricul- ture and food systems. Our innovation-driven strategy for agricul- ture focuses on selected crops and their appropriate cultivation systems in specific regions. We integrate sustainability criteria into all business and portfolio decisions. In doing so, we help farmers achieve better yield – yield that is produced in ways that are recog- nized as valuable by society, are kind to the planet and enable farmers to produce economically. We leverage our expertise in research and development and our deep understanding of the way individual growers manage their farms to provide offers across technologies. These include novel solutions for seeds, traits, crop protection and digital products, which we link intelligently. This enables us to offer farmers solutions tailored to their region and crop systems to safeguard yields, miti- gate risks and fulfill societal requirements.
BASF Report 2021 Management’s Report – Targets and Target Achievement 2021 36 Targets and Target Achievement 2021 Business success tomorrow means creating value for the environ- We also pursue broad sustainability targets. In this context, we The objective of these targets is to steer our business into a sustain- 2 ment, society and business. That is why we have set ourselves significantly raised our CO reduction target in 2021. We want to able future, and at the same time, contribute to the implementation 2 ambitious targets along our entire value chain. We report transpar- strengthen the sustainability focus of our product portfolio and will of the United Nations’ Sustainable Development Goals (SDGs). We 3 ently on our target achievement so that our stakeholders can track update our portfolio steering targets in 2022. We also strive to are focusing on issues where we as a company can make a signifi- our progress. In order to grow profitably, we want to grow sales strengthen the sustainability of our supply chains and use resources cant contribution, such as climate protection, sustainable consump- volumes faster than global chemical production, further increase our responsibly. We want to further improve safety in production. In tion and production, and fighting hunger. profitability, achieve a return on capital employed (ROCE) consider- addition, we aim to promote diversity within the company and create For more information on financial indicators, see page 52 onward ably above the cost of capital percentage and increase the dividend a working environment in which our employees feel that they can For more information on sustainability along the value chain, see page 96 onward per share every year based on a strong free cash flow. thrive and perform at their best. Profitable growth 2021 2021 2021 2021 2021 status status status status target 53% 1 13.5% 2021 10.6% €3.40 > 2021 €3.30 target > target 9% SDG >6.1% SDG 2021 SDG SDG target 3% – 5% Most important key performance indicator Achieve a return on capital Grow sales volumes Increase EBITDA Increase the dividend employed (ROCE) considerably above the faster than global chemical before special items per share every year based cost of capital percentage every year production every year by 3%–5% per year on a strong free cash flow Effective climate protection Sustainable product portfolio 2021 2021 2025 status 2030 status target 20.2 target €24.1 €22.0 SDG million 16.4 billion billion metric million tons metric SDG tons Reduction target Most important key performance indicator Most important key performance indicator 1 Dividend proposed by the Board of Executive Directors 2 Includes Scope 1 and Scope 2 emissions. In March 2021, we replaced our previous target of CO -neutral growth until 2030 (baseline 2018: 21.9 million metric tons Reduce our absolute Achieve €22 billion in 2 of CO e) with a new, more ambitious climate protection target to reduce absolute CO emissions by 25% compared with 2018 (new target: 16.4 million metric tons 2 2 3 of CO e). CO emissions² by 25% by 2030 Accelerator sales by 2025 2 ² 3 We already reached our 2025 sales target for Accelerator products in 2021. Consequently, we will update our product portfolio steering target over the course of 2022.
BASF Report 2021 Management’s Report – Targets and Target Achievement 2021 37 Responsible procurement 2021 2025 status target 2021 2025 90% status target 85% 80% 74% SDG SDG Limited assurance Limited assurance Cover 90% of our relevant Have 80% of our suppliers spend with sustainability improve their sustainability evaluations by 2025 performance upon re-evaluation Resource efficiency and safe production 2021 2021 2030 status status target 0.3 0.3 100% 2021 2025 2025 status target SDG target SDG 53.5% SDG < < 0.1 0.1 Limited assurance Limited assurance Reduce worldwide process safety Reduce the worldwide lost-time Introduce sustainable water management incidents per 200,000 working injury rate per 200,000 working at our production sites in water stress areas hours to ≤0.1 by 2025 hours to ≤0.1 by 2025 and at our Verbund sites by 2030 Employee engagement and diversity 2030 2021 2021 target status target 2021 1 30% 82% > status 80% 25.6% SDG SDG Limited assurance Limited assurance Reduction target Increase the proportion of women in More than 80% of our employees leadership positions with disciplinary feel that at BASF, they can thrive responsibility to 30% by 2030 and perform at their best 1 We regularly calculate the employee engagement level. The most recent survey was conducted in 2020. The next survey is planned for spring 2022.
BASF Report 2021 Management’s Report – Material Investments and Portfolio Measures 38 Material Investments and Portfolio Measures In addition to innovations, investments make a decisive contribution toward achieving our ambitious growth and climate protection goals. We use targeted acquisitions to supplement our organic growth. Our focus is on innovation-driven growth areas and sustainable technologies. With a world market share of over 45%, China is already the largest Additions to property, plant and equipmenta by segment in 2021 At a glance chemical market and will drive growth in global chemical production to an even greater extent in the future. We expect China’s share to 28% 16% €3.4 billion €25.6 billion increase to over 50% by 2030. To further strengthen our position in Chemicals Nutrition & Care Capex1 in 2021 Capex planned for 2022 to Asia, we plan to build a new integrated Verbund site in Zhanjiang 2026 €4,078 million 8% in the southern Chinese province of Guangdong. The first plants 17% Agricultural Solutions started construction in 2020, and we made further progress on Materials these in 2021. They are scheduled for startup in 2022. We will 4% 9% Others (infrastructure, R&D) By investing in our plants, we create the conditions for the profitable also expand the Verbund site we operate together with Sinopec in Industrial Solutions growth we strive for and continuously improve the efficiency of exist- Nanjing, China, by 2023. 18% ing production processes. Investments in new technologies and in Surface Technologies the transformation of our energy supply will help to achieve our In addition, we are refining our portfolio through acquisitions that growth targets and our ambitious climate targets. For the period promise above-average profitable growth as part of the BASF Ver- 1 from 2022 to 2026, we are planning capital expenditures (capex) bund to help reach a relevant market position. A key consideration totaling €25.6 billion, including €12.9 billion for our major growth is that these are innovation-driven or offer a technological differen- projects.2 tiation, and make new, sustainable business models possible. Additions to property, plant and equipmenta by region in 2021 For more information on our investments from 2022 onward, see page 150 Investments and acquisitions alike are prepared by interdisciplinary 2% teams and assessed using various criteria. In this way, we ensure South America, Africa, Middle East Investments and acquisitions 2021 that economic, environmental and social concerns are included in Million € strategic decision-making. 24% Invest- Acquisi- Asia Pacific €4,078 million 53% ments tions Total Europe Intangible assets 78 392 470 21% Investments in the segments and regions of which goodwill – 254 254 North America Property, plant and equipmenta 4,078 332 4,410 Investments in property, plant and equipment amounted to a Including restoration obligations, IT investments and right-of-use assets arising from leases Total 4,156 725 4,881 €4,078 million in 2021 (2020: €3,516 million). Capex accounted for a Including restoration obligations, IT investments and right-of-use assets arising from leases €3,363 million of this amount (2020: €2,878 million). Our invest- ments in 2021 focused on the Chemicals, Materials, Surface Technologies and Nutrition & Care segments. 1 Additions to property, plant and equipment excluding acquisitions, restoration obligations, IT investments and right-of-use assets arising from leases 2 Major growth projects are the construction of our future Verbund site in Zhanjiang, China, as well as our battery materials activities.
BASF Report 2021 Management’s Report – Material Investments and Portfolio Measures 39 Chemicals Overview of material investments Segment Location Project Start-up Strategically, our investments concentrate on the growth markets Chemicals Antwerp, Belgium Capacity expansion: ethylene oxide plant 2022 to support the growth of our customers in China. In 2021, for exam- a Kuantan, Malaysia Capacity expansion: 2-ethylhexanoic acid plant 2024 ple, we increased the production capacity for tertiary butylamine. Nanjing, China Capacity expansion: tertiary butylamine plant 2021 Together with our partner Sinopec, we are pushing ahead with plans Capacity expansion: propionic aldehyde, propionic acid, purified ethylene oxide, 2023 to further expand the site in Nanjing, China, to strengthen the joint ethyleneamines and ethanolamines plantsb production of chemical products in China. For instance, we plan to Construction: tert-butyl acrylate plantb 2023 further expand our production capacities for propionic aldehyde, Zhanjiang, China Construction: neopentyl glycol plant 2025 propionic acid, purified ethylene oxide, ethanolamines and ethylen- eamines, and build a new tert-butyl acrylate plant. The expanded Materials Chalampé, France Construction: world-scale production plant for HMD 2024 and new plants are scheduled to come onstream in 2023. Geismar, Louisiana Capacity expansion: MDI plants 2026 Zhanjiang, China Construction: engineering plastics plant 2022 At our Verbund site in Antwerp, Belgium, we are significantly Industrial Solutions Jiaxing, China Capacity expansion: production plant for sulfuric acid 2023 expanding our ethylene oxide plant. The project also includes Jinshan, China Capacity expansion: synthetic esters 2022 several downstream plants, for example, to produce surfactants. Jurong, Singapore Capacity expansion: antioxidants (Irganox®) 2022 The expansion is scheduled to come onstream in 2022. Pasir Gudang, Malaysia Capacity expansion: production plant for acrylics dispersions 2021 Pontecchio Marconi, Italy Capacity expansion: antioxidants (Irganox®) 2021 ® ® Materials Capacity expansion: light stabilizers (Tinuvin NOR 356) 2021 Surface Technologies Chennai, India Capacity expansion: plant for mobile emissions catalysts 2022 In the Materials segment, production capacities at the methylene Harjavalta, Finland Construction: precursor plant for cathode active materials 2022 diphenyl isocyanate (MDI) plants in Geismar, Louisiana, were suc- Pinghu, China New surface treatment site 2021 cessfully increased by one third following the construction of a new Schwarzheide, Germany Construction: cathode active materials plant 2022 MDI synthesis unit, which was completed with the start of opera- Construction: battery recycling prototype plant 2023 tions in 2020. In the final phase, we plan to increase capacities to Nutrition & Care Antwerp, Belgium Capacity expansion: alkoxylates 2018–2022 around 600,000 metric tons per year by 2026. With this gradual Düsseldorf, Germany Gradual upgrade of production plants in accordance with the Good Manufacturing capacity expansion, we are supporting the continuing growth of our Practice Standard issued by the European Federation for Cosmetic Ingredients (EFfCI) 2023 North American MDI customers. Jinshan, Chinac New production line: UV filters 2023 Ludwigshafen, Germany Capacity expansion: production plant for methane sulfonic acid 2022 The construction of the first plants at our smart Verbund site in Capacity expansion: production plant for vitamin A 2021 Zhanjiang, China, is in progress. The new plants are scheduled to Agricultural Solutions Beaumont, Texas Modernization of site infrastructure 2022 come onstream in 2022. They will produce engineering plastics and Hannibal, Missouri Modernization of site infrastructure 2022 thermoplastic polyurethane (TPU) to serve the increasing needs of Nunhem, Netherlands Expansion of breeding facilities for vegetable seeds 2021 various growth industries in the southern China market and in other Asian markets. Singapore New formulation hub for crop protection products 2022 Sparks, Georgia New facility for seed treatment formulations 2021 BASF is investing in a new world-scale production plant for a Operated by a fully consolidated joint venture with Petronas Chemicals Group Berhad b Operated by a joint venture with Sinopec hexamethylened iamine (HMD) at the Chalampé site in France. The c This project was relocated from Kaohsiung, Taiwan, to Jinshan, China.
BASF Report 2021 Management’s Report – Material Investments and Portfolio Measures 40 new plant will increase BASF’s annual HMD production capacity to production capacities in what are currently the main markets: China, investments were made in the modernization of site infrastructure in 260,000 metric tons. Production is expected to start in 2024. Japan, North America and Europe. North America. To meet continuing high demand for our innovative solutions in the future, between 2022 and 2026, we will invest more In addition, BASF announced in 2021 that it will build a battery than €950 million in developing and expanding our infrastructure, Industrial Solutions recycling prototype plant in Schwarzheide, Germany. Startup is including state-of-the-art R&D facilities, and in our production and planned for 2023. The prototype plant will allow for the development formulation capacities for active ingredients as well as for seed In the Industrial Solutions segment, we are increasing global pro- of operating procedures and optimization of technology to deliver solutions. duction capacity for the antioxidant Irganox® 1010 through a project superior returns of lithium, nickel, cobalt and manganese from end- For more information on our segments, see page 72 onward to expand production at the site in Jurong, Singapore. With the of-life lithium-ion batteries. completion of the project in 2022, BASF aims to better serve the Good to know growing demand from customers in Asia, Europe, the Middle East and Africa. In addition, we increased production capacity for the Nutrition & Care ® antioxidant Irganox 1520L by 20% at the site in Pontecchio Marconi, Italy, in the first quarter of 2021. In Ludwigshafen, Germany, we started up the expanded vitamin A production facilities for the Nutrition & Care segment in July 2021. To meet the increasing demand for high-quality dispersions solu- We also invested in the expansion of alkoxylate capacities at the tions in the growing ASEAN, Australian and New Zealand markets, Verbund site in Antwerp, Belgium. we have doubled the production capacity for acrylics dispersions in Pasir Gudang, Malaysia. The additional capacities started up in the By mid-2022, BASF will increase its capacities for methane sulfonic first quarter of 2021. We are currently building our third electronic- acid by around 65% in response to growing cross-industry demand, grade sulfuric acid plant in Jiaxing, China. This investment will more strengthening its position as a leading global producer. To this end, than double BASF’s existing sulfuric acid production capacity in the we are investing in the construction of a new methane sulfonic acid country to serve the rapidly growing semiconductor industry. The plant at the Ludwigshafen site in Germany. Methane sulfonic acid New Verbund site in Zhanjiang site expansion is scheduled for completion in 2023. is an organic acid used in numerous applications ranging from chemical and biofuel synthesis to industrial cleaning and metal Based on its goal of net zero emissions by 2050, BASF has surface treatment in the electronics industry. made further progress toward reducing its carbon footprint. In Surface Technologies June 2021, we signed a purchase agreement for renewable electricity with China Resources Power, Hong Kong, China, We aim to expand our position as a leading and innovative provider Agricultural Solutions under the new Guangdong renewable energy trading rules in of battery materials and benefit from the strong growth in this market China. This will enable us to run the first plants at BASF’s new segment. A global, customer-focused production network for bat- The investment in a formulation hub for crop protection products in Verbund site in Zhanjiang entirely on renewable energy. The new tery materials is crucial here. Construction of our new production Singapore will, from 2022 onward, ensure that multiple formulation plants are scheduled for startup in late 2022. This is a significant plant for cathode materials in Schwarzheide, Germany, continued technologies are produced in close proximity to farmers in Asia step toward transforming of our energy supply in China. as planned in 2021. The new plant will use precursors from the Pacific. We also invested in the expansion of our production site Discover the smart Verbund site in Zhanjiang, China, at basf.com/zhanjiang production facility under construction in Harjavalta, Finland. The two in Sparks, Georgia, establishing a new formulation plant for seed plants are scheduled for startup in 2022 and will produce cathode treatment products, which came into operation in 2021. At the active materials for around 20 gigawatt hours of cell capacity per Nunhem site in the Netherlands, we continued the expansion of year. With these investments in Finland and Germany, BASF aims our breeding facilities for vegetable seeds with a state-of-the-art to become the first cathode active materials supplier with local tomato greenhouse, which has been available since 2021. Further
BASF Report 2021 Management’s Report – Material Investments and Portfolio Measures 41 Acquisitions On June 30, 2021, we closed the divestiture of our global pigments BASF’s Performance Chemicals division and has approximately business to the Japanese fine chemical company DIC, Tokyo, 440 employees in North America, Europe and Asia. The divestiture On August 31, 2021, BASF and Shanshan announced the formation Japan. The business transfer agreement, which affected around comprises the production hub with sites in Daveyville, Toddville, of BASF Shanshan Battery Materials Co., Ltd. The newly formed 2,500 employees, was signed on August 29, 2019. The purchase Edgar, Gordon and related mines, reserves and mills in Toomsboro entity is majority-owned by BASF (BASF 51%; Shanshan 49%). price on a cash and debt-free basis was €1.15 billion. The Disper- and Sandersville in Georgia. The refinery catalysts operations located It has four sites in Hunan and Ningxia, China, with more than sions & Pigments division was renamed Dispersions & Resins at the same site are not part of the divestiture. Pending approval by 1,600 employees. BASF Shanshan Battery Materials Co., Ltd. will following the transaction closing. the relevant authorities, closing of the transaction is expected in the focus primarily on the rapidly growing electric vehicle (EV) market For more information on this divestiture, see Note 3 to the Consolidated Financial Statements from second half of 2022. while serving global consumer electronic and energy storage market page 209 onward segments. The business is a part of the Catalysts division. On December 6, 2021, BASF and Allianz Capital Partners, on behalf For more information on this acquisition, see Note 3 to the Consolidated Financial Statements from On November 9, 2021, BASF and Clayton, Dubilier & Rice sold their of Allianz Insurance Companies (Allianz), announced that they had page 207 onward shares in Solenis to Platinum Equity, a private equity company reached an agreement on the purchase of 25.2% of the Hollandse based in Beverly Hills, California. With over 5,200 employees, Kust Zuid (HKZ) wind farm by Allianz. This follows a transaction Following approval of the relevant authorities, we completed the Solenis serves customers in water-intensive industries by helping between Vattenfall and BASF under which BASF acquired 49.5% of purchase of 49.5% of Vattenfall’s Hollandse Kust Zuid wind farm on them solve complex water treatment and process improvement HKZ from Vattenfall on September 1, 2021. BASF will continue to 1 September 1, 2021. The purchase price was €0.3 billion. Wind challenges. BASF held a 49% share in Solenis after transferring its receive most of the power produced by its originally acquired share farm construction began in July 2021. Once fully operational in paper and water chemicals business to the company in February of 49.5% of HKZ under a long-term fixed-price corporate power 2023, the wind farm will be the largest commercial offshore wind 2019. This was reported as a non-integral investment accounted purchasing agreement. The transaction is expected to close in the farm in the world. This wind farm does not receive any subsidies for for using the equity method. The remaining 51% of the shares first quarter of 2022, subject to the approval of the relevant merger the power produced. On December 6, 2021, BASF and Allianz were held by funds managed by Clayton, Dubilier & Rice, and by control authorities. Capital Partners announced that they had reached an agreement Solenis management. The purchase price attributable to BASF was on the purchase of a 25.2% interest by Allianz Capital Partners €1.1 billion. On December 28, 2021, BASF reached an agreement to divest its (see “Agreed transactions”). production site in Quincy, Florida, and the associated attapulgite On November 30, 2021, we completed the sale of the precision business to Clariant for a purchase price of $60 million. The Quincy microchemicals business to Entegris. The transaction included fixed facility employs around 75 employees and manufactures clay- based Divestitures assets and inventories. The purchase price amounted to $90 million. mineral products used in a variety of industrial applications. The The precision microchemicals business was part of the Surface transaction affects the Dispersions & Resins division and is expected On May 31, 2021, BASF completed the sale of its production site in Treatment business unit of BASF’s Coatings division, operating to close in the summer of 2022, subject to the approval of the Kankakee, Illinois, to a subsidiary of One Rock Capital Partners, LLC. under the Chemetall brand. relevant antitrust authorities. The agreement also includes the vegetable-oil-based sterols and natural vitamin E business as well as the anionic surfactants and esters produced at the Kankakee site. The purchase price was Agreed transactions €177 million. The transaction affected the Nutrition & Health and Care Chemicals divisions. On November 18, 2021, BASF and KaMin LLC. / CADAM S.A. (KaMin) signed an agreement to sell BASF’s kaolin minerals business to KaMin, a global performance minerals company headquartered in Macon, Georgia. Currently, the kaolin minerals business is part of 1 The transaction is not reported as an acquisition in the Notes to the Consolidated Financial Statements as according to IFRS 3.2b, it does not fall within the scope of IFRS 3.
BASF Report 2021 Management’s Report – Our Steering Concept 42 Our Steering Concept Creating long-term value as a company means more than generating earnings that cover the cost of capital employed. Our steering concept encourages and supports all employees in thinking and acting entrepreneurially. Our key financial management indicator is the return on capital employed (ROCE). The BASF Group’s most important nonfinancial key performance indicators are CO emissions and Accelerator sales. 2 Our financial targets follow a steering concept that is aligned with Calculating ROCE and cost of capital based on the financing costs of the BASF Group. The cost of capital our values. The return on capital employed (ROCE) is used as the percentage for 2022 is 9% (2021: 9%). key target and management indicator for the BASF Group. As ROCE is calculated as the EBIT of the segments as a percentage of stated in our strategic goals, we aim to achieve a ROCE consider- the average cost of capital basis. ably above the cost of capital percentage every year. With ROCE, Calculation of CO emissions 2 the same logic and data is used for our value-based management, To calculate the EBIT of the segments, we take the BASF Group’s external communication with the capital markets and variable EBIT and deduct the EBIT of activities recognized under Other, We calculate our absolute CO emissions on the basis of green- 2 compensation. This means we use the same yardstick for internal which are not allocated to the divisions. house gas emissions, which are the sum of direct emissions from manage ment, employee incentivization and our shareholders’ production processes and the generation of steam and electricity expectations. The cost of capital basis is calculated using the month-end figures (Scope 1), as well as indirect emissions from the purchase of energy and consists of the operating assets of the segments. These com- (Scope 2). Direct emissions from the generation of energy for third As part of our corporate strategy and the sustainability targets prise the current and noncurrent asset items of the segments, parties are not considered here. Relevant emissions include other derived from this, we have also used CO emissions and Accelerator including tangible and intangible fixed assets, integral investments greenhouse gases according to the Greenhouse Gas Protocol, 2 sales as the most important nonfinancial key performance indicators accounted for using the equity method, inventories, trade accounts which are converted into CO equivalents. 2 since the 2020 business year. Two targets are based on these receivable, other receivables and other assets generated by core indicators: sustainability-oriented portfolio management with our business activities and, where appropriate, the assets of disposal We set ourselves even more ambitious targets with our roadmap Sustain able Solution Steering method and reducing absolute CO groups. The cost of capital basis also includes customer and sup- to climate neutrality, which we presented in March 2021: Compared 2 emissions. We reached our Accelerator sales target in 2021, earlier plier financing. with the 2018 baseline, we want to reduce greenhouse gas than planned. Consequently, we will adjust our portfolio steering emissions by 25% by 2030.1 We aim to achieve net zero emissions target over the course of 2022. We have integrated the cost of capital percentage into our (Scope 1 and Scope 2) by 2050. ROCE target as a comparative figure. This is determined using the For more information on CO2 emissions and our climate protection targets, see page 126 onward weighted cost of capital from equity and borrowing costs (weighted average cost of capital, WACC). To calculate a pre-tax figure similar to EBIT, the cost of capital is adjusted using the projected tax rate for the BASF Group for the business year. In addition, the projected net expense of Other is already provided for by an adjustment to the cost of capital percentage. The cost of equity is ascertained using the capital asset pricing model. Borrowing costs are determined 1 In March 2021, we replaced our previous target of CO -neutral growth until 2030 (baseline 2018: 21.9 million metric tons of CO e) with a new, more ambitious climate protection target to reduce absolute CO emissions by 25% compared with 2018 (new target: 16.4 million metric tons of CO e). 2 2 2 2
BASF Report 2021 Management’s Report – Our Steering Concept 43 1 Calculation of Accelerator sales – Capital expenditures (capex) are used to manage capital employed in the BASF Group. These comprise additions to Accelerator sales refer to sales generated by the BASF Group from property, plant and equipment excluding additions from acquisi- products in our strategic portfolio to third parties in the business tions, IT investments, restoration obligations and right-of-use year concerned. Accelerator products make a substantial sustain- assets arising from leases. Capex is not just relevant to ROCE ability contribution in the value chain. In line with our corporate management, but also supports our long-term goal of increasing strategy, we set ourselves the global target of achieving €22 billion our dividend each year based on a strong free cash flow. in Accelerator sales by 2025. This target was already achieved in 2021. Consequently, we will adjust our portfolio steering target over Furthermore, we comment on and forecast sales at Group and the course of 2022. segment level in our financial reporting as a significant driver for EBIT For more information on sustainability-oriented portfolio management, see page 141 onward before special items and thus ROCE. For more information on the development of these indicators, see Results of Operations from page 56 onward Value-based management throughout the company An important part of our value management is the target agreement process, which aligns individual employee targets with BASF’s targets. The most important financial performance indicator in the operating units is ROCE. The other units’ contribution to value is also assessed according to effectiveness and efficiency on the basis of quality and cost targets. To assess this, we use metrics such as BASF’s internal service score in the service units. In addition to ROCE as the BASF Group’s most important financial key performance indicator, we use EBIT before special items and capex (capital expenditure) as key performance indicators that have a direct impact on ROCE and as such, support its management. – EBIT before special items is used to steer profitability at Group and segment level. This is calculated by adjusting the EBIT reported in the Consolidated Financial Statements for special items, making it especially suitable for assessing economic develop ment over time. Special items arise from the integration of acquired businesses, from restructuring measures, certain impairments, gains or losses resulting from divestitures and sales of shareholdings, and other expenses and income that arise out- side of ordinary business activities. 1 The definition of the relevant portfolio and further information can be found in the Sustainable Solution Steering manual at basf.com/en/sustainable-solution-steering
In Focus: Circular Economy BASF Report 2021 Management’s Report – In Focus: Circular Economy 44 In focus: Thinking and Acting Circular As the world’s population grows, so does demand for limited natural resources. At the same time, many recyclable materials end up in landfill or in waste incineration. New concepts are needed to decouple growth from resource consumption. Reduce, reuse and recycle are the keywords of this transition to a system of more sustainable product cycles with less resource consumption and lower carbon emissions. The concept of conserving resources, recycling and feeding waste the recovery of valuable metals from spent batteries and catalytic back into the system is not new for BASF. As early as 1865, it under- converters. pinned the foundation of our company: At that time, Friedrich Engelhorn pursued the idea of producing synthetic dyes from coal In addition, we are developing innovative products and tech- tar – a waste product – and organizing production efficiently in an nologies in many areas that will increase the service life of materials integrated Verbund structure. We are still committed to this tradi- or their recyclability and compostability. One example is additives for tion today and are aligning our actions more strongly than ever with the mechanical recycling of plastics. A Group-wide co-funding pro- circularity. The chemical industry is doubly important for the transi- gram supports our employees in developing new business models tion to a circular economy. Firstly because many value chains start for the circular economy – from the initial idea to market launch. Our here. And secondly because many products and technologies target: By 2030, we want to double our sales of solutions for the based on chemistry help to close loops. That is why both aspects circular economy to €17 billion. These are products that are based – switching to renewable raw materials and innovations for more on alternative raw materials, that close material loops or increase the circularity – are core elements of our Circular Economy Program. resource efficiency and durability of products. For more information on recycled raw materials, see page 115 onward For example, we already use bio-based and renewable raw mate- For more information on sustainable solutions and the circular economy, see page 141 onward rials in our production (see page 113). To further reduce the resource and carbon footprints of our products and solutions, we will align Our circular economy targets our raw material base even more strongly toward recycled and renewable raw materials. For instance, we aim to process 250,000 metric €17 billion 250,000 metric tons of recycled and waste-based raw mate- tons Sales of solutions for the rials in our production plants annually from 2025. Together with Recycled and waste-based raw circular economy by 2030 partners, we are analyzing waste streams and raw material sources materials processed every year to find the best solution and develop suitable, innovative processes from 2025 Together with partners, BASF is developing innovative products (see page 115). This is the case, for example, in the chemical recy- and technologies to improve recyclability and enable resources to cling of used tires and different types of plastics, where we can feed be fed back into the system in the future. One example is chemical recovered raw materials such as pyrolysis oil or monomers back recycling. Find out more about how used tires and mixed plastic waste are converted into new raw materials in the online report into our Verbund structure at different points. Another example is at report.basf.com.
BASF Report 2021 Management’s Report – Our Sustainability Concept 45 Our Sustainability Concept GRI 102, 103, 203, 304, 412, 413, 415, 416 We implement our corporate purpose – We create chemistry for a sustainable future – by systematically incorporating sustainability into our strategy, our business, and into our assessment, steering and compensation systems. We secure our long-term success with products, solutions and technologies that create value added for the environment, society and the economy. Our strategic approach using renewable raw materials, and ongoing measures to further especially SDG 2 (Zero hunger), SDG 5 (Gender equality), SDG 6 increase energy and resource efficiency in our production (see (Clean water and sanitation), SDG 7 (Affordable and clean energy), At a glance page 126). We use the Sustainable Solution Steering method to SDG 8 (Decent work and economic growth), SDG 12 (Responsible improve the sustainability contributions of our product portfolio consumption and production) and SDG 13 (Climate action). To ▪ Sustainability aspects integrated into corporate steering along the value chain (see page 141). To assess the sustainability prioritize these, internal experts assessed the impacts and positive ▪ Targets for climate protection, product portfolio, circular performance of our products and identify solutions with a substantial contributions of our products, our corporate targets and strategic economy, procurement, safety and employees sustainability contribution in the value chain, we regularly reassess action areas. The Value to Society method is used to measure the ▪ Strategic guidelines on stakeholder management and our our product portfolio. We already reached our 2025 sales target for contribution of our activities along the value chain. This assesses our societal engagement Accelerator products in 2021. Consequently, we will update our positive and negative impacts on the environment, society and the product portfolio steering target over the course of 2022. economy (see page 47). Sustainability is at the core of what we do and a driver for growth and value. Analyzing our contributions to sustainability also enables In addition to the climate protection and Accelerator sales targets, We identify key sustainability topics with our comprehensive mate- us to manage risks effectively. We pursue a holistic sustainability we have set ourselves further sustainability goals. A particular focus riality analysis. The graphic on page 46 shows how we assess approach that covers the entire value chain – from our suppliers and is the circular economy due to its strong connection to climate pro- relevant topics. Here, we take into account topics that we have an our own activities to our customers. We have formulated commit- tection. We have defined further targets on water management, impact on, topics that have an impact on us, and topics that our ments for our conduct along the value chain and underpinned these responsible procurement, engaged employees, women in leadership stakeholders consider important to us. The topics identified based with corresponding targets and measures (see page 36). positions, occupational health and safety, and process safety. on these three dimensions of materiality are: climate and energy, health and safety / product stewardship, water, emissions to air Based on our corporate strategy and the global targets derived from We have also set up a project organization to achieve our climate and soil, resource efficiency and waste, biodiversity, human rights, this, we steer the sustainability targets (reduce absolute CO protection targets. The new Net Zero Accelerator unit concentrates employment and diversity. 2 emissions1 by 25% by 2030 compared with baseline 2018 and on implementing and accelerating projects on low-carbon produc- For more information on our materiality analysis, see basf.com/materiality 2 For more information on the metastudy on sustainability trends, see basf.com/sustainability-trends achieve €22 billion in Accelerator sales by 2025) as most important tion technologies, the circular economy and renewable energies. key performance indicators. To this end, we have established the necessary steering mechanisms and control systems at Group level. As a co-founder of the U.N. Global Compact and a recognized Our global activities to reduce greenhouse gas emissions include LEAD company, we contribute to the implementation of the United using renewable energies for both electricity and steam production, Nations’ Agenda 2030. Our products, solutions and technologies developing and applying new low-carbon production processes, help to achieve the U.N. Sustainable Development Goals (SDGs), 1 The target includes Scope 1 and Scope 2 emissions. Other greenhouse gases are converted into CO equivalents in accordance with the Greenhouse Gas Protocol. In March 2021, we replaced our previous target of CO -neutral growth until 2030 (baseline 2018: 21.9 million metric tons of CO e) with a new, more ambitious climate protection 2 2 2 target to reduce absolute CO emissions by 25% compared with 2018 (new target: 16.4 million metric tons of CO e). 2 2 2 Accelerator products make a substantial sustainability contribution in the value chain.
BASF Report 2021 Management’s Report – Our Sustainability Concept 46 1, 2 Our organizational and management structures Identifying and assessing sustainability topics We are constantly working to broaden our contributions to key Materiality BASF evaluation approach dimension sustainability topics and reduce the negative impact of our busi- ness activities. Together with decentrally organized specialists, the Corporate Strategy & Sustainability unit in the Corporate Center Impact of BASF is responsible for integrating sustainability into core business Value to Society method: activities and decision-making processes. This unit’s tasks include – Monetization of positive and the global steering of climate-related matters. negative effects along the value chain Complete list of potentially relevant – Topics with impacts that cannot be topics (around 100) based on expressed in monetary terms included The new Net Zero Accelerator project organization has reported based on relevance for external directly to the Chairman of the Board of Executive Directors since – Prior materiality analyses stakeholders and on assessments of – Value to Society results internal experts January 2022. It focuses on the further acceleration and implemen- – External inquiries tation of existing and new projects to achieve CO reduction targets Material topics 2 Impact on BASF (within the meaning of section at company level worldwide and drives them forward. Prioritization and grouping in – Business units surveyed as part of 289c HGB or relevant under internal workshops strategy development the Global Reporting Initiative) – Positive and negative effects of individual The Board of Executive Directors and the Supervisory Board are sustainability trends on the businesses regularly briefed on the current status of individual sustainability analyzed based on meta-study topics. The Board of Executive Directors incorporates the results and recommendations from sustainability evaluations of business Relevance for – Big data analysis based on processes into its decisions, for example, on proposed investments our stakeholders external publications and acquisitions. It makes decisions with strategic relevance for the – Results complemented and confirmed by surveys and interviews with Group and monitors the implementation of strategic plans and tar- external experts get achievement. The Corporate Sustainability Board, which is composed of heads of business and Corporate Center units and 1 Our stakeholders also confirmed the materiality of the nonfinancial topics that the Value to Society method identified as having an impact along the value chain. regions, supports the Board of Executive Directors on sustainability 2 Quantitative thresholds for defining material topics have not been set due to the complexity of the assessment methods used for each dimension of materiality. The final list of topics is based on an expert comparison of the results of all the assessment approaches described. topics and discusses operational matters. A member of the Board of Executive Directors serves as chair. In 2018, we established our Sustainable Finance Roundtable, which developing recommendations on how the SDGs should be consid- discusses topics related to sustainable finance. Here, experts from ered in financial decisions and in interactions with investors. We systematically evaluate sustainability criteria, including the departments such as Finance, Corporate Strategy, Investor Rela- For more information on our financial and sustainability targets, see pages 36 and 37 effects of climate change, as an integral part of decisions on acqui- tions and Communications discuss upcoming new legal require- For more information on our risk management, see pages 151 to 160 sitions and investments in property, plant and equipment or financial ments. The interdisciplinary group analyzes the steadily growing For more information on the organization of our sustainability management, see assets. In this way, we not only assess economic dimensions, but requirements, assesses the impact on BASF and drives forward the basf.com/sustainabilitymanagement also the potential impacts on areas such as the environment, human necessary change processes as well as the concrete implementa- For more information on compensation structures, see the compensation report at basf.com/compensationreport rights or the local community. We evaluate both the potential tion of measures. In a U.N. Global Compact task force, we are impacts of our activities here as well as which effects we are exposed to.
BASF Report 2021 Management’s Report – Our Sustainability Concept 47 Measuring sustainable value added Overall, the Value to Society method helps us to continually monitor be piloted by all member companies and the results will be fed back our progress. It complements existing concepts for assessing risks to the VBA for further development. We are aware that our business activities can have both positive and and business opportunities by providing a macro perspective and For more information on this method and the results of Value to Society, negative impacts on the environment and society. We aim to enables us to derive the necessary business steps. see basf.com/en/value-to-society increase our positive contributions and minimize the negative For more information on our sustainability tools, see basf.com/en/measurement-methods impacts of our business activities. To achieve this, we need to under- We are a founding member of the value balancing alliance e.V. (VBA) For more information on value balancing alliance e.V., see value-balancing.com stand how our actions and our products impact society and the and have contributed our knowledge and experience to this cross- environment. industry initiative. We support the development of an accounting and reporting standard that makes the value companies provide to Our stakeholder management We already have many years of experience in this area from evaluat- society transparent and comparable. The aim is to present the finan- ing our products and processes using methods such as Eco- cial, ecological, and social impacts of business activities on the basis Our stakeholders include customers, employees, investors, sup- ® Efficiency Analyses, the SEEbalance Socio-Eco-Efficiency Analysis, of a standardized framework. The VBA is supported by major audit- pliers, the communities surrounding our sites, and representatives our Sustainable Solution Steering portfolio analysis, BASF’s corpo- ing firms, the Organisation for Economic Co-operation and Develop- from industry, academia, politics and society. Parts of our business rate carbon footprint or the calculation of Product Carbon Footprints. ment (OECD), leading universities and other partners. Together with activities, such as the use of certain new technologies or our envi- the OECD and the Business for Inclusive Growth (B4IG) coalition, we ronmental impacts, are often viewed by stakeholders with a critical We want to holistically capture the value we contribute to society are pushing to further expand the social indicators. Here, BASF eye. We take these questions seriously, initiate dialogs and partici- along the value chain and make this transparent. However, there are leads the Impact Measurement working group together with pate in discussions. Such ongoing exchange with our stake- still no uniform, global standards for measuring and reporting on partners. Through the VBA, we are involved in the E.U.’s Platform on holders helps us to even better understand what matters to groups companies’ overall impact that cover economic, environmental and Sustainable Finance. Together with the VBA and other partners, we of society, what they expect of us and which measures we need to social aspects of business activities along the value chain. This is supported the establishment of the International Sustainability pursue in order to establish and maintain trust, build partnerships, why we developed the Value to Society method in 2013 together Standard Board (ISSB), are involved in the work of the World Eco- and increase societal acceptance for and the sustainability of our with external experts. We can use this methodological approach to nomic Forum (WEF) and are part of the G7 Impact Taskforce. Our business activities. In doing so, we want to harness potential for compare the significance of financial and sustainability-related Corporate Finance unit is also involved in the work of the European mutual value creation and strengthen societal acceptance of our impacts of our business activities on society and show their interde- Financial Reporting Advisory Group’s (EFRAG) Project Task Force on business activities. For important topics, we systematically identify pendencies. The results illustrate the positive contributions and European sustainability reporting standards. key stakeholders at an early stage to discuss critical questions negative effects, both at BASF and in our value chains. Positive fac- with them. Relevant considerations here include their topic-specific tors include taxes paid, wages, social benefits, employee training The method developed by the VBA was enhanced and refined on expertise and willingness to engage in constructive dialog. 1 and our net income. Negative contributions include environmental the basis of feedback from the scientific community and member impacts such as carbon emissions, land use and emissions to air, companies. Amendments include the addition of two social indica- We established an external, independent Stakeholder Advisory soil and water, as well as health and safety incidents. The positive tors and the calculation of downstream impacts, as well as revisions Council (SAC) in 2013 and the Human Rights Advisory Council 2 impacts of our economic activities declined in 2020, primarily due to to financial indicators, for example. This enhanced method will again (HRAC) in 2020. In the SAC, which is led by the Chairman of the the economic conditions caused by the coronavirus pandemic, Board of Executive Directors, international experts from academia which led to lower economic value added. In addition, higher water and society contribute their perspectives to discussions with BASF’s consumption and increased land use in supplier and customer Board of Executive Directors. The HRAC is an advisory body com- industries had a greater impact on the environment. prising external human rights specialists and internal experts. This helps us to critically reflect on our positions and address potential for improvement. 1 The net income of BASF’s production presented in the Value to Society is calculated using the BASF Group’s net income, adjusted for the interest result, the other financial result and noncontrolling interests. 2 Value to Society results are calculated annually following the publication of the BASF Report. Accordingly, the statements on this in the BASF Report 2021 refer to the evaluation conducted for the 2020 business year.
BASF Report 2021 Management’s Report – Our Sustainability Concept 48 Our political advocacy is conducted in accordance with trans - Stakeholder demands and expectations of BASF parent guidelines and our publicly stated positions. The same applies to our activities in associations. For instance, we again Customers Investors published an Industry Associations Review in 2021 comparing – Innovative and sustainable solutions – Attractive dividend yield the energy and climate protection positions of BASF and the – Reliable partner – Transparency and risk minimization most important associations of which we are a member, with – Cost effectiveness – Strong long-term share performance explanations on our approach. Society: politics, NGOs, media Suppliers BASF does not financially support political parties, for example – Responsible and trustworthy partner – Fair and reliable business relationships through donations in cash or in kind. This is codified in a global – Production of safe products in compliance – Support in complying with our Supplier Code of guideline. In the United States, employees at BASF Corporation with environmental and social standards Conduct (environmental and social requirements) – Jobs and taxes have exercised their right to establish a Political Action Committee (PAC). The BASF Corporation Employee PAC is an independent, federally registered employee association founded in 1998. It Community Employees and management collects donations from employees for political purposes and – Support for local communities – Attractive and fair employer independently decides how these are used, in accordance with – Safe, disruption-free operations – Health protection – Attractive jobs – Opportunities for professional development U.S. law. We have a particular responsibility toward our production sites’ neighbors. With the established community advisory panels, we promote open exchange between residents and our site manage- Our societal engagement approach ment and strengthen trust in our activities. Our globally binding requirements for community advisory panels are based on the Through our societal engagement, we want to help disadvantaged grievance mechanism standards in the United Nations’ Guiding groups tackle their specific challenges – whether through initiatives Principles on Business and Human Rights. We keep track of in our immediate communities or around the world in cooperation their implementation through the existing global database of the with global organizations. We want to foster societal cohesion by Responsible Care Management System. supporting and protecting health, skills and resources. We support For more information on dialog with our stakeholder groups, see page 106 projects that aim to have a lasting impact on specific target groups For more information on our guidelines for responsible lobbying, see and offer learning opportunities for participating cooperation part- basf.com/guidelines_political_communication ners and BASF (see page 106). For more information on the Industry Associations Review, see basf.com/corporategovernance For more information on the Human Rights Advisory Council, see basf.com/human-rights-council In this way, societal engagement is an important part of the imple- For more information on the Stakeholder Advisory Council, see basf.com/en/stakeholder-advisory-council mentation of our sustainability strategy and our corporate social responsibility. Our societal engagement policy provides the guard- rails for our activities in this area. It stipulates that all engagement measures worldwide must be conducted in line with our compliance policy, BASF’s strategy and our sustainability commitments. For more information on our societal engagement, see page 106
BASF Report 2021 Management’s Report – Innovation 49 Innovation GRI 102, 302, 305 Protecting our climate and making the best use of limited natural resources while supplying the fast-growing global population with food, energy and clean water are among the greatest challenges of our time. Innovations based on chemistry play a pivotal role in overcoming these. That is why we are working together with our customers on innovative processes, technologies and products for a more sustainable future. At a glance In 2021, we generated sales of over €11 billion with products We will continue to use corporate funding to finance research of launched on the market in the past five years that stemmed from broad relevance to the BASF Group that goes beyond the industry- €2.2 billion ~820 research and development activities. In the long term, we aim to specific focus of the individual operating divisions. continue significantly increasing sales and earnings with new and Research and development New patents filed improved products – especially with products that make a substan- Research and development expenses by segment 2021 expenses tial sustainability contribution in the value chain (see page 141). Million € 17% 4% ▪ Close cooperation between research and business units Our central research is currently divided into three global divisions, Corporate research, Other Chemicals ▪ Focus on customers’ needs and requirements run from Europe, Asia Pacific and North America: Process 9% ▪ Close cooperation with universities, research institutes and Research & Chemical Engineering (Ludwigshafen, Germany); €2,216 million Materials companies Advanced Materials & Systems Research (Shanghai, China); and 41% 8% Bioscience Research (Research Triangle Park, North Carolina). Agricultural Solutions Industrial Solutions Innovation has always been the key to BASF’s success. The knowl- 13% edge and skills of our highly qualified employees is our most valuable We have already brought our research and development units closer Surface Technologies resource here and the source of our innovative strength. We had together over the past few years. We will reorganize our global 8% Nutrition & Care approximately 10,000 employees involved in research and devel- research activities in 2022 to further strengthen our innovation opment worldwide in 2021. performance and respond to our customers’ industry-specific requirements even better and more quickly going forward. Business Our research and development expenses amounted to and application-driven research units that are currently allocated to €2,216 mil lion in 2021 (2020: €2,086 million). Research and the three corporate research divisions will be integrated into the development activities in our operating divisions, which is mainly operating divisions, aligning them even more closely with the needs application and customer-related, accounted for 83% of this figure. of our customers. The aim is to further shorten the time to market Corporate research, in which we bundle cross-divisional and long- for new products and accelerate BASF’s organic growth. Research term topics, was responsible for 17% of these expenses. activities that are relevant to several operating divisions will be bundled in a central research division steered from Ludwigshafen, Our innovation focus is on developing sustainable solutions for Germany. This unit will continue to be globally organized with our customers. We ensure our long-term competitiveness by helping research centers in Europe, North America and Asia Pacific. our customers reduce their carbon footprint, use resources more Together with the development units in our operating divisions, it efficiently, or manufacture products in a more environmentally friendly forms the core of our global Know-How Verbund. way and to recycle them, to name a few examples.
BASF Report 2021 Management’s Report – Innovation 50 We strengthen existing research focus areas and continually develop We want to continue advancing our research and development Eight Academic Research Alliances new key technologies that are of central significance for our operat- activities, especially in Asia. For instance, in 2021 we started the ing divisions, such as polymer technologies, catalyst processes or third expansion phase for the BASF Innovation Campus in Shanghai, Access to scientific expertise, biotechnological methods. China. With this expansion, BASF will strengthen its research and talented minds and new technologies development capabilities for advanced materials and systems as We promote creative and agile research approaches. We are driving well as for chemical engineering. Construction is expected to be forward the development of new business areas. For example, we completed by the end of 2022. The Northeast Research Alliance (NORA) and the California are developing innovative coating technologies and materials that Research Alliance (CARA) are located in the United States. NORA make innovative surfaces and functions possible. Functional films A strong presence outside Europe creates new opportunities for focuses on materials science and biosciences, catalysis research, can be used to reduce the frictional resistance of surfaces or improve developing and expanding our customer relationships and scientific digitalization and cooperation with startups. Teams at the interdisci- UV protection and weather resistance, for example. Our innovative collaborations as well as for gaining access to talented employees. plinary CARA research center are working on new functional mate- solutions help our customers to achieve their sustainability goals. This strengthens our Research and Development Verbund and rials, formulations, digital methods, catalysis, chemical synthesis, makes BASF an even more attractive partner and employer. and in engineering sciences and biosciences. As part of our Carbon Management R&D Program, we are carrying out intensive research into pioneering, low-carbon production pro- The number and quality of our patents also attest to our power of The Joint Research Network on Advanced Materials and Systems cesses for basic chemicals such as hydrogen (see page 132). This innovation and long-term competitiveness. In 2021, we filed around (JONAS) is active in Europe and concentrates on supramolecular will enable us to offer our customers products with a lower carbon 820 new patents worldwide. The Patent Asset Index, a method that chemistry, polymer chemistry and the incubation of sustainable footprint in the future. compares patent portfolios, once again ranked us among the lead- technologies. We are working on innovative components and mate- ing companies in the chemical industry in 2021. rials for electrochemical energy storage with the Karlsruhe Institute Employees in research and development For more information on innovation, see basf.com/innovations of Technology (KIT) at the Battery and Electrochemistry Laboratory (BELLA). At the joint Catalysis Research Laboratory (CaRLa), BASF is researching homogeneous catalysis in cooperation with the Uni- ~10,000 Global network versity of Heidelberg. BasCat is a joint laboratory operated by the UniCat cluster of excellence and BASF at the Technical University of Our global network of top universities, research institutes and com- Berlin, where new heterogenous catalysis concepts are being panies forms an important part of our Know-How Verbund. It gives explored together with the Fritz Haber Institute of the Max Planck Our global research and development presence – and its effec- us direct access to external scientific expertise, talented minds from Society, also based in Berlin. The iL (Innovation Lab) in Heidelberg, tiveness – is vital to our long-term success. This enables us to various disciplines as well as new technologies – and helps us to Germany, focuses on functional printing, printed sensors and IoT respond to the needs and requirements of the regional markets in a quickly develop targeted, marketable innovations, strengthen our (internet of things) applications. differentiated way and leverage growth potential. portfolio with creative new projects, and in this way, reach our growth targets. At the Network for Asian Open Research (NAO) in the Asia Pacific The Ludwigshafen site in Germany is and will remain the largest in region, research focuses on polymer and colloid chemistry, cataly- our Research Verbund. Investments there include a combined labo- Our eight academic research alliances bundle partnerships with sis, machine learning and smart manufacturing. ratory building for cleanroom and elemental analysis. The new several research groups in a region or with a specific research focus. building’s modern digitalization and automation solutions set new The Academic Research Alliances are complemented by coop- standards in safety and efficiency. It is scheduled to open in 2022. erative partnerships with around 280 universities and research insti- In addition, we will build a new Catalyst Development and Solids tutes as well as collaborations with a large number of companies. Processing Center in Ludwigshafen, Germany, by 2024 to bring For more information on our collaboration initiatives, see basf.com/innovate-with-us process innovations and new chemical catalysts to market faster.
In Focus: From the Lab to Real-World Applications BASF Report 2021 Management’s Report – In Focus: From the Lab to Real-World Applications 51 In focus: From the Lab to Real-World Applications Our aim is to quickly turn ideas into innovations for a sustainable future. To achieve this, we bring together the creativity, experience and expertise of our employees with the know-how of our partners from academia and industry. Recycling industrial off-gases: Industrial off-gases are usually conditions in joint projects with academic partners and closely incinerated or thermally recovered. In both cases, CO is emitted. To coordinated laboratory and field research. The additional integra- 2 avoid this and to recycle the main components of the off-gases so tion of new digital tools and faster screening and testing methods they can be used in chemical production, BASF has been research- enables us to shorten our development times and develop high- ing an innovative process, gas fermentation, with the U.S. startup performance, environmentally compatible ingredients – not only for LanzaTech since 2018. The interdisciplinary team achieved an cleaning purposes, but also for cosmetics and industrial applications important breakthrough in 2021: using special bacteria, they were such as agrochemicals. able to produce n-octanol from carbon monoxide and hydrogen for the first time. The molecule is an alcohol and is used in cosmetics, Animal-free testing methods: The European Union wants to sig- for example. Normally, microorganisms cannot produce n-octanol, nificantly improve the safety of chemical products. BASF supports which is toxic to them. However, using biotechnological methods, this goal and has been actively working to make it a reality for many LanzaTech was able to program the organisms to produce and tol- years. For example, in order to meet expanded requirements and erate n-octanol as part of a gas fermentation process. In parallel, additional testing obligations under the E.U.’s Chemicals Strategy BASF researchers developed a process that enables the continuous for Sustainability in the future, we are developing innovative in vitro separation and purification of n-octanol. Following successful imple- methods with our own laboratory team and together with partners. mentation in the laboratory, the team is now working on further Among other things, they will help us to efficiently and reliably detect process improvements. Integrating gas fermentation technology and evaluate potential hormonal effects of substances – even with- into the BASF Verbund could contribute to a carbon- neutral circular out animal testing. BASF has been researching alternative methods economy in the future. for many years and recently reached an important milestone: In 2021, the OECD approved the world’s first toxicology testing Bio-based and biodegradable ingredients: Circular economy strategy without animal testing – a joint project between BASF and and sustainability are also playing an increasingly important role for Givaudan (see page 123). It can be used to reliably predict whether our customers in the detergent and cleaner industry. That is why a substance causes allergic reactions in the skin without animal interdisciplinary teams at BASF have been working hard on the testing. We make all methods developed by us and approved freely question of how to optimize cleaning performance and environ- available to interested companies and authorities. mental compatibility. The focus here is on new ingredients that can be produced from renewable raw materials and biodegraded at the end of their productive life cycle. This calls for new approaches in research and development. We are developing a funda- mental understanding of how biodegradation occurs under different
BASF Report 2021 Management’s Report – Economic Environment 52 The BASF Group’s Business Year In this section: Economic Environment Results of Operations Net Assets Economic Environment1 Financial Position Actual Development Compared With Outlook for 2021 The global economy recovered more quickly in 2021 from the previous year’s severe slump in economic Business Review by Segment activity than had been expected at the beginning of the year. Many governments’ aid programs and rising Other vaccination rates were key contributing factors to the recovery. Nevertheless, the economic upturn was Non-Integral Oil and Gas Business repeatedly hampered by measures to contain the pandemic and supply chain disruptions. Regional Results For the outlook on the economic environment in 2022, see page 145 onward E.U. Taxonomy 2021 at a glance Trends in the global economy in 2021 GDP rates in 2021 were strongly influenced by base effects. China’s GDP grew at a double-digit rate in the first quarter year on year. In +5.8% >6% The recovery of the global economy varied from region to region in the second quarter, the United States and the European Union then 2021. There were severe restrictions on public life in the first half of recorded very high growth rates. Global growth slowed down, how- Global GDP growth Increase in global industrial the year, particularly in Europe. In the second and third quarters, ever, in the second half of the year. Bottlenecks in global supply and chemical production many Asian countries struggled with coronavirus outbreaks and chains increasingly limited industry growth. Added to this were the ▪ Economic recovery in Europe and the United States, slowing took corresponding countermeasures. China maintained its zero- dampening effects of very high energy prices and a further sharp momentum in Asia Covid strategy throughout the year and responded to the emer- rise in infection rates in individual countries. ▪ Dynamic growth in global industrial production despite fragile gence of any infections with strict containment measures. In the supply chains and stagnating automotive industry United States, most restrictions were eased after the first quarter ▪ Strong growth in the global chemical industry despite sharply rising infection numbers over the course of the year. The steady r eopening of economies was facilitated by increasing ▪ Sharp increase in prices for crude oil and naphtha, vaccination rates. Vaccination rates increased significantly during drastic rise in gas prices the year in Western Europe and the United States, followed by the advanced Asian countries and China with some delay. Other advanced emerging economies, for example in South America, now Global gross domestic product (GDP) grew by 5.8% year on year also have high vaccination rates. In contrast, vaccination rates are (2020: –3.4%). Industrial production expanded by 6.5% (2020: still low in large parts of the poorer countries of Africa and Asia, as –3.0%). Global chemical production grew by 6.1% (2020: –0.1%). well as in Russia. The average price for a barrel of Brent crude oil increased to $71 per barrel (2020: $42 per barrel). 1 All information relating to past years in this section can deviate from the previous year’s report due to statistical revisions. Where available, calendar-adjusted macroeconomic growth rates are reported. Figures for 2021 not yet available in full are estimated.
BASF Report 2021 Management’s Report – Economic Environment 53 Gross domestic product Rapidly rising vaccination rates, as well as the complete reopening the automotive industry. Japan’s GDP only grew by 1.7% (2020: Real change compared with previous year of the U.K. economy from mid-July, contributed to this. However, –4.5%). South Korea saw significantly higher growth of 4.0% (2020: 2021 2020 the consequences of Brexit were felt over the course of the year, –0.9%). World 5.8% –3.4% particularly due to the shortage of labor in logistics chains and skilled E.U.1 5.2% –6.1% trades. The South America region recorded a rapid economic recovery, United States 5.7% –3.4% supported by rising prices for agricultural goods and industrial raw Russia’s GDP grew by 4.3% (2020: –2.9%). Increased oil and gas materials. Domestic demand in some countries was, however, Emerging markets of Asia2 7.3% 0.0% prices led to rising trade surpluses and bolstered growth, while high dampened by currency devaluations and rising inflation rates. Brazil Japan 1.7% –4.5% infection rates and lockdowns weighed on the economy. was able to increase its GDP by 4.7% (2020: –4.2%), bolstered by a South America 6.8% –6.2% considerable rise in exports and investments as well as moderate Economic development in the United States was volatile. Govern- growth in private consumption. Argentina’s economic output grew ment stimulus programs bolstered household demand considerably by a strong 9%, though the previous year’s decline had been signifi- Economic trends by region early in the year, which resulted in strong GDP growth in the first two cantly larger at nearly –10%. For the region as a whole, GDP rose by quarters. However, due to the expiration of aid benefits and a further 6.8% in 2021, after a decline of approximately the same magnitude In the European Union (E.U.), GDP grew by 5.2% (2020: –6.1%). rise in infection rates coupled with increasing supply problems due in the previous year. At the beginning of the year, restrictions in stationary retail, hospi- to congestion in the country’s largest ports, growth in private con- tality, tourism, and the cultural and entertainment sectors negatively sumption was more sluggish in the second half of the year. In total, impacted economic recovery. In the course of the second quarter, GDP in the United States grew by 5.7% in 2021 (2020: –3.4%). Trends in key customer industries the restrictions were successively relaxed as a result of falling infec- tion rates. At the same time, the vaccination campaign, which got In the emerging markets of Asia, growth weakened significantly in Growth in industrial production was negatively impacted by supply off to a slow start due to a shortage of vaccines, gained momentum. the course of the year. China’s dynamic recovery that began in the difficulties in 2021. In many areas, existing orders could not be pro- Due to base effects, GDP growth in the second quarter was in the previous year continued initially. However, mobility restrictions and cessed due to a lack of intermediate goods. Transport capacities, double digits compared with the previous year. There was, however, selective lockdowns, even with only few occurrences of coronavirus especially ship and container capacities in overseas trade, were not also a significant upturn in the second and third quarters of 2021 infections, as well as more restrictive financing conditions in the sufficient to meet the sharp rise in demand for industrial goods. compared with the first quarter, especially in European tourist construction sector, negatively affected domestic demand growth. Furthermore, manufacturing disruptions in Asia due to regional destinations. In France (+7.0%), Italy (+6.4%) and Spain (+5.0%), In addition, energy was rationed. By contrast, export demand grew lockdowns were also a factor. GDP grew especially dynamically in 2021. By c ontrast, Germany significantly. In total, the Chinese economy expanded by 8.1% was hit harder by bottlenecks in intermediate inputs for the invest- (2020: 2.2%). Many other emerging markets in Asia, including India, Global industrial production grew by 6.5% in 2021 (2020: –3.0%). ment goods and automotive industries. At 2.8%, Germany’s Malaysia and Thailand, were forced to temporarily adopt restrictive The advanced economies saw somewhat lower growth of 5.3% economy thus grew at a below-average rate in 2021. Despite lower measures to contain waves of infection. All in all, the region grew by overall than the emerging markets, which saw a rise of 7.4%. The vaccination rates and higher infection rates, growth in the eastern 7.3% in 2021. largest contribution to global industrial production growth came E.U. countries (+5.3%) was at a similar level to that in the western from China (2021: +8.4%; 2020: +3.7%). Around 30% of global E.U. countries (+5.2%). The economies of Japan and South Korea were also significantly industrial value creation and almost 40% of its growth were gen er- impacted by the pandemic. Japan temporarily declared a state of ated there. In total, over 50% of global industrial growth came from Despite the end of the Brexit transition period at the beginning of the emergency. Private consumption was thus only able to increase Asia. The region’s production expanded by 7.5% in 2021 (2020: year, the United Kingdom’s economy (2021: +7.5%) recovered slightly. Although exports rose considerably, they were negatively –0.1%). substantially from its major slump in the previous year (2020: –9.4%). affected by the decline in growth in China and supply bottlenecks in 1 In this chapter, “E.U.” refers to the E.U. 27. 2 We define the emerging markets of Asia as Greater China, the ASEAN countries (Brunei, Indonesia, Malaysia, Myanmar, Cambodia, Laos, the Philippines, Singapore, Thailand, Vietnam), India, Pakistan and Bangladesh.
BASF Report 2021 Management’s Report – Economic Environment 54 In the E.U., industrial production also increased significantly by 6.6% The construction industry expanded by around 4% (2020: –1.1%) Also above average, agricultural production grew by 3.2%, as the (2020: –7.1%). After the sharp decline in the previous year, the despite a sharp rise in prices for scarce building materials. Growth overall negative impact of extreme weather events on yields was United Kingdom saw growth of 8.3% (2020: –10.4%). By contrast, was strongest in residential construction at almost 6%. Here, the minor relative to recent years and global demand for agricultural North America’s industrial growth was below average at 5.0% rising demand for housing during the pandemic played a key role; goods increased dynamically due to economic recovery. Growth (2020: –4.8%). South America recorded an increase just above the furthermore, government transfers and persistently low interest was driven primarily by Asia (+5.3%). By contrast, production growth global average (2021: 7.0%; 2020: –6.5%). rates strengthened the purchasing power of private households. was only weak in South America (+1.2%) and even declined slightly Growth in residential construction was particularly high in the United in North America and Europe. Growth in key customer industries States. Residential construction in Europe grew only slightly above Real change compared with previous year the overall market average. In China, on the other hand, residential 2021 2020 construction cooled significantly in the wake of the government’s Trends in the chemical industry Industry total 6.5% –3.0% efforts to limit real estate prices and debt. Commercial construction Transportation 2.5% –16.6% investments remained weak with growth of less than 3%. Growth in Global growth in the chemical industry was 6.1% in 2021, almost as Of which: automotive industry 2.5% –15.9% the less volatile infrastructure segment was also below average at high as growth for the industry as a whole, despite only a minimal around 3%. decline in chemical production in the previous year unlike in many Energy and resources 3.3% –3.5% other industries. While the stronger performance in the previous year Construction 3.9% –1.1% After a decline of 2.7% in the previous year, consumer goods pro- had mainly been due to extraordinary pandemic-related demand for Consumer goods 9.0% –2.7% duction grew by a total of 9.0%. High growth rates between around disinfectants, cleaning agents and single-use plastics, as well as to Electronics 12.0% 3.2% 9% and 13% were recorded in the furniture and textile industries as the early recovery in China, in 2021, the global upswing in many Health and nutrition 6.4% 0.2% well as in the production of electrical appliances. Expansion in the consumer goods industries contributed to growth. care products sector was, by contrast, more modest at 4.3%. This Agriculture 3.2% 2.0% industry had not contracted in the previous year and was therefore Chemical production in China, the world’s largest chemical market, less able to benefit from base effects. saw especially strong expansion (+7.7%). However, growth slowed Global automotive production was particularly affected by supply at a high level during the course of the year. Electricity cuts had a problems with semiconductors. Although base effects ensured The electronics sector saw above-average growth of 12%. It negative effect on production, particularly in the third and fourth strong growth at the beginning of the year, the shortage in semicon- bene fited from the general trend toward digitalization and con nec- quarters. Growth in other emerging markets of Asia was also high at ductors worsened so significantly in the second half of the year that tivity, as well as from demand for consumer electronics and elec- around 6.9%. many automotive manufacturers had to respond by cutting produc- tronic control of household appliances and motor vehicles. Growth tion or even temporarily shutting down entire plants. As a result, was slowed by capacity bottlenecks in the production of computer Chemical production growth in the European Union was also automotive production grew only slightly overall by 2.5% in 2021 chips. extraor dinarily high at 6.0%. A contributing factor was the low basis after contracting by 15.9% in the previous year. Production levels in the previous year (2020: –2.1%). In addition, the European chemi- remained exceptionally low, with a total of around 76 million vehicles Global demand for energy and industrial raw materials rose sharply cal industry benefited from the fact that availability of global produc- produced worldwide. Similarly low production volumes had last in 2021. Production in the energy and raw materials sector, how- tion capacities for basic chemicals was intermittently limited. The been recorded in the early 2010s. Moderate growth was achieved in ever, only increased by 3.3% (2020: –3.5%), which resulted in sig- Middle East (+6.2%) also recorded solid production growth. Asia (+5.1%). The North American market stagnated (+0.1%). In the nifi cant price increases. The health and nutrition sector achieved E.U., by contrast, production decreased by 6.2% in 2021, following growth of 6.4%, which was above average for recent years due to By contrast, significant petrochemical capacities were temporarily a decline of nearly 25% in 2020. Of all the regions, South America 15% growth in the pharmaceuticals industry resulting from vaccine unavailable in the United States, in particular. After the cold spell in achieved the highest growth rate; however, it saw the strongest production. Production in the food industry grew by 3.7%, which, by the first quarter, production on the U.S. Gulf Coast was negatively decrease in the previous year (2021: +16.1%; 2020: –31.1%). contrast, was just slightly better than the long-term average. impacted by hurricanes Ida and Nicholas as well. In total, production
BASF Report 2021 Management’s Report – Economic Environment 55 in the United States thus only grew by 1.8% in 2021. Chemical Price trends for crude oil (Brent) and naphtha production in South America increased by 4.6%. $/barrel, $/metric ton $/t $/bbl Chemical production (excluding pharmaceuticals) 1,100 130 Real change compared with previous year 1,000 120 2021 2020 900 Naphtha Crude oil 110 800 ø 2021: $635/t ø 2021: $71/bbl 100 World 6.1% –0.1% ø 2020: $355/t ø 2020: $42/bbl European Union 6.0% –2.1% 700 90 600 80 United States 1.8% –3.5% 500 70 Emerging markets of Asia 7.6% 2.4% 400 60 Japan 3.7% –12.7% 300 50 South America 4.6% –0.6% 200 40 100 30 0 20 Price trends for key commodities Following the slump in 2020, raw materials prices rose sharply over Jan 20Feb 20Mar 20Apr 20May 20June 20July 20Aug 20Sept 20Oct 20Nov 20Dec 20Jan 21Feb 21Mar 21Apr 21May 21June 21July 21Aug 21Sept 21Oct 21Nov 21Dec 21 the course of 2021. Global oil demand increased significantly again, but supply was only augmented modestly by OPEC+. As a result, the average price for reference Brent crude oil increased to level ($1.99 per mmBtu). Gas prices in China averaged around $71 per barrel (2020: $42 per barrel). The price of oil fluctuated over $6.72 per mmBtu nationally (2020: $6.29 per mmBtu), while the the course of the year between around $55 per barrel in January average price in the coastal provinces was $7.99 per mmBtu and around $84 per barrel in October. (2020: $7.48 per mmBtu). Over the course of the year, the average monthly price for the chemi cal raw material naphtha ranged between $501 per metric ton in January and $764 per metric ton in October. At $635 per metric ton, the annualized average price of naphtha in 2021 was signifi- cantly higher than in 2020 ($355 per metric ton). High demand from Asia, cold weather and low storage levels in Western Europe, as well as a limited supply of liquid natural gas led to sharp increases in gas prices. At $16.02 per mmBtu, the average price of gas on the European spot market in particular was significantly higher than in 2020 ($3.17 per mmBtu). It rose from an average price of $6.56 per mmBtu in the first quarter to $31.92 per mmBtu in the fourth quarter. The average price of gas in the United States was $3.89 per mmBtu, likewise well above the prior-year
BASF Report 2021 Management’s Report – Results of Operations 56 Results of Operations Salesa, b recorded considerably lower EBIT before special items. The decline Million € in earnings in the Nutrition & Care segment was mainly attributable The global economy recovered much more strongly than we to lower margins on the back of higher raw materials and energy expected in 2021 following the severe slump in the previous 2021 78,598 prices, as well as an increase in fixed costs. EBIT before special year due to the effects of the coronavirus pandemic. Many 2020 59,149 items was lower in the Agricultural Solutions segment, largely due to governments’ aid programs and rising vaccination rates were 2019 59,316 higher fixed costs, higher raw materials prices and logistics costs, key contributing factors to this. In this market environment, 2018 60,220 and a low-margin product mix. The segment’s earnings were addi- growth in global industrial production and in the global 2017 61,223 tionally weighed down by negative currency effects. chemical industry (excluding pharmaceuticals) was also For an explanation of the indicator EBIT before special items, see page 43 significantly above the prior-year level and the long-term a Sales for 2018 were reduced by the share attributable to construction chemicals activities due to their presentation as discontinued operations. Figures for 2017 have not been restated. average. BASF’s business also developed favorably: We b Sales for 2017 were reduced by the share attributable to oil and gas activities due to their presentation as discontinued operations. considerably increased sales and earnings. EBIT before special itemsa, b, c For more information on the development of Accelerator sales, see page 141 onward Million € Business reviews by segment can be found from page 69 onward For more information on the development of CO emissions, see page 127 2 2021 7,768 At a glance Factors influencing sales of the BASF Group 2020 3,560 2019 4,643 Change Change ▪ Sales and EBIT before special items considerably above in million € in % 2018 6,281 prior year Volumes 6,279 10.6 2017 7,645 ▪ Considerable increase in ROCE to 13.5% Prices 14,673 24.8 a EBIT for 2019 has been restated to reflect the reclassification of income from non-integral companies ▪ Net income from shareholdings improves by €1,116 million accounted for using the equity method to net income from shareholdings. Figures for the years 2017 Currencies –1,439 –2.4 and 2018 have not been restated. b EBIT before special items for 2018 was reduced by the share attributable to construction chemicals ▪ Earnings per share of €6.01; adjusted earnings per share Acquisitions 431 0.7 activities due to their presentation as discontinued operations. Figures for 2017 have not been restated. of €6.76 c EBIT before special items for 2017 was reduced by the share attributable to oil and gas activities due to Divestitures –495 –0.8 their presentation as discontinued operations. Changes in the scope of consolidation –1 0.0 Sales rose by €19,449 million compared with the previous year to €78,598 million in 2021. This was mainly driven by higher prices and Total change in sales 19,449 32.9 Special items in EBIT totaled –€91 million in 2021, compared with volumes in all segments. Price levels increased in the Chemicals, –€3,751 million in the previous year, which was strongly impacted by Surface Technologies and Materials segments in particular. Sales Income from operations (EBIT) before special items rose by impairments on property, plant and equipment and intangible assets volumes grew primarily in the Surface Technologies and Materials €4,208 million to €7,768 million, largely due to considerably higher in the total amount of around €2.9 billion. In 2021, restructuring segments. Currency effects, mainly relating to the U.S. dollar, had an earnings in the Chemicals and Materials segments. Earnings devel- measures gave rise to expenses of €99 million (2020: expenses of offsetting effect. Sales performance was also weighed down by opment in the Chemicals segment was primarily driven by higher €952 million), mainly in the Agricultural Solutions and Materials negative portfolio effects, especially in the Industrial Solutions seg- margins, higher sales volumes and an improvement in equity- segments and in Other. The release of provisions in connection with ment following the divestiture of the global pigments business. This accounted income. Earnings growth in the Materials segment was the restructuring of the Global Business Services unit had an off- could only be partly offset by positive portfolio effects, mainly from mainly attributable to higher margins in isocyanates and polyamides, setting effect. Integration costs amounted to €85 million (2020: inte- the acquisition of a majority shareholding in BASF Shanshan Battery as well as positive volume development. EBIT before special items gration costs of €157 million) and primarily related to the integration Materials Co., Ltd. in the Surface Technologies segment. also improved considerably in the Surface Technologies and Indus- of the acquired BASF Shanshan companies and the polyamide trial Solutions segments, largely as a result of higher volumes. By business acquired from Solvay in 2020. Divestitures, which also contrast, the Nutrition & Care and Agricultural Solutions segments included the disposal of the global pigments business, gave rise to
BASF Report 2021 Management’s Report – Results of Operations 57 special income totaling €120 million, especially from the sale of our EBITa, b, c ROCE production site in Kankakee, Illinois, the Coatings division’s precision Million € Million € micro chemicals business and our share in the condensate splitter in 2021 2020 Port Arthur, Texas. Other items led to special charges in the total 2021 7,677 EBIT of BASF Group 7,677 –191 amount of €27 million. 2020 –191 – EBIT of Other –641 –1,203 For the definition of special items, see page 43 2019 4,201 EBIT of the segments 8,317 1,012 2018 5,974 Cost of capital basis of segments, 61,579 60,111 7,587 average of month-end figures 2017 Special items ROCE % 13.5 1.7 Million € a EBIT for 2019 has been restated to reflect the reclassification of income from non-integral companies 2021 2020 accounted for using the equity method to net income from shareholdings. Figures for the years 2017 and 2018 have not been restated. b EBIT before special items for 2018 was reduced by the share attributable to construction chemicals Restructuring measures –99 –952 activities due to their presentation as discontinued operations. Figures for 2017 have not been restated. Capital employed c EBIT for 2017 was reduced by the share attributable to oil and gas activities due to their presentation as Integration costs –85 –157 discontinued operations. Million € 2021 2020 Divestitures 120 –76 We use the indicator return on capital employed (ROCE). ROCE Intangible assets 13,143 14,249 Other charges and income –27 –2,566 was 13.5%, after 1.7% in the previous year. The increase in ROCE + Property, plant and equipment 19,280 20,210 Total special items in EBIT –91 –3,751 1 was primarily due to considerably higher EBIT. + Integral investments accounted for using the 1,682 1,395 For more information on the calculation of ROCE, see page 42 equity method At €7,677 million, EBIT for the BASF Group in 2021 was consider- The calculation of EBIT as part of our statement of income is shown in the Consolidated Financial + Inventories 11,459 10,469 ably above the previous year, which was impacted by high impair- Statements on page 194 + Accounts receivable, trade 11,588 9,379 ments. This figure includes income from integral companies + Current and noncurrent other receivables a 3,908 3,149 accounted for using the equity method, which rose by €455 million and other assets to €675 million. This was mainly attributable to the business-related + Assets of disposal groups 520 1,260 increase in the earnings contributed by BASF-YPC Company Ltd., Cost of capital basis of segments, Nanjing, China, which rose by €343 million. average of month-end figures 61,579 60,111 + Deviation from cost of capital basis at 2,688 –3,948 closing rates as of December 31 + Assets not included in cost of capital 23,115 24,129 Assets of the BASF Group as of December 31 87,383 80,292 a Including customer/supplier financing and other adjustments 1 For more information on net assets, see page 61 onward
BASF Report 2021 Management’s Report – Results of Operations 58 Net income from shareholdings, financial result and income Income after taxes in the amount of €5,982 million (2020: is also highly useful in making comparisons over time. The EBITDA after taxes –€1,075 million) included €5,523 million attributable to shareholders margin is a relative indicator and is calculated as the ratio of EBITDA of BASF SE (2020: –€1,060 million). Noncontrolling interests to sales revenue, enabling operational performance to be compared Net income from shareholdings was above the prior-year figure, amounted to €459 million, after –€15 million in the prior year. This independent of the size of the underlying business. rising by €1,116 million to €207 million in 2021 (2020: –€909 million). mainly resulted from a higher earnings contribution from BASF The increase was mainly due to special income from the sale of our TotalEnergies Petrochemicals LLC in Port Arthur, Texas, and a EBITDA before special items rose by €3,913 million year on year to shares in Solenis (€589 million) as well as the improved earnings positive earnings contribution fr om BASF Petronas Chemicals Sdn. €11,348 million in 2021. At €11,355 million, EBITDA was €4,861 mil- contribution from Wintershall Dea AG (–€344 million). This included Bhd. Petaling Jaya, Malaysia, where earnings in the prior year had lion above the prior-year figure. The EBITDA margin was 14.4% in impairments in the amount of €581 million, less than in the prior been impacted by impairments. 2021, compared with 11.0% in the previous year. year. In 2021, earnings per share amounted to €6.01, compared with The financial result amounted to –€436 million, compared with –€1.15 in the previous year. EBITDA before special items –€462 million in the previous year. The interest result improved by For more information on the items in the statement of income, see the Notes to the Consolidated Million € €59 million overall, due in part to lower interest expenses for financial Financial Statements from page 200 onward 2021 2020 indebtedness. The other financial result amounted to –€122 million For more information on the tax rate, see Note 12 to the Consolidated Financial Statements from EBIT 7,677 –191 page 231 onward after –€89 million in 2020, primarily driven by higher net expenses in – Special items –91 –3,751 connection with bonds in foreign currency and the corresponding EBIT before special items 7,768 3,560 hedging instruments. Lower write-downs on securities and loans, as Additional indicators for results of operations + Depreciation and amortization 3,534 3,805 well as a lower net interest expense from pension plans and similar + Impairments and reversals of impairments obligations had an offsetting effect. We also use alternative performance measures (APMs) to steer the on property, plant and equipment and intangible 45 70 BASF Group. Investors, analysts and rating agencies use them to assets before special items Income before income taxes amounted to €7,448 million in 2021, assess our performance. These are not defined by IFRS. As such, Depreciation, amortization, impairments and after –€1,562 million in 2020. the methods of calculation can differ from those used by other reversals of impairments on property, plant and 3,580 3,875 equipment and intangible assets before special companies. Alternative performance measures for the results of items Income tax expenses were €1,430 million, after the negative pre-tax operations are EBIT before special items, EBITDA before special EBITDA before special items 11,348 7,435 result had led to tax income of €91 million in the previous year. items, EBITDA, the EBITDA margin and adjusted earnings per share. 1 1 Other APMs are net debt, free cash flow and capital expenditure 2 Compared with 2020, income after taxes from continuing opera- (capex). tions rose by €7,489 million to €6,018 million. Income after taxes from discontinued operations amounting to –€36 million resulted Income from operations before depreciation, amortization and from purchase price adjustments for the divestiture of the construc- special items (EBITDA before special items) and income from tion chemicals business. The prior-year figure of €396 million operations before depreciation and amortization (EBITDA) are included the book gain from the sale of the former Construction indicators that describe operational performance independent of Chemicals division and its operating income after taxes until age-related depreciation and amortization of assets and any impair- divestiture. ment or reversal of impairment. Both figures are therefore particularly useful in cross-company comparisons. EBITDA before special items 1 For more information on these indicators, see the Financial Position from page 63 onward 2 For more information on capex, see Our Steering Concept on page 43 and Material Investments and Portfolio Measures on page 38
BASF Report 2021 Management’s Report – Results of Operations 59 EBITDA Compared with earnings per share, adjusted earnings per share is Million € firstly adjusted for special items. Amortization, impairment and 2021 2020 reversal of impairment on intangible assets are then eliminated. EBIT 7,677 –191 Amortization of intangible assets primarily results from the purchase + Depreciation and amortization 3,534 3,805 price allocation following acquisitions and is therefore of a temporary + Impairments and reversals of impairments on nature. The effects of these adjustments on income taxes and on property, plant and equipment and intangible 144 2,880 noncontrolling interests are also considered. This makes adjusted assets earnings per share a suitable measure for making comparisons over Depreciation, amortization, impairments and time and predicting future profitability. reversals of impairments on property, plant 3,678 6,685 and equipment and intangible assets EBITDA 11,355 6,494 In 2021, adjusted earnings per share amounted to €6.76, compared Sales revenue 78,598 59,149 with €3.21 in the previous year. EBITDA margin % 14.4 11.0 For more information on the earnings per share according to IFRS, see Note 6 to the Consolidated Financial Statements on page 220 Adjusted earnings per share Million € 2021 2020 Income after taxes 5,982 –1,075 – Special itemsa –181 –4,606 + Amortization, impairments and reversals of impairments on 614 1,496 intangible assets – Amortization, impairments and reversals of impairments on 0 819 intangible assets contained in special items – Adjustments to income taxes 116 958 – Adjustments to income after taxes from discontinued –36 251 operations Adjusted income after taxes 6,695 2,999 – Adjusted noncontrolling interests 483 54 Adjusted net income 6,212 2,945 Weighted average number of outstanding shares (in thousands) 918,479 918,479 Adjusted earnings per share € 6.76 3.21 a Includes special items in net income from shareholdings of €90 million for 2021 and €855 million for 2020
BASF Report 2021 Management’s Report – Results of Operations 60 Sales and earnings Sales and earnings by quarter in 2021a Million € Million € 2021 2020 +/– Q1 Q2 Q3 Q4 Full year Sales 78,598 59,149 32.9% Sales 19,400 19,753 19,669 19,776 78,598 Income from operations before depreciation, 11,348 7,435 52.6% Income from operations before depreciation, amortization and special items 3,181 3,217 2,771 2,179 11,348 amortization and special items Income from operations before depreciation and amortization (EBITDA) 3,176 3,199 2,729 2,250 11,355 Income from operations before depreciation 11,355 6,494 74.9% and amortization (EBITDA) Depreciation and amortizationb 865 883 907 1,023 3,678 EBITDA margin % 14.4 11.0 − Income from operations (EBIT) 2,311 2,316 1,822 1,227 7,677 Depreciation and amortizationa 3,678 6,685 –45.0% Special items −10 −39 −43 1 −91 Income from operations (EBIT) 7,677 –191 . EBIT before special items 2,321 2,355 1,865 1,227 7,768 Special items –91 –3,751 97.6% Income before income taxes 2,247 2,189 1,777 1,235 7,448 EBIT before special items 7,768 3,560 118.2% Income after taxes from continuing operations 1,810 1,794 1,424 990 6,018 Income before income taxes 7,448 –1,562 . Income after taxes from discontinued operations − − −43 7 −36 Income after taxes from continuing operations 6,018 –1,471 . Net income 1,718 1,654 1,253 898 5,523 Income after taxes from discontinued –36 396 . Earnings per share € 1.87 1.80 1.36 0.98 6.01 operations Adjusted earnings per share € 2.00 2.03 1.56 1.17 6.76 Net income 5,523 –1,060 . Earnings per share € 6.01 −1.15 . Sales and earnings by quarter in 2020a Adjusted earnings per share € 6.76 3.21 110.6% Million € Q1 Q2 Q3 Q4 Full year a Depreciation and amortization of property, plant and equipment and intangible assets (including impairments Sales 16,753 12,680 13,811 15,905 59,149 and reversals of impairments) Income from operations before depreciation, amortization and special items 2,579 1,229 1,542 2,085 7,435 Income from operations before depreciation and amortization (EBITDA) 2,428 1,070 1,044 1,952 6,494 Depreciation and amortizationb 972 1,011 3,682 1,020 6,685 Income from operations (EBIT) 1,456 59 −2,638 932 −191 Special items −184 −167 −3,219 −181 −3,751 EBIT before special items 1,640 226 581 1,113 3,560 Income before income taxes 1,200 −923 −2,786 947 −1,562 Income after taxes from continuing operations 881 −888 −2,177 713 −1,471 Income after taxes from discontinued operations 22 14 13 347 396 Net income 885 −878 −2,122 1,055 −1,060 Earnings per share € 0.97 −0.96 −2.31 1.15 −1.15 Adjusted earnings per share € 1.26 0.25 0.60 1.10 3.21 a Quarterly results not audited b Depreciation and amortization of property, plant and equipment and intangible assets (including impairments and reversals of impairments)
BASF Report 2021 Management’s Report – Net Assets 61 Net Assets Assets Assets December 31, 2021 December 31, 2020 Million € % Million € % At a glance Intangible assets 13,499 15.4 13,145 16.4 Property, plant and equipment 21,553 24.7 19,647 24.5 ▪ Increase in total assets to €87,383 million mainly due to higher current assets Integral investments accounted for using the equity method 2,540 2.9 1,878 2.3 ▪ Intangible fixed assets and property, plant and equipment around Non-integral investments accounted for using the equity method 9,843 11.3 10,874 13.5 €2.3 billion above the prior year -end figure overall Other financial assets 575 0.7 582 0.7 Deferred tax assets 2,600 3.0 3,386 4.2 Total assets amounted to €87,383 million as of December 31, 2021, Other receivables and miscellaneous assets 1,722 2.0 912 1.1 €7,091 million above the prior-year level. Noncurrent assets 52,332 59.9 50,424 62.7 Noncurrent assets rose by €1,908 million to €52,332 million. This Inventories 13,868 15.9 10,010 12.5 was mainly attributable to the €1,906 million increase in property, plant and equipment. Additions to property, plant and equipment Accounts receivable, trade 11,942 13.7 9,466 11.8 amounted to €4,410 million and included €332 million in connection Other receivables and miscellaneous assets 5,568 6.4 4,673 5.8 with the formation of BASF Shanshan Battery Materials Co., Ltd. Marketable securities 208 0.2 207 0.3 Currency effects of €798 million also contributed to the increase. Cash and cash equivalents 2,624 3.0 4,330 5.4 Depreciation amounted to €2,922 million. Intangible assets amounted Assets of disposal groups 840 1.0 1,182 1.5 to €13,499 million, €354 million above the prior year-end figure. The increase was due in particular to currency effects in the amount Current assets 35,051 40.2 29,868 37.3 of €572 million. Additions to intangible assets totaled €470 million Total assets 87,383 100.0 80,292 100.0 and included €392 million from the formation of BASF Shanshan Battery Materials, of which goodwill was €254 million. Amortization of €612 million had an offsetting effect. For more information on the above transactions see page 41 of this Management’s Report and Note 3 to the Consolidated Financial Statements from page 207 onward
BASF Report 2021 Management’s Report – Net Assets 62 Noncurrent other receivables and miscellaneous assets amounted Assets of disposal groups amounted to €840 million as of Decem- to €1,722 million, up €810 million from the prior-year level. This pri- ber 31, 2021. These include the assets of the shareholding in the marily resulted from higher defined benefit assets and derivatives Hollandse Kust Zuid wind farm and the kaolin minerals business, with positive fair values. which is held for sale. For more information on the composition and development of individual asset items, see the Notes to Integral investments accounted for using the equity method rose by the Consolidated Financial Statements from page 200 onward €662 million year on year to €2,540 million, mainly due to positive after-tax earnings at BASF YPC-Company Ltd., Nanjing, China, and positive currency effects. The €1,031 million decline in the carrying amounts of non-integral shareholdings accounted for using the equity method compared with December 31, 2020, was largely attributable to dividend pay- ments by and negative after-tax earnings at Wintershall Dea AG and to the disposal of the shareholding in Solenis. Other financial assets decreased by €7 million compared with the prior year-end figure. Deferred tax assets declined by €786 million, primarily as a result of lower pension provisions. Current assets rose by €5,183 million to €35,051 million. This was driven by the €3,858 million increase in inventories compared with the prior year-end as a result of higher raw materials prices and the stronger business performance in 2021. The €2,476 million increase in trade accounts receivable was also mainly due to strong business development. Other receivables and miscellaneous assets rose by €895 million, primarily due to higher tax refund claims and positive fair values of derivatives. The €1,706 million decrease in cash and cash equivalents compared with the figure as of December 31, 2020, to €2,624 million had an offsetting effect.
BASF Report 2021 Management’s Report – Financial Position 63 Financial Position Equity and liabilities Equity and liabilities December 31, 2021 December 31, 2020 Million € % Million € % At a glance Subscribed capital and capital reserves 4,282 4.9 4,291 5.3 Retained earnings 40,365 46.2 37,911 47.2 ▪ Equity ratio of 48.2% after 42.8% in previous year Other comprehensive income –3,855 –4.4 –8,474 –10.6 ▪ Net debt slightly reduced to €14,352 million Noncontrolling interests 1,289 1.5 670 0.8 ▪ Rated A by Standard & Poor’s, Moody’s and Fitch Equity 42,081 48.2 34,398 42.8 ▪ Cash flows from operating activities and free cash flow higher year on year Provisions for pensions and similar obligations 6,160 7.0 8,566 10.7 Deferred tax liabilities 1,499 1.7 1,447 1.8 Equity rose by €7,683 million compared with the previous year to Tax provisions 415 0.5 587 0.7 €42,081 million. Retained earnings rose by €2,454 million, mainly Other provisions 1,782 2.0 1,484 1.8 because net income significantly exceeded the dividend payments of €3,031 million disbursed in the second quarter of 2021. Other Financial indebtedness 13,764 15.8 15,819 19.7 comprehensive income increased equity by €4,619 million, primarily Other liabilities 1,600 1.8 1,711 2.1 as a result of actuarial gains and currency effects. Noncurrent liabilities 25,220 28.8 29,614 36.9 The equity ratio improved from 42.8% to 48.2%. Accounts payable, trade 7,826 9.0 5,291 6.6 Compared with the 2020 year-end, noncurrent liabilities declined Provisions 3,935 4.5 2,825 3.5 by €4,394 million to €25,220 million. This was primarily attributable Tax liabilities 1,161 1.3 988 1.2 to the €2,406 million decrease in provisions for pensions and similar Financial indebtedness 3,420 3.9 3,395 4.3 obligations, mainly as a result of higher interest rates in all relevant Other liabilities 3,679 4.2 3,440 4.3 currency zones and returns on plan assets. Liabilities of disposal groups 61 0.1 341 0.4 Current liabilities 20,081 23.0 16,280 20.3 Furthermore, noncurrent financial indebtedness declined by €2,055 million. This was primarily due to the reclassification of three Total equity and liabilities 87,383 100.0 80,292 100.0 bonds with an aggregate carrying amount of €1,936 million and a loan in the amount of €240 million to current financial indebtedness. Exchange rates and interest had an offsetting effect. Tax provisions declined by €172 million year on year to €415 million. By contrast, deferred tax liabilities were slightly above the prior year- end figure, at €1,499 million.
BASF Report 2021 Management’s Report – Financial Position 64 The €111 million decrease in other noncurrent liabilities largely Net debt Maturities of financial indebtedness resulted from lower negative fair values of derivatives. Million € Million € December 31, December 31, 2022 3,420 2021 2020 Other provisions rose by €298 million, mainly due to higher environ- Noncurrent financial indebtedness 13,764 15,819 2023 2,208 mental provisions. 2024 1,280 + Current financial indebtedness 3,420 3,395 At €20,081 million, current liabilities were €3,801 million above the Financial indebtedness 17,184 19,214 2025 1,892 figure as of December 31, 2020. This was primarily due to the – Marketable securities 208 207 2026 1,177 €2,535 million increase in trade accounts payable, largely as a result – Cash and cash equivalents 2,624 4,330 2027 and beyond 7,207 of positive business development. In addition, current provisions Net debt 14,352 14,677 rose by €1,110 million compared with the previous year, primarily BASF enjoys good credit ratings, especially compared with com- from higher provisions for bonus payments and for rebates. Other petitors in the chemical industry. Standard & Poor’s most recently liabilities increased by €239 million. confirmed its rating for BASF of A/A-1/outlook stable on January 6, Off-balance sheet obligations 2022. Moody’s most recently confirmed BASF’s A3/P-2/outlook Current financial indebtedness was on a level with the prior year- stable rating on January 5, 2022. Fitch’s rating of A/F1/outlook end. This was attributable to the above-mentioned reclassification of Off-balance sheet obligations mainly relate to long-term purchase stable from June 11, 2021, also remained unchanged. three bonds and a loan in the aggregate amount of around €2.2 bil- obligations for raw materials. We also concluded long-term supply lion from noncurrent to current financial indebtedness. The reduction agreements for green power in 2021. In addition, obligations exist in We have solid financing. Corporate bonds form the basis of our in commercial paper at BASF SE (around €1 billion) and the sched- connection with initiated or planned investment projects. medium to long-term debt financing. These are issued in euros and uled repayment of a eurobond (€1 billion) and a loan (€150 million) For more information, see Note 25 to the Consolidated Financial Statements on page 263 and the other currencies with different maturities as part of our €20 billion had an offsetting effect. forecast from page 145 onward debt issuance program. The goal is to create a balanced maturity profile, diversify our financing and optimize our debt capital financing Tax liabilities rose by €173 million compared with the previous year. conditions. Financing policy and credit ratings Liabilities of disposal groups amounted to €61 million. For short-term financing, we use BASF SE’s global commercial Our financing policy aims to ensure our solvency at all times, limiting paper program, which has an issuing volume of up to $12.5 billion. Net debt declined by €325 million compared with December 31, the risks associated with financing and optimizing our cost of capi- As of December 31, 2021, commercial paper with a carrying amount 2020, to €14,352 million. tal. We preferably meet our external financing needs on the interna- of €248 million was outstanding under this program. A firmly com- For more information on the composition and development of individual asset items, see the Notes to tional capital markets. mitted, syndicated credit line of €6 billion with a term until 2026 the Consolidated Financial Statements from page 200 onward covers the repayment of outstanding commercial paper. It can also For more information on the development of the balance sheet, see the Ten-Year Summary We strive to maintain a solid A rating, which ensures unrestricted be used for general company purposes. The credit line, as well as a on page 288 access to financial and capital markets. Our financing measures are short-term credit line of €3 billion that expired in the second quarter aligned with our operational business planning as well as the com- of 2021, were not used at any point in 2021. Our external financing pany’s strategic direction and also ensure the financial flexibility to is therefore largely independent of short-term fluctuations in the take advantage of strategic options. credit markets.
BASF Report 2021 Management’s Report – Financial Position 65 Financing instruments Statement of cash flows for property, plant and equipment and intangible assets also con- Million € tributed to the decrease in cash flows from investing activities. 248 Cash flows from operating activities amounted to €7,245 million, Commercial paper compared with €5,413 million in the previous year. The considerable Cash flows from financing activities amounted to –€6,457 million. increase was primarily due to the improvement in net income, which In addition to the payment of dividends in the amount of €3,312 mil- 3,447 had included high impairments in the previous year. Accordingly, lion (2020: €3,139 million), financial and similar liabilities were 13,489 depreciation and amortization of property, plant and equipment and reduced by €3,145 million. Liabilities to banks €17,184 million Bonds and other liabilities to the capital market intangible assets was significantly below the prior-year figure in 2021, at €3,687 million. An offsetting factor was cash tied up in net Free cash flow, which remains after deducting payments made for working capital, which rose by €1,166 million to €1,566 million in property, plant and equipment and intangible assets from cash 2021. This mainly resulted from the significant increase in inventories flows from operating activities, represents the financial resources by €3,304 million due to higher business volumes and prices after a remaining after investments. It amounted to €3,713 million in 2021, BASF Group’s most important financial contracts contain no side reduction in inventories had supported operating cash flows in the after €2,284 million in the previous year. agreements with regard to specific financial ratios (financial cove- previous year. nants) or compliance with a specific rating (rating trigger). Cash of €1,272 million was tied up in receivables, €904 million less To minimize risks and leverage internal optimization potential within than in the prior year. The improvement was due in particular to the the Group, we bundle the financing, financial investments and reduction in precious metal trading exposures. Trade accounts foreign currency hedging of BASF SE’s subsidiaries within the receivable rose by €1,799 million, €805 million more than in the BASF Group where possible. Foreign currency risks are primarily previous year. By contrast, the €3,010 million rise in liabilities hedged centrally using derivative financial instruments in the market. increased operating cash flows. This was largely attributable to the increase in trade accounts payable and current provisions. This Our interest risk management generally pursues the goal of reducing effect was less pronounced in the previous year at €927 million. interest expenses for the BASF Group and limiting interest risks. Interest rate hedging transactions are therefore conducted with Miscellaneous items led to cash tied up of €398 million in 2021, after banks in order to turn selected liabilities to the capital market from cash released of €122 million in the previous year. This was due in fixed to variable interest rates or vice versa. particular to the elimination of equity-accounted income and the For more information on the financing tools and hedging instruments used, see Note 21 from reclassification of income from divestitures, including the gain on the page 251 onward and Note 26 from page 263 onward in the Notes to the Consolidated Financial disposal of the shareholding in Solenis, to cash flows from investing Statements activities. Cash flows from investing activities totaled –€2,622 million in 2021, after –€1,904 million in the previous year. Payments received for divestitures and the disposal of the shareholding in Solenis in 2021 were below the figure from the disposal of the construction chemicals business in the previous year. By contrast, payments made for acquisitions amounted to €600 million in 2021, around half the prior-year figure. The €403 million increase in payments made
BASF Report 2021 Management’s Report – Financial Position 66 Statement of cash flows Free cash flow Million € Million € 2021 2020 2021 2020 Net income 5,523 –1,060 Cash flows from operating activities 7,245 5,413 Depreciation and amortization of property, plant and equipment and intangible assets 3,687 6,751 – Payments made for property, plant 3,532 3,129 and equipment and intangible assets Changes in net working capital –1,566 –400 Free cash flow 3,713 2,284 Miscellaneous items –398 122 Cash flows from operating activities 7,245 5,413 Cash flow Payments made for property, plant and equipment and intangible assets –3,532 –3,129 Billion € Acquisitions/divestitures 430 1,280 10 Changes in financial assets and miscellaneous items 480 –55 8 Cash flows from investing activities –2,622 –1,904 6 4 Capital increases/repayments and other equity transactions − 3 2 0 Changes in financial and similar liabilities –3,145 1,580 2017 2018 2019 2020 2021 Dividends –3,312 –3,139 Cash flows from operating activities Payments made for property, plant and equipment and intangible assets Cash flows from financing activities –6,457 –1,556 Free cash flow Cash-effective changes in cash and cash equivalents –1,834 1,953 Cash and cash equivalents at the beginning of the period and other changesa 4,458 2,382 Cash and cash equivalents at the end of the yeara 2,624 4,335 a In 2021 and 2020, cash and cash equivalents presented in the statement of cash flows deviate from the figures in the balance sheet. For explanations and other disclosures on the statement of cash flows, see Note 27 to the Consolidated Financial Statements from page 277 onward.
BASF Report 2021 Management’s Report – Actual Development Compared With Outlook for 2021 67 Actual Development Compared With Outlook for 2021 Sales, earnings and ROCE forecast for the BASF Group Forecast/actual comparison We increased sales to €78.6 billion in 2021, considerably above our Sales EBIT before special items ROCE forecast at the beginning of the year of sales growth to between 2021 forecast 2021 actual 2021 forecast 2021 actual 2021 forecast 2021 actual €61 billion and €64 billion. Sales in the Surface Technologies, Chemicals Chemi cals, Industrial Solutions, Agricultural Solutions and Nutri- Materials tion & Care segments rose more strongly than initially expected. This was driven primarily by significantly higher prices, especially in the Industrial Solutions Surface Technologies and Chemicals segments. We increased sales Surface Technologies volumes as expected. Currency and portfolio effects had an off- setting impact, in line with our assumptions. Nutrition & Care Agricultural Solutions At €7.8 billion, EBIT before special items likewise significantly Other – – exceeded the forecast range of between €4.1 billion and €5.0 billion. The Industrial Solutions, Nutrition & Care and Agricultural Solutions BASF Group €61 billion– €78.6 billion €4.1 billion– €7.8 billion 8.0%–9.2%a 13.5% €64 billiona €5.0 billiona segments in particular did not develop as expected. Industrial Solu- tions increased EBIT before special items considerably, contrary to At prior-year level: no change (+/–0.0%) | Slight increase/decrease: “slight” represents a change of 0.1%–5.0% for sales; 0.1%–10.0% for earnings; 0.1 to 1.0 percentage points for ROCE the forecast of a slight decline. EBIT before special items in the | Considerable increase/decrease: “considerable” represents a change of 5.1% or higher for sales; 10.1% or higher for earnings; more than 1.0 percentage points for ROCE Agricultural Solutions and Nutrition & Care segments declined con- a We updated our outlook in April, July and October 2021. We most recently updated it in October 2021, f orecasting sales of between €76 billion and €78 billion, EBIT before special items of between €7.5 billion and €8.0 billion, and a ROCE of between 13.2% and 14.1%. siderably; in both segments, we had expected a slight improvement in earnings. We considerably increased ROCE in almost all segments. ROCE Accelerator sales and CO emissions forecast for the CO emissions amounted to 20.2 million metric tons, slightly below 2 2 increased only slightly in the Agricultural Solutions segment, while BASF Group the range we forecast in February of between 20.5 million metric the Nutrition & Care segment saw a considerable decline. Overall, tons and 21.5 million metric tons. BASF significantly increased pro- the degree of improvement exceeded our expectations: ROCE for We increased Accelerator sales to €24.1 billion in 2021, consider- duction volumes in 2021 in response to stronger demand. To reduce the BASF Group amounted to 13.5%, considerably above the range ably above the range forecast in February of between €18 billion and the additional emissions resulting from this, we made procuring we had forecast of between 8.0% and 9.2%. €19 billion. The range forecast in October – between €21.5 billion energy from renewable sources a focus. To this end, BASF converted and €22.5 billion – was likewise exceeded. This was due to the energy supply agreements, acquired renewable energy certificates We revised the outlook provided in February 2021 in April, July and BASF Group’s extremely positive business performance, which and signed long-term supply agreements for green power. A project October 2021. In October 2021, we projected sales of between was also reflected in Accelerator sales. The decline caused by the to reduce nitrous oxide emissions in Ludwigshafen, Germany, was €76 billion and €78 billion. We expected EBIT before special items divestiture of the global pigments business and the resulting outflow successfully implemented. Divestitures such as the disposal of the of €7.5 billion to €8.0 billion. For ROCE, we forecast a range of of Accelerator products only had a slight offsetting effect overall. global pigments business led to a slight decline in emissions. In 13.2% to 14.1%. addition, emissions were significantly reduced by the lower capacity utilization of the ammonia plant due to the sharp rise in natural gas prices.
BASF Report 2021 Management’s Report – Actual Development Compared With Outlook for 2021 68 Capex forecast for the BASF Group Sales in the Nutrition & Care segment were considerably above the prior-year figure, exceeding our forecast of slight growth. This was In 2021, we invested a total of €3.4 billion in capital expenditures mainly due to higher price levels, after we had assumed lower prices (capex), excluding additions from acquisitions, IT investments, res- in February. We increased volumes in both divisions as expected. toration obligations and right-of-use assets arising from leases. The EBIT before special items declined significantly in 2021, falling short figure forecast in February 2021 was €3.6 billion. - of our expectations of a slight increase. The decrease was attri butable to lower earnings contributions from both divisions. This was mainly due to lower margins as a result of higher raw materials Sales, earnings and ROCE forecast for the segments and energy prices as well as higher fixed costs, primarily from higher bonus provisions. ROCE also declined considerably in line with We considerably increased sales in the Chemicals segment in earnings development in the segment. Our forecast had assumed a 2021, after only forecasting a slight increase in sales at the begin- considerable increase. ning of the year. Both divisions raised prices, significantly exceeding the price increases assumed in February as a result of extraordinary Sales in the Agricultural Solutions segment rose considerably, not supply bottlenecks in the markets. We increased volumes as just slightly as forecast. Higher sales volumes and prices exceeded expected. The segment considerably increased EBIT before special negative currency effects to a greater extent than we had anticipated. items and ROCE, in line with the forecast. Contrary to our forecast of a slight increase, EBIT before special items was considerably below the prior-year level. The positive sales The Materials segment recorded a considerable improvement in development was unable to compensate for an increase in fixed sales, EBIT before special items and ROCE as forecast. costs, mainly from higher bonus provisions, higher raw materials prices and logistics costs, and a low-margin product mix. Based on Sales in the Industrial Solutions segment rose considerably in the development of earnings, we were only able to increase ROCE 2021, exceeding our expectations of a slight decline. This was slightly, against our assumption of a considerable increase. largely driven by volume growth. Against our assumptions, this more than compensated for the negative effects from the divestiture of the We significantly improved sales and EBIT before special items in global pigments business. The segment’s volume growth also led to Other as forecast. considerably higher EBIT before special items, contrary to our fore- For more information on our forecast for 2022, see page 148 onward cast of a slight decline. ROCE was significantly above the prior- year For more information on investments, see page 38 onward level, as expected. The Surface Technologies segment achieved significant sales growth, exceeding our forecast from February, in which we had assumed only a slight incr ease in sales. This primarily resulted from higher precious metal prices, which rose more strongly than expected. The significant recovery in EBIT before special items and ROCE materialized as expected.
BASF Report 2021 Management’s Report – Business Review by Segment 69 Business Review by Segment Segments: Chemicals Materials Industrial Solutions Surface Technologies Nutrition & Care Agricultural Solutions Segment overview Contributions to EBITDA by segment Million € Income from operations before depreciation and Income from operations (EBIT) Chemicals 33% Sales amortization (EBITDA) before special items Materials 28% 2021 2020 2021 2020 2021 2020 Industrial Solutions 12% Chemicals 13,579 8,071 3,764 1,237 2,974 445 Surface Technologies 11% Materials 15,214 10,736 3,162 1,556 2,418 835 Nutrition & Care 8% Industrial Solutions 8,876 7,644 1,344 1,099 1,006 822 Agricultural Solutions 12% Surface Technologies 22,659 16,659 1,243 900 800 484 Other –4% Nutrition & Care 6,442 6,019 967 1,152 497 773 Agricultural Solutions 8,162 7,660 1,358 1,582 715 970 Other 3,666 2,360 –484 –1,032 –643 –769 BASF Group 78,598 59,149 11,355 6,494 7,768 3,560 Income from operations (EBIT) Assets Investments including acquisitionsa Contributions to assets by segment 2021 2020 2021 2020 2021 2020 Chemicals 2,997 –192 10,369 7,896 1,157 871 Chemicals 12% Materials 2,345 –109 11,286 9,118 709 1,957 Materials 13% Industrial Solutions 965 630 6,302 6,402 361 331 Industrial Solutions 7% Surface Technologies 761 –587 13,769 11,691 1,469 585 Surface Technologies 16% Nutrition & Care 554 688 7,231 6,214 654 510 Nutrition & Care 8% Agricultural Solutions 696 582 15,305 14,840 347 459 Agricultural Solutions 18% Other –641 –1,203 23,121 24,131 183 156 Other 26% BASF Group 7,677 –191 87,383 80,292 4,881 4,869 a Additions to property, plant and equipment (of which from acquisitions: €332 million in 2021 and €559 million in 2020) and intangible assets (of which from acquisitions: €392 million in 2021 and €691 million in 2020)
BASF Report 2021 Management’s Report – Business Review by Segment 70 Salesa Contributions to total sales by segment Million € Q1 Q2 Q3 Q4 2021 2020 2021 2020 2021 2020 2021 2020 Chemicals 17% Chemicals 2,736 2,350 3,419 1,791 3,693 1,783 3,731 2,147 Materials 19% Materials 3,447 2,874 3,743 2,143 3,973 2,657 4,052 3,062 Industrial Solutions 11% Industrial Solutions 2,108 2,098 2,359 1,819 2,205 1,844 2,204 1,883 Surface Technologies 29% Surface Technologies 5,947 4,328 5,892 3,099 5,631 4,142 5,189 5,090 Nutrition & Care 8% Nutrition & Care 1,533 1,582 1,584 1,555 1,598 1,427 1,727 1,455 Agricultural Solutions 11% Agricultural Solutions 2,846 2,819 1,963 1,766 1,593 1,474 1,760 1,601 Other 5% Other 783 702 793 507 976 484 1,113 667 '17 BASF Group 19,400 16,753 19,753 12,680 19,669 13,811 19,776 15,905 '16 '15 '14 Income from operations (EBIT) before special itemsa Contributions to EBIT before special items by segment Million € Q1 Q2 Q3 Q4 2021 2020 2021 2020 2021 2020 2021 2020 Chemicals 38% Chemicals 558 174 990 –2 850 46 576 227 Materials 31% Materials 672 209 792 –80 631 217 323 489 Industrial Solutions 13% Industrial Solutions 266 273 307 163 262 186 171 200 Surface Technologies 10% Surface Technologies 360 220 289 –151 119 200 32 215 Nutrition & Care 7% Nutrition & Care 218 254 138 256 104 143 37 120 Agricultural Solutions 9% Agricultural Solutions 807 809 75 120 –90 26 –77 15 Other –8% Other –560 –299 –236 –80 –11 –237 165 –153 BASF Group 2,321 1,640 2,355 226 1,865 581 1,227 1,113 a Quarterly results not audited
BASF Report 2021 Management’s Report – Business Review by Segment 71 Income from operations (EBIT)a Contributions to EBIT by segment Million € Q1 Q2 Q3 Q4 2021 2020 2021 2020 2021 2020 2021 2020 Chemicals 39% Chemicals 605 170 981 –18 850 –504 561 160 Materials 30% Materials 648 119 762 –102 620 –546 315 420 Industrial Solutions 13% Industrial Solutions 259 240 340 133 229 78 136 179 Surface Technologies 10% Surface Technologies 356 217 289 –176 104 –803 12 175 Nutrition & Care 7% Nutrition & Care 215 244 194 255 105 86 40 103 Agricultural Solutions 9% Agricultural Solutions 804 787 35 95 –44 –304 –99 4 Other –8% Other –576 –321 –285 –128 –42 –645 262 –109 BASF Group 2,311 1,456 2,316 59 1,822 –2,638 1,227 932 a Quarterly results not audited
BASF Report 2021 Management’s Report – Chemicals 72 Chemicals The Chemicals segment consists of the Petrochemicals and Intermediates divisions. It supplies the other segments with basic chemicals and intermediates, contributing to the organic growth of our key value chains. Alongside internal transfers, our customers mainly come from the chemical and plastics industries. We aim to further expand our competi- tiveness through technological leadership and operational excellence. For more information on the Chemicals segment’s business model, see page 33 onward Electrically heated steam cracker furnace We have signed an agreement with SABIC and Linde to develop and pilot electrically heated steam cracker furnaces. Together, we developed concepts to replace the Sales fossil fuels used in the heating process with renewable €13,579 million energy. We want to make a significant contribution to reducing carbon emissions in the chemical industry with this 2020 €8,071 million innovative and promising solution. If energy from renewable sources is used, the new technology has the potential to EBIT before special items almost completely avoid CO emissions. 2 €2,974 million Discover our carbon management at basf.com/carbon-management 2020: €445 million
BASF Report 2021 Management’s Report – Chemicals 73 Business review Segment data – Chemicals Million € At a glance 2021 2020 +/– Sales to third parties 13,579 8,071 68.2% ▪ Sales rise 68.2% to €13,579 million, mainly due to higher prices of which Petrochemicals 9,674 5,426 78.3% ▪ EBIT before special items improves by 568.3% to €2,974 million Intermediates 3,904 2,645 47.6% Intersegment transfers 4,269 2,861 49.2% Sales including transfers 17,848 10,932 63.3% At €13,579 million, sales to third parties in the Chemicals segment were €5,508 million above the prior-year figure in 2021. Both divi- Income from operations before depreciation, amortization and special items 3,724 1,305 185.4% sions contributed to the increase with considerable sales growth. Income from operations before depreciation and amortization (EBITDA) 3,764 1,237 204.3% The Petrochemicals division increased sales by €4,248 million to EBITDA margin % 27.7 15.3 − €9,674 million, while sales in the Intermediates division rose by Depreciation and amortizationa 767 1,429 –46.3% €1,259 million to €3,904 million. Income from operations (EBIT) 2,997 –192 . Factors influencing sales – Chemicals Special items 23 –637 . EBIT before special items 2,974 445 568.3% Chemicals Petrochemicals Intermediates Return on capital employed (ROCE) % 32.9 –2.2 − Volumes 9.6% 10.5% 7.9% Assets 10,369 7,896 31.3% Prices 61.2% 71.5% 40.2% Investments including acquisitionsb 1,157 871 32.9% Portfolio –0.7% –1.0% 0.0% Research and development expenses 97 96 1.1% Currencies –1.9% –2.6% –0.4% a Depreciation and amortization of property, plant and equipment and intangible assets (including impairments and reversals of impairments) b Additions to property, plant and equipment and intangible assets Sales 68.2% 78.3% 47.6% Sales performance was mainly driven by significantly higher price Intermediates division increased volumes primarily in the butanediol Chemicals – sales levels. This was largely due to strong demand alongside low prod- and derivatives business and in the acids and polyalcohols busi- By division uct availability, mainly caused by extreme weather conditions such ness. The amines business in Europe also posted significant volume as Winter Storm Uri in North America, supply chain disruptions, as growth. In the previous year, volume development was significantly well as significantly higher feedstock and energy costs. As a result, weighed down by the impact of the coronavirus pandemic and the €9,674 million €3,904 million the Petrochemicals division increased prices in all business areas, unplanned outage of the steam cracker in Port Arthur, Texas. Petrochemicals €13,579 million Intermediates especially for steam cracker products, styrene monomers and along Share of sales: 71% Share of sales: 29% the entire propylene value chain. The Intermediates division raised Sales growth was curbed by negative currency effects, mainly prices in the butanediol and derivatives business in particular, as relating to the U.S. dollar. well as in the acids and polyalcohols business. Sales development was slightly dampened by portfolio effects in Sales growth was supported by a significant increase in volumes the Petrochemicals division from the disposal of our share in the due to strong demand. Volumes in the Petrochemicals division condensate splitter in Port Arthur, Texas, to Total Petrochemi- grew mainly in steam cracker products and styrene monomers. The cals & Refining USA, Inc.
BASF Report 2021 Management’s Report – Chemicals 74 Compared with 2020, income from operations (EBIT) before Division sales by region special items rose by €2,529 million to €2,974 million as a result (Location of customer) of considerable earnings growth in both divisions. In both the Divisions South America, Total Europe North America Asia Pacific Africa, Middle East (million €) Petrochemicals and Intermediates divisions, this was primarily Petrochemicals 56% 28% 11% 5% 9,674 attributable to significantly higher margins, higher sales volumes and improved income from investments accounted for using the Intermediates 37% 15% 45% 3% 3,904 equity method. EBIT amounted to €2,997 million, an improvement of €3,189 mil- Division, products, applications lion compared with the previous year. This included special income Products Customer industries and applications from the disposal of our share in the condensate splitter in the first Petrochemicals Ethylene, propylene, butadiene, benzene, alcohols, solvents, Chemical, plastics, construction, detergent, hygiene, automotive, packaging quarter of 2021. In the previous year, special items were mainly plasticizers, alkylene oxides, glycols, acrylic monomers, styrene and textile industries; production of paints, coatings, cosmetics, oilfield and impacted by impairments. and polystyrene, styrenic foams, superabsorbents paper chemicals For the outlook for 2022, see page 148 onward Use in the BASF Verbund Intermediates Basic products: butanediol and derivatives, alkylamines and Chemical, plastics, coatings, construction, automotive, wind energy, alkanolamines, neopentyl glycol, formic and propionic acid pharmaceutical and agricultural industries; production of detergents and cleaners as well as crop protection products and textile fibers Specialties: Specialty amines such as tertiary butylamine and polyetheramine, gas treatment chemicals, vinyl monomers, acid Use in the BASF Verbund chlorides, chloroformates, chiral intermediates
BASF Report 2021 Management’s Report – Chemicals 75 Production capacities of selected products in the regionsa Annual capacity Product South America, Europe North America Asia Pacific Africa, Middle East (metric tons) Acrylic acid • • • • 1,510,000 Alkylamines • • • 250,000 Formic acid • • • 305,000 Benzene • • • 910,000 Butadiene • • • 680,000 Butanediol equivalents • • • 550,000 Ethanolamines and derivatives • • 440,000 Ethylene • • • 3,480,000 Ethylene oxide • • • 1,445,000 Neopentylglycol • • • 255,000 Oxo-C4 alcohols (calculated as butyraldehyde) • • • 1,625,000 PolyTHF® • • • 350,000 Propionic acid • • 180,000 Propylene • • • 2,630,000 Styropor® ® • • /Neopor 545,000 Superabsorbents • • • • 565,000 Plasticizers • • 595,000 a All capacities are included at 100%, including plants belonging to joint operations and joint ventures.
BASF Report 2021 Management’s Report – Materials 76 Materials The Materials segment comprises the Performance Materials and Monomers divisions. The segment’s portfolio comprises advanced materials and their precursors for new applications and systems such as isocyanates, polyamides and inorganic basic products as well as specialties for the plastics and plastics processing industries. We aim to grow mainly orga- nically, differentiate ourselves from our competitors through specific technology expertise, industry knowledge and customer proximity, and create maximum value in the iso- cyanate and polyamide value chains. For more information on the Materials segment’s business model, see page 33 onward ® Haptex ® Haptex is a more environmentally friendly, water-soluble polyurethane solution used in the pro- Sales duction of synthetic leather. Among other things, Haptex®’s solvent-free production process cuts €15,214 million greenhouse gas emissions by around 50%. It also reduces energy consumption by more than ® offers a wide range 20% per kilo of chemicals in synthetic leather production. Moreover, Haptex 2020: €10,736 million of applications and meets the demand for products that are eco-conscious, durable and high ® quality. BASF expects to grow faster than the market for solvent-based products with Haptex . EBIT before special items The company aims to achieve annual growth of more than 50% with the product by 2025. €2,418 million ® Discover Haptex at basf.com/haptex 2020: €835 million
BASF Report 2021 Management’s Report – Materials 77 Business review Segment data – Materials Million € At a glance 2021 2020 +/– Sales to third parties 15,214 10,736 41.7% ▪ Sales growth of 41.7% to €15,214 million, mainly driven by of which Performance Materials 7,292 5,635 29.4% higher prices Monomers 7,922 5,101 55.3% ▪ EBIT before special items of €2,418 million; considerable Intersegment transfers 1,250 720 73.6% increase as a result of higher earnings in both divisions Sales including transfers 16,464 11,456 43.7% Income from operations before depreciation, amortization and special items 3,208 1,714 87.2% The Materials segment increased sales to third parties by Income from operations before depreciation and amortization (EBITDA) 3,162 1,556 103.2% €4,478 million year on year to €15,214 million in 2021. This was due EBITDA margin % 20.8 14.5 − to considerable sales growth in both divisions. The Monomers Depreciation and amortizationa 817 1,665 –50.9% division increased sales by €2,821 million to €7,922 million. At Income from operations (EBIT) 2,345 –109 . €7,292 million, sales in the Performance Materials division were Special items –73 –944 92.3% €1,657 million above the prior-year figure. EBIT before special items 2,418 835 189.6% Factors influencing sales – Materials Return on capital employed (ROCE) % 22.8 –1.1 − Assets 11,286 9,118 23.8% Performance Materials Materials Monomers Investments including acquisitionsb 709 1,957 –63.8% Volumes 12.0% 14.1% 9.6% Research and development expenses 193 182 6.1% Prices 30.0% 16.2% 45.2% a Depreciation and amortization of property, plant and equipment and intangible assets (including impairments and reversals of impairments) b Additions to property, plant and equipment and intangible assets Portfolio 0.7% 0.6% 0.9% Currencies –0.9% –1.5% –0.3% Sales 41.7% 29.4% 55.3% Volumes rose significantly as a result of strong demand and contrib- Portfolio effects from the acquisition of the integrated polyamide uted to sales growth. The Performance Materials division recorded business from Solvay, which closed as of January 31, 2020, had a higher sales volumes in the transportation and consumer goods slightly positive impact on sales. Sales growth was due mainly to significantly higher prices resulting industries, especially in Asia Pacific and Europe. In the second half from strong demand alongside low product availability and increased of 2021, volume development was however negatively impacted Currency effects, primarily relating to the U.S. dollar, had a slightly prices for raw materials. Production and supply chain disruptions by the semiconductor shortage in the automotive market and the negative impact on sales development in both divisions. associated with extreme weather conditions and raw material short- resulting production outages. Overall, sales volumes in the con- ages negatively impacted product market availability. The Mono- struction industry were slightly above the prior-year level. Higher mers division achieved higher prices primarily in isocyanates and volumes in Europe more than compensated for lower volumes in polyamides, while the Performance Materials division raised price North America. The Monomers division increased volumes, espe- levels mainly in polyurethane systems and engineering plastics. cially of polyamide 6.6 following the slight recovery in automotive production in 2021 after the weak prior year due to the pandemic. Sales volumes of methylene diphenyl diisocyanate (MDI) were also higher.
BASF Report 2021 Management’s Report – Materials 78 r Materials – sales Division sales by region By division (Location of customer) Divisions South America, Total Europe North America Asia Pacific Africa, Middle East (million €) Performance Materials 36% 20% 39% 5% 7,292 €7,292 million €7,922 million Monomers 47% 19% 29% 5% 7,922 Performance Materials €15,214 million Monomers Share of sales: 48% Share of sales: 52% Division, products, applications Products Customer industries and applications Performance Materials Engineering plastics, biodegradable plastics, foam specialties, Automotive manufacture, electrical engineering, packaging, games, sports Income from operations (EBIT) before special items rose by polyurethanes and leisure, household, mechanical engineering, construction, agriculture, €1,583 million compared with 2020 to €2,418 million. Both divi- medical technology, sanitation and water industry, solar thermal energy and photovoltaics sions considerably increased EBIT before special items. Earnings Monomers Isocyanates (MDI, TDI), ammonia, caprolactam, adipic acid, Industries such as plastics, woodworking, furniture, packaging, textile, growth in the Monomers division was primarily due to higher mar- chlorine, urea, glues and impregnating resins, caustic soda, construction and automotive gins in isocyanates and polyamides. In the Performance Materials polyamides 6 and 6.6, standard alcoholates, sulfuric and nitric acid Use in the BASF Verbund division, EBIT before special items was above the prior-year level, mainly driven by positive volume development. Production capacities of selected products in the regionsa EBIT rose by €2,454 million year on year to €2,345 million. Special Annual capacity items amounted to –€73 million in 2021, after –€944 million in Product South America, Europe North America Asia Pacific Africa, Middle East (metric tons) 2020. The special charges in the previous year were primarily attributable to impairments. Ammonia • • 1,765,000 For the outlook for 2022, see page 148 onward Chlorine • 595,000 Urea • 545,000 Isocyanates • • • 2,620,000 Polyamides 6 and 6.6 • • • 925,000 Polyamide precursors • • • 1,420,000 Propylene • 675,000 Sulfuric acid • 920,000 a All capacities are included at 100%, including plants belonging to joint operations and joint ventures.
BASF Report 2021 Management’s Report – Industrial Solutions 79 Industrial Solutions The Industrial Solutions segment consists of the Disper- sions & Resins and the Performance Chemicals divisions. It develops and markets ingredients and additives for industrial applications, such as fuel and lubricant solutions, polymer dispersions, resins, electronic materials, antioxidants, light stabilizers, oilfield chemicals, and mineral processing and hydrometallurgical chemicals. We aim to grow organically in key industries such as automotive, plastics, electronics, and energy and resources, and expand our position by leverag ing our comprehensive industry expertise and application know-how. For more information on the Industrial Solutions segment’s business model, see page 33 onward ® acResin for more sustainable self-adhesives ® acResin is a high-performance UV-curable hotmelt made of 100% acrylic. We want to play a key role in making the self-adhesives market more sustainable with this product, which is why we have steadily ® expanded the range of applications for acResin and plan to continue to do so in the future. An eco- efficiency analysis certified by TÜV, an independent testing services provider, showed that compared ® with traditional solvent-based adhesives, acResin Sales enables a significant reduction in CO emissions of 2 €8,876 million around 60%. Due to the consistent rise in market demand and range of applications, BASF expects 2020: €7,644 million to continue to grow by around 8% annually with ® EBIT before special items acResin until 2026. €1,006 million ® Discover acResin at basf.com/acresin 2020: €822 million
BASF Report 2021 Management’s Report – Industrial Solutions 80 Business review Segment data – Industrial Solutions Million € At a glance 2021 2020 +/– Sales to third parties 8,876 7,644 16.1% ▪ Sales of € 8,876 million; considerable growth mainly driven by of which Dispersions & Resins 5,681 4,869 16.7% higher volumes and prices Performance Chemicals 3,195 2,775 15.1% ▪ Considerable increase in EBIT before special items to Intersegment transfers 420 375 11.9% €1 ,006 million Sales including transfers 9,296 8,019 15.9% Income from operations before depreciation, amortization and special items 1,343 1,189 13.0% Sales to third parties in the Industrial Solutions segment rose Income from operations before depreciation and amortization (EBITDA) 1,344 1,099 22.3% by €1,232 million year on year to €8,876 million in 2021. This was EBITDA margin % 15.1 14.4 − attributable to considerably higher sales in both divisions. The Depreciation and amortizationa 380 469 –19.0% Dispersions & Resins division increased sales by €812 million to Income from operations (EBIT) 965 630 53.1% €5,681 million. Sales in the Performance Chemicals division Special items –42 –192 78.4% amounted to €3,195 million, €420 million above the prior-year figure. EBIT before special items 1,006 822 22.4% Return on capital employed (ROCE) % 15.2 9.3 − Sales influences – Industrial Solutions Assets 6,302 6,402 –1.6% Investments including acquisitionsb 361 331 9.1% Industrial Dispersions & Performance Solutions Resins Chemicals Research and development expenses 175 177 –1.1% Volumes 11.4% 11.4% 11.5% a Depreciation and amortization of property, plant and equipment and intangible assets (including impairments and reversals of impairments) b Additions to property, plant and equipment and intangible assets Prices 11.2% 14.5% 5.4% Portfolio –5.0% –7.9% 0.0% Currencies –1.5% –1.3% –1.8% Portfolio effects in the Dispersions & Resins division following the Industrial Solutions – sales disposal of the global pigments business as of June 30, 2021, had By division Sales 16.1% 16.7% 15.1% an offsetting impact. The positive sales performance was attributable to higher volumes Sales were also reduced by slightly negative currency effects in both €5,681 million €3,195 million and prices in both divisions. The increase in sales volumes mainly divisions, mainly relating to the U.S. dollar. Dispersions & Resins €8,876 million Performance Chemicals resulted from the global economic recovery from the coronavirus Share of sales: 64% Share of sales: 36% pandemic. Volume growth in the Dispersions & Resins division was mainly driven by the dispersions business. The Performance Chemi- cals division recorded higher sales volumes in all business areas. The higher price level was driven primarily by increased raw materi- als prices. Both divisions raised prices in almost all business areas and all regions.
BASF Report 2021 Management’s Report – Industrial Solutions 81 Income from operations (EBIT) before special items rose consid- Division sales by region erably compared with 2020. This was attributable to considerably (Location of customer) higher EBIT before special items in the Dispersions & Resins division, Divisions South America, Total Europe North America Asia Pacific Africa, Middle East (million €) mainly as a result of volume growth. Dispersions & Resins 40% 24% 30% 6% 5,681 By contrast, EBIT before special items declined slightly in the Perfor- Performance Chemicals 40% 23% 27% 10% 3,195 mance Chemicals division. This was primarily due to the increase in fixed costs mainly from higher bonus provisions, lower margins due Division, products, applications to higher raw materials prices, and negative currency effects. This Products Customer industries and applications could not be offset by the division’s positive volume performance. Dispersions & Resins Polymer dispersions, resins, additives, electronic materials Coatings, construction, paper, printing and packaging, adhesives and electronics industries At €965 million, EBIT was €335 million above the prior-year figure. Performance Chemicals Antioxidants, light stabilizers and flame retardants for plastic Chemicals, plastics, consumer goods, automotive and transportation Special items amounted to –€42 million in 2021 after –€192 million applications industries, as well as energy and resources in 2020. Special charges in the previous year related mainly to the Fuel and refinery additives, polyisobutene, brake fluids and engine carve-out of the pigments business and impairments. coolants, lubricant additives and basestocks, components for metalworking fluids and compounded lubricants For the outlook for 2022, see page 148 onward Process chemicals for the extraction of oil, gas, metals and minerals; chemicals for enhanced oil recovery Kaolin minerals Production capacities of selected products in the regionsa Annual capacity Product South America, Europe North America Asia Pacific Africa, Middle East (metric tons) Acrylics dispersions • • • • 1,783,000 Formulation additives • • • 67,000 Polyisobutene • • 265,000 a All capacities are included at 100%, including plants belonging to joint operations and joint ventures.
BASF Report 2021 Management’s Report – Surface Technologies 82 Surface Technologies The Surface Technologies segment comprises the Catalysts and Coatings divisions, which offer chemical solutions for surfaces. Its portfolio serves industries such as the auto- motive and chemical sectors and includes automotive OEM and refinish coatings, surface treatment, catalysts, battery materials, and precious and base metal services. We improve our customers’ applications and processes with tailored products, technologies and solutions, and support them through geographical proximity across all regions. The aim is to drive BASF’s growth by leveraging our portfolio of technologies and expanding our position as a leading and innovative provider of battery materials and surface coatings solutions. For more information on the Surface Technologies segment’s business model, see page 33 onward Tri-Metal Catalyst technology BASF’s innovative Tri-Metal Catalyst tech- nology enables the partial substitution of palladium with platinum in production pro- cesses. Although slightly more palladium is produced every year than platinum, demand for palladium is currently around three times higher. Tri-Metal Catalysts help Sales to reduce costs for automotive manu fac- €22,659 million turers and partially alleviate deficits in the platinum metals market. With this tech- 2020: €16,659 million nology, BASF expects to expand its market share and anticipates a total annual sales EBIT before special items potential of around €175 million by 2026. €800 million Discover Tri-Metal Catalysts at catalysts.basf.com 2020: €484 million
BASF Report 2021 Management’s Report – Surface Technologies 83 Business review Segment data – Surface Technologies Million € At a glance 2021 2020 +/– Sales to third parties 22,659 16,659 36.0% ▪ Sales growth of 36.0% to €22,659 million, mainly as a result of of which Catalysts 19,219 13,570 41.6% significantly higher precious metal prices Coatings 3,440 3,089 11.4% ▪ EBIT before special items rises 65.3% to €800 million due to Intersegment transfers 171 203 –15.7% increase in the Catalysts division Sales including transfers 22,831 16,862 35.4% Income from operations before depreciation, amortization and special items 1,277 966 32.2% Sales to third parties in the Surface Technologies segment rose by Income from operations before depreciation and amortization (EBITDA) 1,243 900 38.1% €6,000 million compared with the previous year to €22,659 million. EBITDA margin % 5.5 5.4 − Both divisions contributed to the increase. The Catalysts division Depreciation and amortizationa 483 1,487 –67.6% recorded sales growth of €5,649 million to €19,219 million. The Income from operations (EBIT) 761 –587 . . Coatings division increased sales by €351 million year on year to Special items –39 –1,071 96.3% €3,440 million. EBIT before special items 800 484 65.3% Factors influencing sales – Surface Technologies Return on capital employed (ROCE) % 5.6 –4.8 − Assets 13,769 11,691 17.8% Surface Investments including acquisitionsb 1,469 585 151.2% Technologies Catalysts Coatings Volumes 12.2% 12.5% 10.7% Research and development expenses 296 246 20.4% Prices 25.3% 30.4% 3.2% a Depreciation and amortization of property, plant and equipment and intangible assets (including impairments and reversals of impairments) b Additions to property, plant and equipment and intangible assets Portfolio 2.1% 2.6% –0.1% Currencies –3.6% –3.9% –2.4% ongoing shortage of semiconductors in the automotive market and Surface Technologies – sales Sales 36.0% 41.6% 11.4% production and supply chain disruptions. By division Sales growth was driven by the strong increase in precious metal Portfolio effects in the Catalysts division following the acquisition of prices in the Catalysts division. This also led to considerably higher our majority shareholding in BASF Shanshan Battery Materials sales in precious metal trading, at €10,376 million (2020: €7,612 mil- Co., Ltd. had a slightly positive impact on sales. €19,219 million €3,440 million lion). The Coatings division recorded slightly higher prices in all Catalysts €22,659 million Coatings Share of sales: 85% Share of sales: 15% business areas. Sales performance was weighed down by negative currency effects, mainly relating to the U.S. dollar. Considerably higher sales volumes on the back of the global economic recovery from the coronavirus pandemic and following stronger demand also contributed to the positive sales develop- ment. Both divisions increased volumes in all business areas. Volume development in the segment was dampened by the
BASF Report 2021 Management’s Report – Surface Technologies 84 At €800 million, income from operations (EBIT) before special Division sales by region items was €316 million above the 2020 figure due to considerably (Location of customer) higher earnings in the Catalysts division. This was driven by growth Divisions South America, Total Europe North America Asia Pacific Africa, Middle East (million €) in sales volumes and the considerably higher earnings contribution Catalysts 29% 34% 33% 4% 19,219 from precious metal trading. Coatings 33% 23% 29% 15% 3,440 EBIT before special items in the Coatings division declined con- siderably compared with the previous year. The significant rise in volumes was unable to compensate for higher fixed costs, primarily Division, products, applications from higher bonus provisions, and a weaker margin due to increased Products Customer industries and applications raw materials prices. Catalysts Automotive catalysts, process catalysts and technologies, Automotive, chemical and pharmaceutical industries, refineries, battery battery materials, precious and base metal services manufacturers, solutions for the protection of air quality as well as the production EBIT rose by €1,348 million to €761 million. In 2021, we recorded of fuels, chemicals, plastics and battery materials, battery material recycling special items of –€39 million after –€1,071 million in 2020, mainly in Coatings Coatings solutions for automotive applications, technology and Automotive industry, body shops, steel industry, aviation, aluminum applications connection with special charges for impairments. system solutions for surface treatments, decorative paints in the architecture and construction industries, household appliances, painting businesses and private consumers For the outlook for 2022, see page 148 onward
BASF Report 2021 Management’s Report – Nutrition & Care 85 Nutrition & Care D’lite In the Nutrition & Care segment, consisting of the Care Keeping on top of rapidly changing consumer trends in a fast-moving cosmetics market is a major Chemicals and Nutrition & Health divisions, we serve the challenge for traditional market analyses and product development processes. BASF developed a new growing and increasingly sophisticated demands for fast- digital platform to address precisely this: D’lite helps customers to identify the best cosmetic offerings and moving consumer goods. Our customers include food and ingredients. This service combines the Care Chemicals division’s industry knowledge with a wide range of feed producers as well as the pharmaceutical, cosmetics, data from multiple internal and external sources, including analyses of social media sites, blogs, forums detergent and cleaner industries. We also offer solutions for and review portals. D’lite supports BASF’s customers along the entire product development chain – from technical applications and for crop protection and nutrition. consumer and market understanding, concept and strategy development to formulation design – and We strive to expand our position as a leading provider of enables them to speed up the formulation process by up to 50%. ingredients and solutions for consumer goods in the areas of nutrition, home and personal care. Our goal is to drive Discover D’lite at dlite-global.basf.com organic growth. We focus on emerging markets, new busi- ness models and sustainability trends in consumer markets, supported by acquisitions. For more information on the Nutrition & Care segment’s business model, see page 33 onward Sales €6,442 million 2020: €6,019 million EBIT before special items €497 million 2020: €773 million
BASF Report 2021 Management’s Report – Nutrition & Care 86 Business review Segment data – Nutrition & Care Million € At a glance 2021 2020 +/– Sales to third parties 6,442 6,019 7.0% ▪ Sales growth of €423 million to €6,442 million due to higher of which Care Chemicals 4,439 3,989 11.3% volumes and raised prices Nutrition & Health 2,003 2,030 –1.3% ▪ EBIT before special items declines €276 million to €497 million Intersegment transfers 491 429 14.4% as a result of lower contributions from both divisions Sales including transfers 6,933 6,448 7.5% Income from operations before depreciation, amortization and special items 909 1,190 –23.6% Sales to third parties in the Nutrition & Care segment rose by Income from operations before depreciation and amortization (EBITDA) 967 1,152 –16.0% €423 million year on year to €6,442 million in 2021. This was attri- EBITDA margin % 15.0 19.1 − butable to the Care Chemicals division, which recorded sales growth a Depreciation and amortization 413 464 –10.9% of €450 million to €4,439 million. By contrast, in the Nutrition & Health Income from operations (EBIT) 554 688 –19.5% division, sales declined by €27 million compared with 2020 to Special items 57 –85 . €2,003 million. EBIT before special items 497 773 –35.7% Factors influencing sales – Nutrition & Care Return on capital employed (ROCE) % 8.2 10.6 − Assets 7,231 6,214 16.4% Nutrition & Care Care Chemicals Nutrition & Health Investments including acquisitionsb 654 510 28.3% Volumes 5.7% 6.9% 3.2% Research and development expenses 172 160 7.7% Prices 4.5% 7.4% –1.2% a Depreciation and amortization of property, plant and equipment and intangible assets (including impairments and reversals of impairments) Portfolio –1.3% –1.2% –1.5% b Additions to property, plant and equipment and intangible assets Currencies –1.9% –1.9% –1.8% Sales 7.0% 11.3% –1.3% home care, industrial and institutional cleaning and industrial Nutrition & Care – sales formulators business, mainly as a result of higher raw materials By division The sales increase at segment level was primarily due to higher prices. This more than compensated for slightly lower prices in the volumes. The Care Chemicals division increased its volumes mainly Nutrition & Health division. in the home care, industrial and institutional cleaning and industrial €4,439 million €2,003 million formulators business and in the personal care solutions business. Slightly negative currency effects, mainly relating to the U.S. dollar, Care Chemicals €6,442 million Nutrition & Health Volumes rose slightly in the Nutrition & Health division, especially in had an offsetting effect. Share of sales: 69% Share of sales: 31% the pharmaceutical and aroma ingredients businesses. This more than compensated for reduced volumes due to the lower availability Portfolio effects from the sale of the production site in Kankakee, of vitamin A. Illinois, had a negative impact on sales in both divisions. Sales were positively impacted by higher prices overall due to signifi- cantly higher price levels in the Care Chemicals division, especially in the oleo surfactants and fatty alcohols business as well as in the
BASF Report 2021 Management’s Report – Nutrition & Care 87 Compared with the prior-year figure, income from operations Division sales by region (EBIT) before special items declined by €276 million to €497 mil- (Location of customer) lion due to lower earnings contributions from both divisions. The Divisions South America, Total Europe North America Asia Pacific Africa, Middle East (million €) decline in earnings in the Nutrition & Health division resulted from Care Chemicals 53% 18% 20% 9% 4,439 lower margins, driven by higher prices for raw materials and energy, the lower availability of vitamin A, and higher fixed costs, primarily Nutrition & Health 37% 18% 35% 10% 2,003 from higher bonus provisions. EBIT before special items in the Care Chemicals division decreased due mainly to higher fixed costs, largely as a result of higher bonus provisions. Division, products, applications Products Customer industries and applications EBIT declined by €134 million year on year to €554 million. It Care Chemicals Ingredients for skin and hair cleansing and care products, such as Cosmetics, detergent and cleaner industry, agrochemical industry, technical included special income from the sale of the production site in emollients, cosmetic active ingredients, polymers and UV filters applications for various industries Kankakee, Illinois, in the second quarter of 2021. In the previous Ingredients for detergents and cleaners in household, institution or year, EBIT included special charges, mainly for impairments and industry, such as surfactants, enzymes, chelating agents, water- provisions, primarily for the optimization of production structures in soluble polymers, biocides and products for optical effects the Nutrition & Health division. Chemical ingredients and processing additives, for example for crop protection, excipients for chemical processes such as emulsion For the outlook for 2022, see page 148 onward polymerization, metal surface treatments or textile processing, as well as products for concrete additives, biofuels and other industrial applications Nutrition & Health Additives for the food and feed industries, such as vitamins, Food and feed industries, flavor and fragrance industry, pharmaceutical carotenoids, sterols, enzymes, emulsifiers, omega-3 fatty acids industry and bioethanol industry Industrial enzymes for bioethanol and food production, natural and synthetic flavors and fragrances, such as citral, geraniol, citronellol, ® L-menthol and linalool, Isobionics Santalol, valencene and nootkatone Excipients for the pharmaceutical industry and selected, high-volume active pharmaceutical ingredients, such as ibuprofen and omega-3 fatty acids Production capacities of selected products in the regionsa Annual capacity Product South America, Europe North America Asia Pacific Africa, Middle East (metric tons) Anionic surfactants • • • • 550,000 Citral • • 78,000 Chelating agents • • • 170,000 Methane sulfonic acid • 30,000 Nonionic surfactants • • • 650,000 a All capacities are included at 100%, including plants belonging to joint operations and joint ventures.
BASF Report 2021 Management’s Report – Agricultural Solutions 88 Agricultural Solutions ® Luximo : novel In the Agricultural Solutions segment, we aim to further herbicide active strengthen our market position as an integrated provider. Our ingredient offer comprises seeds and seed treatment products, as well as fungicides, herbicides, insecticides and biological solu- ® Luximo controls a broad range of tions, complemented by digital products to help farmers resistant and difficult-to-control grass achieve better yield. Our strategy is based on innovation- weeds in wheat and other cereal crops. driven organic growth and targeted portfolio expansion It is the first herbicide since 1985 to through acquisitions. Customer needs, societal expectations receive a new mode of action classifi- and reducing environmental impacts are what motivate us to cation from the global industry organi- innovate. zation HRAC.* With more than 50% For more information on the Agricultural Solutions segment’s business model, see page 33 onward carbon content of the active ingredient coming from renewable sources and no known cross-resistance, Luximo® offers farmers in Australia and, in the future, in the E.U. and U.K. a new solu- tion for sustainable weed resistance management. We anticipate a peak 1 sales potential for this product in the low three-digit million euro range. Discover Luximo® at basf.com/luximo Sales €8,162 million 2020: €7,660 million EBIT before special items €715 million 2020: €970 million * Herbicide Resistance Action Committee 1 Peak sales describes the highest sales value to be expected in one year. For more information, see the Glossary on page 289.
BASF Report 2021 Management’s Report – Agricultural Solutions 89 Business review Segment data – Agricultural Solutions Million € At a glance 2021 2020 +/– Sales to third parties 8,162 7,660 6.6% ▪ Sales above prior-year level at €8,162 million due to volume Intersegment transfers 40 91 –56.5% growth and higher prices Sales including transfers 8,202 7,751 5.8% ▪ EBIT before special items of €715 million, 26.3% below 2020 Income from operations before depreciation, amortization and special items 1,375 1,680 –18.2% figure, mainly from higher costs and negative currency effects Income from operations before depreciation and amortization (EBITDA) 1,358 1,582 –14.2% EBITDA margin % 16.6 20.7 − a At €8,162 million, sales to third parties in the Agricultural Solutions Depreciation and amortization 662 1,000 –33.8% segment were €502 million above the prior-year level in 2021. The Income from operations (EBIT) 696 582 19.6% main drivers were higher volumes in all regions and higher prices. Special items –19 –388 95.1% Negative currency effects had an offsetting impact. EBIT before special items 715 970 –26.3% Factors influencing sales – Agricultural Solutions Return on capital employed (ROCE) % 4.5 3.6 − Assets 15,305 14,840 3.1% Volumes 8.1% Investments including acquisitionsb 347 459 –24.3% Prices 2.5% Research and development expenses 904 840 7.7% Portfolio – Currencies –4.0% a Depreciation and amortization of property, plant and equipment and intangible assets (including impairments and reversals of impairments) b Additions to property, plant and equipment and intangible assets Sales 6.6% In Europe, sales rose by €93 million year on year to €2,128 million. Sales in the region South America, Africa, Middle East amounted Agricultural Solutions – sales This was primarily attributable to higher volumes, especially in fungi- to €1,990 million, €213 million above the previous year, and were By indication and sector cides and herbicides. Slightly higher prices contributed to sales driven by significantly higher price levels and considerable volume €1,641 million performance. Sales were reduced by negative currency effects, growth in all sectors, especially in Brazil. This more than offset €2,449 million Seeds & Traits Fungicides mainly in eastern Europe and Turkey. negative currency effects, especially in Argentina and Brazil. Share of sales: 20% Share of sales: 30% €620 million €8,162 million Sales in North America rose by €81 million to €3,085 million. Higher Seed Treatment sales volumes, especially for herbicides, more than compensated Share of sales: 8% €2,526 million for negative currency effects and slightly lower prices. €926 million Herbicides Insecticides Share of sales: 31% Share of sales: 11% In Asia, we increased sales by €114 million to €958 million. This was mainly due to higher sales volumes, especially in fungicides and insecticides, primarily in China. Slightly higher price levels contrib- uted to the positive sales development, while negative currency effects had a dampening impact.
BASF Report 2021 Management’s Report – Agricultural Solutions 90 At €715 million, income from operations (EBIT) before special EBIT amounted to €696 million, €114 million higher than in the Good to know items was €255 million below the 2020 figure. This was primarily previous year. This figure included special income from the sale of attributable to significantly higher fixed costs, mainly from much non-capitalized know-how. Special charges in connection with We are committed to sustainable farming and focus on four areas to higher bonus provisions, significantly higher raw materials prices streamlining the global glufosinate-ammonium production network help farmers not only produce more, but also better. and logistics costs, and a low-margin product mix. Earnings were had an offsetting effect but were well below the special charges Climate-smart farming: We help farmers tackle pressing climate also weighed down by negative currency effects. incurred in the previous year. challenges with the right combination of technologies designed to For the outlook for 2022, see page 148 onward increase yield, make farm management easier and more effective, and reduce the impact on the environment. Our technologies include nitrogen management products to improve fertilizer efficiency and lower greenhouse gas emissions, no-till herbicides, seeds and traits Agricultural Solutions sales by region for more stress-resilient crops, digital solutions and bacteria that (Location of customer) Division South America, Total improve nitrogen availability to plants. Europe North America Asia Pacific Africa, Middle East (million €) Sustainable solutions: We systematically steer our innovation Agricultural Solutions 26% 38% 12% 24% 8,162 pipeline according to sustainability criteria from an early stage on. This enables us to continually develop innovations that offer added value for farmers, the environment and society. We also assess each Products and applications product in our existing portfolio with respect to its contribution to Indications and sectors Applications Selected products sustainability. In this way, we systematically steer our portfolio to annually increase the sales share from solutions that make a sub- ® ® Fungicides Protecting crops against harmful fungal diseases; improving plant health, Boscalid, dimethomorph, F500 , Initium , metiram, securing yield and harvest quality with chemical and biological solutions ® ® ® stantial sustainability contribution. metrafenone, Revysol , Serifel , Xemium ® ® ® Herbicides Reducing competition from weeds for nutrients, water and sunlight to secure Basta , dimethenamid-p, Engenia , Finale , imazamox, Digital farming: Digitalization has the power to transform agriculture ® ® ® yield and harvest quality Kixor , Liberty , pendimethalin, Tirexor , topramezone and make it more efficient and sustainable. Our digital solutions help Insecticides Combating insect pests in agriculture and beyond with chemical and Alpha-cypermethrin, Broflanilide, chlorfenapyr, fipronil, farmers to produce more with less and grow their business profitably ® ® ® ® biological solutions, such as in the areas of public health, professional pest Inscalis , Interceptor , Nealta , teflubenzuron, Termidor control and landscape maintenance while reducing their environmental footprint. ® ® ® ® ® Seed Treatment Improving seeds’ potential with chemical and biological protection as well as Flo Rite , ILEVO , Integral , Nodulator PRO, Poncho , Smart stewardship: Our stewardship tools and services are tailored ® ® ® ® inoculants Serifel , Systiva , Vault HP, Velondis to farmers’ daily work. Farmers get the support they need to use our ® ® ® ® ® Seeds & Traits Seeds and traits for key field crops such as canola (oilseed rape), cotton, Credenz , FiberMax , InVigor , LibertyLink , Nunhems , soybean and wheat, as well as vegetable seeds Stoneville® products safely: access to tools and services, protective equipment, customized training, digital solutions and new and future-oriented application technologies such as drones.
In Focus: Research and Development for the Right Balance in Agriculture BASF Report 2021 Management’s Report – In Focus: Research and Development for the Right Balance in Agriculture 91 In focus: Research and Development for the Right Balance in Agriculture For BASF, sustainability begins in research and development. Farmers in particular face major challenges: feeding a growing world population, changing weather conditions due to climate change, and limited natural resources and arable land. Our research and development activities innovate for farmers’ better quality, disease resistance and tolerance of environmental success in strategically relevant crops in major markets around the factors, such as drought. We apply state-of-the-art scientific methods world. They range from seed, biological and chemistry innovations such as genetic engineering and selective genome editing. These to digital solutions that protect plants against fungal diseases, insect biotechnology activities are part of BASF’s Bioscience Research pests and weeds, and improve soil management and plant health. division.1 In 2021, we spent €904 million on research and development in the Agricultural Solutions segment, representing around 11% of the At a glance segment’s sales. By 2031, we will launch major pipeline projects across all business areas. Our well-stocked innovation pipeline has €904 million >€7.5 billion a peak sales potential totaling more than €7.5 billion with products Research and development Peak sales potential of our to be launched between 2021 and 2031. BASF’s solutions help expenses in the Agricultural innovation pipeline with farmers achieve better yield and promote healthy eating, balancing Solutions segment in 2021 products to be launched economic, environment and societal demands. between 2021 and 2031 Our research and development facilities are a global network of research sites, seed production and breeding stations. Proximity to our customers and the crops they grow enables us to seize future market opportunities and increase our competitiveness. Our biotechnology activities and our research and development capabilities comprise advanced breeding techniques, analytics, tech nology platforms and trait validation. To offer tailor-made, more sustainable crop solutions, our research platform on gene identifica- tion focuses on plant characteristics that enable higher yield and 1 Corporate research and development expenses, sales, earnings and all other data for BASF’s Bioscience Research division are not reported in the Agricultural Solutions segment; they continue to be reported under Other.
BASF Report 2021 Management’s Report – Other 92 Other Sales in Other rose by €1,306 million compared with 2020 to Financial data – Othera €3,666 million. This was primarily the result of higher sales in com- Million € modity trading. 2021 2020 +/– Sales 3,666 2,360 55.3% At –€643 million, income from operations before special items in Income from operations before depreciation, amortization and special items –489 –609 19.7% Other was €126 million above the prior-year figure. This was largely Income from operations before depreciation and amortization (EBITDA) –484 –1,032 53.1% attributable to lower miscellaneous income and expenses, as well as Depreciation and amortizationb 157 171 –8.2% a higher contribution from other businesses. Income from operations (EBIT) –641 –1,203 46.8% EBIT rose by €562 million to –€641 million. This included special Special items 3 –434 . income, mainly from the partial release of provisions for the restruc- EBIT before special items –643 –769 16.4% turing of the Global Business Services unit. In the previous year, of which costs for cross-divisional corporate research –355 –364 2.5% special charges arose for their recognition. costs of corporate headquarters –255 –214 –19.2% other businesses 180 143 25.9% foreign currency results, hedging and other measurement effects –62 –58 –6.9% miscellaneous income and expenses –151 –276 45.3% Assetsc 23,121 24,131 –4.2% Investments including acquisitionsd 183 156 17.0% Research and development expenses 378 385 –1.8% a Information on the composition of Other can be found in Note 5 to the Consolidated Financial Statements from page 213 onward. b Depreciation and amortization of property, plant and equipment and intangible assets (including impairments and reversals of impairments) c Contains assets of businesses recognized under Other as well as reconciliation to assets of the BASF Group d Additions to property, plant and equipment and intangible assets
BASF Report 2021 Management’s Report – Non-Integral Oil and Gas Business 93 Non-Integral Oil and Gas Business BASF holds 67% of the ordinary shares in Wintershall Dea AG; 33% – Germany (production, development, exploration) Wintershall Dea drilled 12 exploration wells in 2021. Of these, are held by LetterOne. This reflects the value of the exploration and – Libya (production) around 58% were successful. production businesses contributed by Wintershall and DEA. BASF – Mexico (production, development, exploration) additionally holds preference shares for the contribution of Winters- – Netherlands (production, development, exploration) Wintershall Dea is also active in gas transportation. This includes hall’s gas transportation business. Including preference shares, – Norway (production, development, exploration) interests in GASCADE Gastransport GmbH and OPAL Gas BASF has a shareholding of 72.7% in Wintershall Dea. – Russia (production, development) transport GmbH & Co. KG held by WIGA Transport Beteiligungs- – United Arab Emirates (development) GmbH & Co. KG, and the interest in Nord Stream AG held directly – United Kingdom (production, development, exploration) by Winters hall Dea. Wintershall Dea is one of five financial investors Macroeconomic environment for the Nord Stream 2 pipeline project. It is not a shareholder of Nord Stream 2 AG. The laying of Nord Stream 2 was successfully The price of a barrel of reference Brent crude oil averaged $71 in Wintershall Dea’s activities in 2021 completed, the pipelines have been filled with gas and Nord 2021 (2020: $42). Gas prices on European spot markets rose Stream 2 AG has applied to the relevant authorities for certification sharply and were at an all-time high at the end of 2021. The signifi- Wintershall Dea produced 231 million BOE (barrels of oil equivalent) to operate the pipeline. cant price increases in the second half of 2021 were driven by the in 2021 (2020: 227 million BOE), of which around 165 million BOE very strong recovery in global macroeconomic demand. of gas (2020: 162 million BOE of gas). This corresponded to a daily As part of its climate strategy, which was communicated in Novem- 2 production of 634 thousand BOE (2020: 623 thousand BOE). ber 2020, Wintershall Dea aims to achieve net zero emissions from upstream activities by 2030 and reduce methane intensity3 to 0.1% Equity-accounted income of the oil and gas business Several development projects were successfully completed in 2021, by 2025. Wintershall Dea is involved in the Greensand CCS project4 including the Norwegian projects Ærfugl Phase 2, Gråsel, and the in the Danish North Sea, which aims to store up to 8 million metric Wintershall Dea AG contributed –€344 million to net income from field development of Solveig. The Achim Development joint venture tons of CO per year. 2 shareholdings in 2021 (2020: –€890 million). This included impair- operated by Gazprom in Russia, in which Wintershall Dea holds ments and reversals of impairments totaling –€581 million, mainly a 25.01% interest, started production in the first quarter of 2021. As planned, in 2021 Wintershall Dea completed the integration that in connection with the planned divestiture of assets in Argentina In Egypt, production at the Raven field started at the beginning of began with the merger and was able to realize the intended syner- and due to adjusted price expectations. In the previous year, lower the year. gies. The IPO targeted for 2021 was postponed due to the market oil and gas price forecasts and changed reserve estimates led to environment. impair ments of €791 million. The Norwegian Njord and Nova projects continued and are expected to come on stream in 2022. The start of production for the Dvalin 1 Wintershall Dea conducts production, development and explora- project in Norway was postponed to the second half of 2022. At the tion activities in the following countries: beginning of 2022, Wintershall Dea reached an agreement on the – Egypt (production, development, exploration) sale of its 50% interest in the unconventional oil blocks it operates in – Algeria (production) Argentina and decided to terminate its operations in Brazil. – Argentina (production, development, exploration) – Denmark (production, exploration) 1 Development activities include projects before and after the FID (final investment decision) 2 Scope 1 and 2 emissions from upstream activities operated and non-operated by Wintershall Dea at an equity basis 3 100% volume of methane emissions of Wintershall Dea’s operated assets divided by the volume of the own operated gas marketed 4 Carbon capture and storage
BASF Report 2021 Management’s Report – Regional Results 94 Regional Results Regions mainly in the Surface Technologies segment. Sales performance primarily driven by growth in Greater China, where sales rose by Million € was also weighed down by portfolio effects, particularly in the Indus- 42.5% in euros to €12,018 million. All segments improved sales in Sales Sales trial Solutions segment following the divestiture of the global pig- the region compared with the prior year, but especially the Surface by location of company by location of customer 2021 2020 +/– 2021 2020 +/– ments business. Technologies, Materials and Chemicals segments. Europe 31,594 24,223 30.4% 30,531 23,129 32.0% The sales performance was primarily the result of higher prices, North America 21,935 16,440 33.4% 20,867 15,709 32.8% North America particularly in the Surface Technologies, Chemicals and Materials Asia Pacific 20,632 14,895 38.5% 21,234 15,406 37.8% segments. Higher volumes in all segments contributed to the of which Greater China 12,018 8,433 42.5% 12,036 8,463 42.2% Sales at companies located in North America rose by 33.4% to increase in sales. Raw material shortages, the semiconductor deficit South America, Africa, €21,935 million in 2021. In local currency terms, they were 38.5% in the automotive market and the associated production and supply Middle East 4,437 3,591 23.5% 5,965 4,905 21.6% above the prior-year figure. Sales growth was mainly driven by con- chain disruptions also hampered sales performance in Asia Pacific. BASF Group 78,598 59,149 32.9% 78,598 59,149 32.9% siderably higher sales in the Surface Technologies and Chemicals Overall, portfolio measures had a positive impact on sales develop- segments. The Materials segment, Other and the Industrial Solu- ment, especially in Greater China and in the Surface Technologies tions segment also achieved considerably higher sales. Sales rose segment following the formation of BASF Shanshan Battery Mate- slightly in the Agricultural Solutions and Nutrition & Care segments. rials Co., Ltd. Europe Sales growth was mainly due to significantly higher price levels, Sales at companies located in Europe rose by 30.4% year on year especially in the Surface Technologies segment due to a significant South America, Africa, Middle East to €31,594 million. This was primarily due to considerably higher increase in precious metal prices, and in the Chemicals segment, sales in the Chemicals and Materials segments. The Surface Tech- particularly for propylene and butadiene. Higher volumes supported Sales at companies located in South America, Africa, Middle East nologies segment, Other and the Industrial Solutions and Nutrition & sales performance in all segments. Volume development was how- rose by 23.5% to €4,437 million. In local currency terms, they were Care segments also posted considerable sales growth, while the ever negatively impacted by extreme weather conditions, the semi- 31.0% above the prior-year level. Sales growth was primarily attri- Agricultural Solutions segment saw a slight increase in sales. conductor shortage in the automotive market and the resulting but able to considerably higher sales in the Agricultural Solutions, production and supply chain disruptions. Negative currency effects Surface Technologies, Chemicals and Materials segments. The Sales growth was driven by higher prices and volumes in all had an offsetting effect. Sales were reduced by portfolio effects, Indus trial Solutions and Nutrition & Care segments also recorded segments and in Other. Prices rose especially for steam cracker mainly driven by the divestiture of the global pigments business in higher sales. products in the Chemicals segment, for isocyanates in the Materials the Industrial Solutions segment. segment, and as a result of higher precious metal prices in the The sales increase was mainly driven by higher prices, especially Surface Technologies segment. Sales volumes increased, especially in the Surface Technologies, Agricultural Solutions and Chemicals in the Materials, Surface Technologies, Industrial Solutions and Asia Pacific segments. All segments significantly increased volumes despite Chemi cals segments. Volume development was however negatively supply chain disruptions caused by raw materials shortages. Nega- impacted by raw materials shortages, the semiconductor deficit Sales at companies headquartered in the Asia Pacific region were tive currency effects had an offsetting impact in all segments. in the automotive market and the associated production and supply 38.5% above the 2020 figure, at €20,632 million. In local currency chain disruptions. Sales were reduced by negative currency effects, terms, sales likewise rose by 38.5%. The increase in sales was
BASF Report 2021 Management’s Report – E.U. Taxonomy 95 E.U. Taxonomy In accordance with the E.U. Taxonomy Regulation and the supplementary delegated acts, the Nonfinancial Statement includes, for the first time, the share of the Group’s taxonomy- eligible s ales, investments and operating expenses for the 2021 business year relating to the environmental objectives of “climate change mitigation” and “adaptation to climate change.” BASF activities that are not currently covered by the E.U. taxonomy, and as such, are not relevant from a taxonomy perspective are generally reported as taxonomy-non- eligible in accordance with the delegated acts. These include large parts of BASF’s activities that may nevertheless be in line with the E.U.’s environmental objectives. To determine taxonomy eligibility, we first identified the activities – Afforestation investments reported in the Consolidated Financial Statements. relevant to BASF. The entire portfolio of products manufactured by – Electricity generation using solar photovoltaic technology Investments in the “manufacture of organic basic chemicals” and in BASF as well as production plants and investment projects were – Production of heat/cool from bioenergy the “manufacture of batteries” made the greatest contribution. then reviewed to determine whether they belong to one of the – Production of heat/cool using waste heat Operating expenses include non-capitalized costs that relate to 2 following activities in the manufacturing sector that had been identi- – Close to market research, development and innovation research and development, and maintenance and repair. They are fied as relevant: not reported in the Consolidated Financial Statements in this form. – Manufacture of hydrogen These activities made no material contribution to our overall tax- All of the investments and operating expenses of a production – Manufacture of carbon black onomy eligibility and were generally classified as taxonomy-non- facility with a taxonomy-eligible activity are counted as taxonomy- 1 eligible. Taxonomy-eligible operating expenses accounted for 11% – Manufacture of soda ash eligible. – Manufacture of chlorine of total operating expenses. The largest contributions were from the – Manufacture of organic basic chemicals Buildings constructed and operated by BASF, traffic facilities and activities “manufacture of organic basic chemicals” and “manufac- – Manufacture of anhydrous ammonia central water supply and wastewater management systems, i.e., the ture of plastics in primary form.” – Manufacture of nitric acid infrastructure that supports our core activities, may also fall under – Manufacture of plastics in primary form the E.U. taxonomy’s description of activities in the areas “Water BASF entered into several partnerships to transform energy supply supply, sewerage, waste management and remediation,” “Trans- in 2021 (see page 128). The resulting investments are not included We additionally assessed the following enabling activities in the E.U. port,” and “Construction and real estate activities.” In assessing in the analysis of taxonomy eligibility, as investments in joint ventures taxonomy to take into account solutions that contribute to climate taxonomy eligibility, we focused in 2021 on activities in the manufac- and associated companies do not have to be reported under the change mitigation at our customers: “manufacture of batteries” and turing sector and closely related activities in the energy and research taxonomy. “manufacture of energy efficiency equipment for buildings.” To avoid and development sectors. We generally classified potential contri- For more information on sales revenue, see Note 7 to the Consolidated Financial Statements from double counting, assignment to an enabling activitiy is only made if butions from infrastructure- related activities as taxonomy-non- page 221 onward a taxonomy-eligible product or project had not already been eligible. For more information on investments, see Notes 14 and 15 to the Consolidated Financial Statements from page 236 onward included under another activity. BASF also contributes solutions used to produce technologies for renewable energy or low-carbon We assessed the taxonomy eligibility of our sales based on sales Sales, investments and operating expenses in 2021 mobility. Since the E.U. taxonomy focuses on the manufacture of revenue as defined and reported in the Consolidated Financial Million € technologies and thus excludes precursors, we have classified Statements of the BASF Group. Taxonomy-eligible sales revenue Taxonomy- Taxonomy- Total eligible % non- eligible % these as taxonomy-non-eligible. accounted for 11% of total sales revenue in 2021. The largest con- Sales 78,598 8,881 11 69,717 89 tributions were from the activities “manufacture of plastics in primary In addition to our core business, the production of chemical prod- form” and “manufacture of organic basic chemicals.” Taxonomy- Investments 4,627 1,340 29 3,287 71 ucts, we have identified further BASF activities that can be allocated eligible investments (including acquisitions and excluding goodwill in Operating expenses 4,424 504 11 3,920 89 to the following activities presented in the E.U. taxonomy: accordance with the E.U. taxonomy) accounted for 29% of the total 1 The production of heat/cool using waste heat was also partially covered by other activities. 2 The criteria for the activity “close to market research, development and innovation” (for example, a technology readiness level of at least six) were used to determine taxonomy-eligible research and development costs.
Sustainability Along the Value Chain BASF Report 2021 Management’s Report – Sustainability Along the Value Chain 96 Sustainability Along the Value Chain We want to contribute to a better world with enhanced quality of life for everyone. That is why the three pillars of sustainability are firmly anchored in our corporate purpose, our strategy, our targets and our operating business. They are at the core of what we do, a driver for growth and an element of our risk management. We pursue a holistic approach that covers the entire value chain. We contribute to a sustainable development and to the United We value people and treat them with respect Nations’ Sustainable Development Goals (SDGs) in many ways (see page 36). For instance, our innovations, products and tech- SUPPLIERS BASF CUSTOMERS nologies help to use natural resources more efficiently, meet the demand for food, enable climate-smart mobility, reduce emissions We source responsibly We produce safely and efficiently We drive sustainable solutions and waste, and increase the capabilities of renewable energy. Alongside these positive contributions, our business activities also have negative impacts. For example, we create CO2 emissions, use protection, health and safety (see page 117). We meet our respon- thematic focus like the Alliance to End Plastic Waste (AEPW) or the water and procure raw materials from suppliers, which may involve sibilities with respect to international labor and social standards Global Battery Alliance (GBA). In addition, we realize a wide range of a potential risk of human rights violations. This is why we are con- chiefly through three elements: the Compliance Program, close projects – often together with partners – for example, to improve stantly working to broaden our positive contributions to key sustain- dialog with our stakeholders and the guideline on compliance with sustainability in the supply chain or to promote circularity in the ability topics (see page 45) along our value chains and reduce the international labor norms, which applies Group-wide. economy. negative impacts. For more information on how we value people and treat them with respect, see page 97 onward Our business partners are also expected to comply with prevailing For more information on responsible procurement, see page 109 onward We are committed to doing business in a responsible, safe, laws and regulations and to align their actions with internationally For more information on safe and efficient production, see page 117 onward resource-efficient and respectful way. Our actions are guided by recognized principles. We have established appropriate manage- For more information on sustainable solutions, see page 141 onward our corporate values and our global Code of Conduct. We comply ment and control systems, for example, for working with our with and in some cases exceed the applicable laws and regulations suppliers (see page 109). with voluntary commitments. We stipulate binding rules for our employees with standards and guidelines that apply throughout the We seek dialog with our stakeholders to discuss critical issues Group. In doing so, we consider, respect and promote interna- and, if necessary, develop solutions together. Through our societal tionally recognized principles such as the 10 principles of the U.N. engagement, we want to create a positive impact, particularly in Global Compact and the Core Labor Standards of the International the communities surrounding our sites and help solve global Labor Organization (ILO). challenges. We want to ensure that we act in line with the applicable laws and We are involved in numerous sustainability initiatives to drive uphold our responsibility to the environment and society with forward sustainability in general and, specifically, as this relates our comprehensive management and monitoring systems. Our to our value chains. These include the World Business Council Responsible Care Management System does this for environmental for Sustainable Development (WBCSD) as well as networks with
BASF Report 2021 Management’s Report – We Value People and Treat Them with Respect 97 We Value People and Treat Them with Respect In this section: Employees Employee engagement and empowerment are key to our success. We build networks across our business Responsibility for Human Rights and industry to establish good relationships with our partners and stakeholders. With our solutions, our Stakeholder Engagement responsible business conduct and our societal engagement, we want to contribute to a better quality of Societal Engagement life for everyone. Employees the tools and skills necessary to be able to offer our customers changing environment, demographic change and the digital work- GRI 102, 103, 201, 202, 203, 401, 402, 404, 405, 406, 407, 408, 409, 412, 413 products and services with an even greater level of differentiation place. In everything we do, we are committed to complying with SUPPLIERS BASF CUSTOMERS and customization. Our corporate strategy promotes a working internationally recognized labor and social standards. We want to atmosphere based on mutual trust, in which employees are given further strengthen our innovative power with attractive working Our employees make a significant contribution to BASF’s the space to optimally develop their individual skills and potential. conditions and through the inclusion of diversity. Lifelong learning success. We want to attract and retain talented people for This positions us to meet the challenges of an increasingly rapidly and individual employee development lay the foundation for this. our company and support them in their development. To do so, we cultivate a working environment that inspires and BASF Group employees by region connects people. It is founded on inclusive leadership based (Total: 111,047, of which 26.1% women, as of December 31, 2021) on mutual trust, respect and dedication to top performance. Europe11 At a glance 67,32 North America ( 60.8 %) 6,73 ( 15.1%) 7.% 24.% 111,047 72.7% Employees around the world 27.3 % South America, Africa, Asia Middle East Pacific ▪ Employee engagement and leadership impact on center stage 6,76 ,76 ▪ Promoting diversity and mutual respect ( 6.1%) ( 18.0 %) ▪ Further expansion of virtual learning and digitalization 66.6% 33.4 % 26.7% 73.3% Strategy Our employees are key to the successful implementation of BASF’s 1 ( strategy. We are convinced of the value of excellent employees, 11 Of which Germany 51,026 45.9%) 24.5% 75.5% Of which BASF SE 34,405 ( 31.0%) 21.9% 78.1% leaders and working conditions, and strive to give our employees
BASF Report 2021 Management’s Report – We Value People and Treat Them with Respect 98 Compensation and benefits as well as offerings to balance personal can thrive and perform at their best. We regularly calculate the Our specific expectations of leaders’ conduct are derived from and professional life complete our diverse total offer package. In employee engagement level as an index score based on five ques- these: The CORE Leadership Values serve as the guiding order to continue to attract talented people to our company in tions on set topics in our employee surveys. The most recent survey principles for all leaders and set out BASF’s expectations of leader- the future, we work continuously on BASF’s attractiveness as an from 2020 revealed an engagement index of 82% (2019: 79%). Our ship behavior. They are aligned with BASF’s strategic goals and employer. Our employees play an important role here as ambassa- aim is to keep this score above 80%. We support our leaders with a reflect our company’s leadership vision (see also page 31). dors for BASF. range of follow-up measures to decentrally address individual action areas and in this way, help to further strengthen employee engage- We offer our leaders a wide variety of learning and development ment together with their employees. opportunities for each phase of their career as well as various Number of employees formats that enable them to learn from one another and external Pulse checks were carried out to identify and address employees’ experts. Global, regional and local offerings are optimally coordi- As of December 31, 2021, the number of employees increased specific needs in 2021. In North and South America, for example, nated. We aim to develop leaders who lead their teams with to 111,047 employees compared with 110,302 employees as of surveys were conducted on the inclusion of diversity. These optimism, empathy and trust, and in this way, create a competitive December 31, 2020. The rise was primarily due to staff increases revealed a desire to further embed inclusive behavior in the work- advantage for BASF. in Asia Pacific, especially in connection with the formation of ing environment, among other things. Employees in Germany and BASF Shanshan Battery Materials Co., Ltd., as well as for our new Europe were surveyed about their current work situation, flexible In order to anchor the CORE Leadership Values in day-to-day life, Verbund site in Zhanjiang, China. The divestiture of the pigments working, stresses caused by the coronavirus pandemic and team an in-depth training course – CORE Leadership Upskilling – was business, which affected around 2,500 employees, had an off - sentiment. Among other things, the results showed that employees offered in 2021. The virtual training comprised a series of modules setting impact. We employed 3,028 apprentices1 (2020: 3,120). feel safe working at our sites and that employees who have been that encouraged self-reflection and provided opportunities for 2,329 employ ees were on temporary contracts (of which 47.6% working flexibly since the start of the pandemic are coping well with global dialog. The training modules were initially completed by all were women). it. Regular global employee surveys remain a focus, and we plan to senior executives worldwide. Work in small, mixed groups aimed conduct the next survey in spring 2022. to deepen participants’ understanding of the CORE Leadership Values, enable in-depth discussion of these and expand global Employee engagement networks. Since the fall of 2021, additional leadership levels have What we expect from our leaders undergone training and activities modeled on CORE Leadership BASF can rely on the engagement of its employees. This is shown Upskilling. by a passion for the job, a dedication to top performance and a Our leaders and their teams should contribute to BASF’s success. strong commitment to BASF. Global employee surveys and pulse This is why we promote high-quality leadership and measure its Regular feedback plays an important role in the development of checks are established feedback tools in the BASF Group and are impact. We understand impactful leadership as leaders that serve leaders. We have therefore adapted our global feedback tool to used to actively involve employees in shaping their working environ- as role models by having a positive influence on the engagement enable leaders to, in the future, even better reflect on how these ment. The results are communicated to employees, the Board of and development of their employees, and developing and imple- values are anchored in their leadership behavior. Executive Directors, the Supervisory Board and stakeholders. We menting business strategies in line with our corporate values. have performed regular global employee surveys since 2008. We These expectations are part of the standard global nomination Since 2020, various existing leadership development tools have aim to keep the high level of employee engagement determined by criteria for leadership positions. Our leadership culture is based on been converted to virtual formats to optimally support our leaders – these surveys and increase it even further as far as possible. As part BASF’s corporate values: creative, open, responsible and entrepre- including during the challenging times of the coronavirus pandemic. of the BASF strategy, we therefore set ourselves the following goal neurial – CORE. in 2018: More than 80% of our employees feel that at BASF, they 1 At BASF, the apprenticeship program trains students for technical, scientific and business vocations as well as for trade and craft professions.
BASF Report 2021 Management’s Report – We Value People and Treat Them with Respect 99 Inclusion of diversity BASF is one of approximately 150 companies that support the 2030 target United Nations Global LGBTI (lesbian, gay, bi, trans and intersex) The global character of our markets translates into different cus- Standards of Conduct for business and has done so since 2018. Proportion of women in tomer requirements. We want to reflect this diversity among our Employees again promoted openness, acceptance and tolerance leadership positions with employees, too, because it enables them to better meet our with many activities to support the LGBTI movement at various sites disciplinary responsibility 30% customers’ needs. For us, diversity means, among other things, around the world in 2021. having people from different backgrounds working at our company who can draw on their individual perspectives and skills to grow Diversity also relates to the company’s demographic profile, which In order to continuously monitor our progress toward this target, our business. By valuing and promoting employee diversity, we varies widely by region within the BASF Group. Our aim is to create we have developed a global dashboard, which is used to regularly boost our teams’ performance and power of innovation, and a suitable framework to help maintain the employability of our per- review the implementation status. The systematic advancement of increase creativity, motivation and employees’ identification with sonnel at all stages of life and ensure the availability of qualified women is also an integral part of our process for selecting senior the company. employees over the long term. executives. Promoting and valuing diversity across all hierarchical levels is an BASF Group employee age structure As a signatory to the United Nations’ Women’s Empowerment Prin- integral part of our strategy and is also embedded in our corporate (Total: 111,047, of which 26.1% women, as of December 31, 2021) ciples (WEPs), we are committed to promoting gender equality. We values. BASF strives to foster a working environment based on Men Women are also involved in other external initiatives to promote inclusion of mutual respect, trust and appreciation. We expect inclusive conduct 42,531 diversity at work, such as the Chefsache initiative and the European from all employees and our leaders. By this, we mean creating an 38,798 Round Table. Employees from all regions took International 26.4% environment in which different aspects of diversity and individual 30.3% Women’s Day 2021 as an opportunity to reflect on the current situa- 21,511 strengths are valued. 18.0% tion of women at BASF, celebrate successes and campaign for 8,207 69.7% 73.6% 25.9% 82.0% greater equality. Our leaders play an important role in promoting diversity and creat- 74.1% ing an inclusive work environment. We support them with various Up to and 26–39 years 40–54 years 55 years Leaders and professionals in the BASF Group offerings, for example as part of leadership development. A toolbox including 25 years and up December 31, 2021 Of which women (%) with a wide range of content inspires a change of perspective and a (Senior) executivesa 9,006 25.6 podcast series from leaders shows the importance of appreciative, Professionalsb 40,030 32.5 fair and inclusive leadership. We also promote diversity in the selection and development of our leaders. We have set a global target to promote female leadership a Employees with disciplinary leadership responsibilities b Specialists without disciplinary leadership responsibilities Integrating different perspectives is very important to BASF. There and aim to increase the proportion of women in leadership posi- are a number of Employee Resource Groups around the world tions to 30% by 2030. We have made important progress toward For more information on diversity in the Board of Executive Directors and the Supervisory Board, dedicated to different aspects of diversity. In addition, we want to this and continuously review our target. In the BASF Group, the see page 167 onward create a greater awareness of diversity in our organization with vari- global proportion of female leaders with disciplinary responsibility For more information on diversity and inclusion, see basf.com/diversity ous activities. BASF supports the German Diversity Charter and has was 25.6% at the end of 2021 (2020: 24.3%). participated in German Diversity Day and European Diversity Month with various virtual initiatives and offerings. At our Ludwigshafen site in Germany, we campaigned against racism and discrimination as part of the International Weeks Against Racism.
BASF Report 2021 Management’s Report – We Value People and Treat Them with Respect 100 Competition for talent To combat the shortage of skilled workers in production and techni- As of December 31, 2021, the BASF Group was training 3,028 peo- cal areas, due among other factors to demographic-related declines ple in 12 countries and around 50 occupations. We spent a total of Attracting and retaining the best employees is crucial to our in Ludwigshafen, Germany, we have strengthened our social media around €119 million on vocational training in 2021. success. Having an attractive and compelling total offer package presence, for example, to alert qualified specialists to new career For more information on careers at BASF, see basf.com/careers for employees is becoming increasingly important given the strong prospects at BASF. In addition, we cooperate with local radio global competition for the best qualified employees and leaders. This stations and the German employment agency to target skilled is why we are constantly working on measures to increase BASF’s workers at informational events. Learning and development attractiveness in the global labor markets. We once again achieved high scores in a number of employer rank- Learning and development are essential success factors for a We are increasingly using digital platforms such as our country- ings in 2021. For example, in a study conducted by Universum, strong company culture. The skills and competencies of our specific career websites as well as global and regional social net- young scientists ranked BASF as the second most attractive employees are critical for profitable growth and lasting success. For works to reach potential candidates. This enables us to appro- employer in Germany (2020: fifth). In North America, DiversityInc this reason, we want to further modernize our learning culture and priately address different target groups. named BASF as one of the top 50 companies for diversity in recruit- step up our efforts to promote continuous, self-directed learning ing for the ninth consecutive year. In Asia, Top Employer recognized and learning from others. Employee development at BASF is guided In light of the coronavirus pandemic, we primarily used digital solu- BASF China as one of the best employers for the twelfth time in by the belief that talent is in everyone. This means that development tions for our talent search activities in 2021 and participated in a succession. In South America, LinkedIn ranked BASF second in its opportunities and support are open to all employees. few in-person events. To also provide the best possible information list of top companies in Brazil. on BASF as an employer virtually, we are continuously developing In our understanding, there is more to development than a promo- our digital presence. For example, we are represented at digital trade The BASF Group hired 10,293 new employees in 2021. The tion or a job change – it encompasses the development of personal fairs and conferences, conduct digital excursions for students from percentage of employees who resigned during their first three experience and abilities. In regular development meetings, which are various universities of sites in Germany, and organize expert lectures years of employment – the early turnover rate – was 1.5% worldwide held as part of our annual employee dialogs, employees outline for future talent. This virtual contact enables a demand-oriented, in 2021. This turnover rate was 0.6% in Europe, 2.4% in North ideas for their individual development together with their leaders and flexible and location-independent approach. As a result, we were America, 3.4% in Asia Pacific and 2.5% in South America, Africa, determine specific measures for further training and development, able to continue to attract and recruit talented employees. Middle East. Our early turnover rate is therefore at a desirable low which focus on personal and professional competencies. Our learn- level. ing activities follow the “70-20-10” philosophy: We apply the In addition, we consistently take part in specific career events to elements “learning from experience” (70%), “learning from others” directly reach and attract talent from various disciplines, especially BASF Group new hires in 2021 (20%) and “learning through courses and media” (10%). Our learn- female candidates. We focus in particular on our female employees 2021 Of which women (%) ing and development offerings cover a range of learning goals: as role models with various initiatives such as podcasts, career fairs Europe 4,045 30.4 Starting a career, expanding knowledge, personal growth and and networking events aimed specifically at women, or on our social North America 2,551 29.3 leadership development. media channels. Asia Pacific 2,797 31.0 Digital learning formats play an important role in our development In 2021, we established a digital onboarding process at some sites South America, Africa, Middle East 900 48.4 offerings. Even before the coronavirus pandemic, training for leaders for new employees and their managers in the period up to the first Total 10,293 31.9 and employees was updated to meet the challenges of the digital day of work and beyond. The aim is to ensure a successful first day transformation and modern working life with appropriate learning at work and to build an early bond between the new colleagues and formats and content. For example, platforms such as the Digital their future team at BASF, for example by sending video messages Campus, Digitalization & Me and the Ways of Working portal were and information about the division and team. We want to continue enhanced and refined to support employees in all aspects of virtual to drive forward global implementation in 2022. collaboration and in building their digital skills. The continuous
BASF Report 2021 Management’s Report – We Value People and Treat Them with Respect 101 Good to know development of our employees’ digital skills will remain crucial going Compensation and benefits forward. The portfolio includes offerings for self-directed learning, as well as individual consulting and support for teams and leaders We want to attract and retain engaged and qualified employees, around the digital transformation. Employees and leaders can also and motivate them to achieve top performance with a total offer hold joint workshops in an avatar-based 3D working and learning package that includes market-oriented compensation, individual environment. In addition, the many academies in the divisions and development opportunities and a good working environment so that service units also offer training on specific professional content. they contribute to the company’s long-term success. Our employ- ees’ compensation is based on global compensation principles We enable our employees to take responsibility for their own according to position, market and performance. As a rule, compen- professional development within the company with digital and novel sation comprises fixed and variable components as well as benefits offerings. To support multidisciplinary teams in the development that often exceed legal requirements. In many countries, these Future of Work @ BASF of products, services or business models, workshops on design benefits include company pension benefits, supplementary health thinking empower participants to find creative and innovative insurance and share programs. We regularly review our compensa- The coronavirus pandemic has fundamentally changed how we solutions to complex problems. By providing interactive spaces, the tion systems at the global and local levels. work. That is why our Future of Work @ BASF initiative addresses concept also lends itself to hybrid working methods. This fosters an the question of how our teams can find the right balance bet ween agile learning and working culture, which will ultimately also help us We want our employees to contribute to the company’s long-term on-site and remote working to continue to perform at their best to master the digital transformation. success. This is why the compensation granted to the vast majority in the future. Connectedness and close dialog remain our number of our employees includes variable compensation components, with one priorities – both are key to team spirit, creativity and innova- Against the backdrop of the digital transformation, we support our which they participate in the success of the BASF Group as a whole tion. The wide range of jobs, tasks and local conditions make leaders in questions about shaping the working world of the and are recognized for their individual performance. The same prin- different working models necessary. To reflect this, our local future. For example, the #liveitleadit program provides insights into ciples basically apply for all employees worldwide. The amount of teams are developing tailored solutions within global guidelines various areas of the organization and the opportunity to discuss the variable component is determined by economic success as well that meet individual requirements. Workshop concepts and topics such as hybrid working or living a failure culture. as the employee’s individual performance. We use the BASF Group’s training support the process. return on capital employed (ROCE) to measure economic success for the purposes of variable compensation. This links variable One example is the Flex Work @ LU project at the Ludwigshafen 1 Individual performance is compensation to our ROCE target. site in Germany. The focus is on the shift toward greater flexibility assessed as part of a globally consistent performance management as well as practical solutions on how to maintain and strengthen process. In numerous Group companies, our “plus” share program connectedness in an increasingly hybrid working environment – ensures employees’ long-term participation in the company’s from new office concepts to IT solutions and tips for teamwork. success through incentive shares. In 2021, for example, around The ideas are tested together with pilot units. Successful con- 23,600 employees worldwide (2020: around 27,600) participated in cepts are made available to all units at the site in the form of a the “plus” share program. toolbox. Since 2020, BASF has offered senior executives the opportunity to 2 participate in a long-term incentive (LTI) program in the form of a performance share plan. The LTI program has a term of four years 1 In calculating ROCE, adjustments are made for negative and positive special items resulting from acquisitions and divestitures (for example, integration costs in connection with acquisitions and gains or losses from the divestiture of businesses) when these exceed a corridor of +/–1% of the average cost of capital basis. An adjustment of the ROCE (in the first 12 months after closing) therefore only occurs in cases of exceptionally high special items resulting from acquisitions and divestitures. 2 The LTI program referred to here is aimed at management levels 2 to 4 as well as individual employees who have attained senior executive status by virtue of special expertise. For more information on the compensation of the Board of Executive Directors and the Supervisory Board, see the Compensation Report at basf.com/compensationreport
BASF Report 2021 Management’s Report – We Value People and Treat Them with Respect 102 and takes into account the development of the total shareholder BASF Group personnel expenses Regional initiatives specifically address the needs of our employees return. It incentivizes the achievement of strategic growth, profit- Million € at a local level. For example, flexible co-working spaces in the ability and sustainability targets. To take part in this program, partici - 2021 2020 +/– Rhine-Neckar region in Germany were tested in pilot projects and a pants must hold BASF shares, the amount of which is based on Wages and salaries 8,847 8,416 +5.1% framework for potential future uses was developed. their individual fixed compensation. In 2021, around 91% of the Social security contributions and assistance 1,519 1,424 +6.7% people eligible to participate in the LTI around the world did so, expenses Our Work-Life Management employee center in Ludwigshafen, holding between 30% and 70% of their fixed annual compensation Pension expenses 732 736 –0.5% Germany, (LuMit) offers a number of services under one roof: child- in BASF shares. Total personnel expenses 11,097 10,576 +4.9% care, fitness and health, and social counseling and coaching offered by BASF Stiftung. Services were adapted so they could continue The share price-based compensation program (BASF Option Pro- during the coronavirus pandemic based on the current coronavirus gram, BOP), which had existed since 1999, was offered for the last Balancing personal and professional life laws and local restrictions. We also provide employee assistance time in 2020. Around 87% of the people eligible to participate in the programs at other sites in Germany and around the world to help program around the world did so, investing up to 30% of their Our identity as an employer includes our belief in supporting our employees overcome difficult life situations and maintain and restore actual variable compensation (for the 2019 business year) in BASF employees in balancing their personal and professional lives. We their employability. Social counseling and coaching also enabled shares. want to strengthen their identification with the company and our employees and their families to receive extensive support during For more information on share-price based compensation programs and BASF’s share programs, see position in the global competition for qualified personnel. To achieve the coronavirus pandemic, for example by expanding telephone the Notes to the Consolidated Financial Statements from page 280 onward this, we have a wide range of offerings aimed at employees services. For more information on the compensation of the Board of Executive Directors and the Supervisory in different phases of life that accommodate the growing demand Board, see the Compensation Report at basf.com/compensationreport for flexibility in when and where they work. These include flexible working hours, part-time employment, remote working, and time off Dialog with employee representatives Personnel expenses options that provide the necessary flexibility to care for children or family members. We are constantly working to expand these options Trust-based cooperation with employee representatives is an The BASF Group’s expenses for wages and salaries, social security and increasingly support the effective use of digital solutions here. important component of our corporate culture. Our open and con- contributions and assistance, as well as for pensions in 2021 totaled tinual dialog lays the foundation for balancing the interests of the €11,097 million. In 2020, these expenses amounted to €10,576 mil- Our flexible tools proved helpful during the coronavirus pandemic. company and its employees, even in challenging situations. In the lion and included personnel expenses from the disposal group for They help our employees to master the increased challenges around case of organizational changes or if restructuring leads to staff the construction chemicals business in the amount of €291 million work and personal life during the pandemic and will continue to downsizing, for example, or in the case of codetermination-relevant until the date of the divestiture. The rise in personnel expenses in provide flexibility. To integrate the positive experiences from the topics, we involve employee representatives at an early stage to 2021 was mainly due to higher bonus provisions. Particularly the surge in remote working into our working culture, we have devel- develop socially responsible implementation measures. In 2021, this lower average number of employees had an offsetting impact. oped global guiding principles and a framework for the future of happened in connection with the planned organizational realign- work (see box on page 101). ment of research, for example. Our actions are aligned with the respective legal regulations and the agreements reached, as well as opera tional conditions. The organizational protective measures taken during the coronavirus pandemic to date are backed by our employee representatives.
BASF Report 2021 Management’s Report – We Value People and Treat Them with Respect 103 By focusing our discussions on the local and regional situations, we regularly follow up on and document the results of the comparison aim to find tailored solutions to the different challenges and legal between national law and our guideline, as well as measures to conditions for each site. The BASF Europa Betriebsrat (European implement the guideline. This is part of our central due diligence Works Council) addresses cross-border matters in Europe. In South system. An additional component of our corporate due diligence is America, we foster dialog with the Diálogo Social. In China, we work our training concept, which was enhanced and refined in 2021. It together with trade unions that have been organized locally within includes target group-specific training and e-learning modules as the framework of legal possibilities. well as a global platform for internal dialog. For more information, see basf.com/employeerepresentation We monitor our voluntary commitment to international labor and social standards as part of our management process. As before, International labor and social standards individual elements of the guideline are also reviewed as part of internal control processes such as Responsible Care audits at We act responsibly toward our employees. Part of this is our volun- BASF Group companies. In addition to these quality assurance tary commitment to respecting international labor and social stan- measures, compliance with international labor and social standards dards, which we have embedded in our global Code of Conduct. is an integral part of the standard questionnaire in the compli- This encompasses internationally recognized labor norms as stipu- ance management audits conducted by BASF’s Corporate Audit lated in the United Nations’ Universal Declaration of Human Rights, department. the OECD Guidelines for Multinational Enterprises, and the Tripartite For more information on global standards, see page 31 Declaration of Principles Concerning Multinational Enterprises and For more information on our responsibility for human rights, see page 104 Social Policy of the International Labour Organization (ILO). BASF is For more information on compliance, see page 171 onward committed to complying with these standards worldwide. We For more information on standards in our supply chain, see page 109 onward mainly approach our adherence to international labor and social For more information on labor and social standards, see basf.com/labor_social_standards standards using three elements: the Compliance Program (including compliance hotlines), close dialog with our stakeholders (such as with employee representatives or international organizations) and the BASF guideline on compliance with international labor norms, which applies Group-wide. This guideline makes concrete the topics in our global Code of Conduct under “Human rights, labor and social standards” as these relate to our employees. It forms the basis for our global, risk-based management process: We regularly monitor changes to the national law of all the countries in which BASF operates and evaluate our adherence to international labor and social standards. If the national law contains no or lower requirements, action plans are drawn up to successively close these gaps in a reasonable time frame. If conflicts with national law or practices arise, we strive to act in accordance with our values and internationally recognized principles without violating the law of the country concerned. As part of the management process, we
BASF Report 2021 Management’s Report – We Value People and Treat Them with Respect 104 Responsibility for Human Rights rights are integrated into supplier assessment processes and our practical implementation of human rights due diligence in GRI 102, 103, 406, 410, 411, 412, 413 global monitoring systems for environmental protection, safety and 10 companies” commissioned by the German Federal Ministry for SUPPLIERS BASF CUSTOMERS security, health protection and product stewardship. They are also Economic Cooperation and Development (BMZ) and the German part of the evaluation of investment, acquisition and divestiture Agency for International Cooperation (GIZ). BASF acknowledges its responsibility to respect inter na- projects, assessments along the entire product life cycle, and sys- tion ally recognized human rights. For many years now, we tems to monitor labor and social standards. In addition, aspects of We strengthened awareness of our due diligence obligations in have engaged in constructive dialog on human rights with human rights topics are part of the global qualification r equirements procurement by including additional information on human rights other companies, nongovernmental organizations, inter na- for our security personnel and are incorporated into agreements topics in training. In addition, the human rights risk assessment is tional organizations and multi-stakeholder initiatives to bet- with contractors. more systematically incorporated into strategy development in our ter understand different perspectives and address conflict- procurement segments (see page 109). ing goals. BASF is a founding member of the U.N. Global Our compliance unit is responsible for steering human rights top- Compact and a member of the Global Business Initiative ics and coordinates the work of the cross-unit Human Rights Expert We also further improved our grievance mechanisms and intro- on Human Rights (GBI), a group of globally operating com- Working Group, which we established in 2020. In it, employees from duced a standardized global external and internal hotline and panies from various sectors. The initiative aims to ensure specialist units – procurement, legal, HR, environmental protection, reporting system in 2021. For example, we expanded the number of implementation of the U.N. Guiding Principles on Business health and safety, sustainability strategy, site security, supply chain, languages available. A new website provides information about the and Human Rights. communications and government relations – and the operating divi- hotline and the grievance procedure, and now also offers the option sions work closely together. The expert working group provides of contacting the company anonymously online in addition to local At a glance support and advice in challenging and critical situations, on the telephone numbers. Employees can also contact specialists directly development of internal processes, and on the creation of informa- via an internal online platform or the corresponding app. The pro- ▪ Human rights due diligence as a Group-wide task tion and training offerings, among other things. This is how we cessing status of a submitted report can be tracked anonymously. ▪ Systematic and extensive anchoring of human rights topics in ensure that we approach our human rights responsibility holistically Moreover, submitted cases will be able to be recorded and evalu- company processes and culture and that we can continually improve our performance. ated more systematically in the future (see page 171 onward). In 2021, 206 human rights-related complaints were received by phone In 2020, we conducted a comprehensive review of our human as well as by post and e-mail. All complaints were reviewed and We see human rights due diligence as an important, all-encom- rights management system and the related processes. This forwarded to the relevant departments for in-depth investigation. If passing task that we can only perform by working together as showed that we have achieved important milestones regarding justified, appropriate measures were taken. a team throughout the entire organization. That is why we have our due diligence obligations. However, the analysis, which was embedded our responsibility for human rights into our Code of discussed by the Board of Executive Directors, also identified poten- We see assuming our human rights responsibilities as a continuous Conduct and set this out in our human rights position. We uphold tial for improvement, for example with regard to awareness of human process. That is why we continuously review our policies and pro- our standards worldwide, including where they exceed local legal rights topics within our organization and relating to the integration of cesses and update them whenever necessary. We are currently require ments. All employees and leaders are responsible for ensur- these topics in our guidelines and processes. examining further development measures in various working groups ing that we act in accordance with our Code of Conduct and our against the backdrop of new regulations such as the German Act on human rights position. We therefore launched a global, internal campaign in April 2021 to Corporate Due Diligence Obligations in Supply Chains (LkSG) and raise awareness on the topic of human rights. Externally, we were the forthcoming E.U. legislation on due diligence in the supply chain. We rely on a systematic, integrated, risk-based approach and involved in the U.N.’s International Year for the Elimination of Child established monitoring and management systems. BASF is Labour through two initiatives and together with other partners, We established a Human Rights Advisory Council in 2020 to also active in initiatives such as Together for Sustainability (TfS) and and committed to specific joint measures in the fight against child systematically integrate external expertise. Its members include Responsible Care®, which promote sustainability in the supply chain. - labor. Together with other DAX-listed companies, we also partici independent international human rights experts. The trust-based Our measures and criteria for monitoring and observing human pated in the study “Moving with responsibility toward success: dialog on human rights topics helps us to better understand different
BASF Report 2021 Management’s Report – We Value People and Treat Them with Respect 105 perspectives and to deal more openly with critical situations. At the including and especially there – and contribute to the respect of We report on our global targets, monitoring systems and measures same time, the renowned external experts show us where we have human rights. to integrate human rights topics into our business activities in publi- potential for improvement and help us to build on our strengths in cations such as this report and online. how we handle human rights. The meetings, which are chaired by We have trustful working relationships with our partners (customers, For more information on standards in our supply chain, see page 109 onward our Chief Compliance Officer, are also attended by employees from suppliers, joint venture partners, contractors), expect them to com- For more information on raw materials, see page 112 onward the sustainability strategy and compliance units. Other repre sen ta- ply with internationally recognized human rights standards and to For more information on our production standards, see page 119 onward tives, for example, from the operating divisions or procurement, are demand the same of their partners further along the value chain. We For more information on systems for monitoring labor and social standards, see page 103 onward invited depending on the focus topics. In this way, the Human support our partners in their efforts to meet their respective For more information on corporate governance and compliance, see page 161 onward Rights Advisory Council provides an external perspective on estab- responsibilities. See basf.com/humanrights for more information on the human rights position and a comprehensive report on the implementation of due diligence in human rights in accordance with the requirements of lishing and improving our processes, and contributes this in discus- the National Action Plan developed by the German government, and in accordance with the sions with the leadership team. We can only meet our goal of eradicating human rights abuses U.N. Guiding Principles on Business and Human Rights along our value chains if we work together. We have defined our For more information on the Human Rights Advisory Council, see basf.com/human-rights-council We maintained our dialog with the Human Rights Advisory Council expectations in a binding Supplier Code of Conduct. We are in throughout 2021, both with the body as a whole and in small groups, close contact with our business partners, especially in higher-risk and with individual experts. The topics discussed included respon- areas and regions, and monitor the implementation of required sible supply chain management, for example in challenging supplier standards and measures for improvement. We use recognized relationships or in high-risk regions. Our contribution to the respon- assessments and audits to verify this. sible use of our solutions and products was also discussed. In 2021, we stepped up our commitment to action areas with increased risk potential, such as battery materials (see box on the Good to know right). Where conflict minerals (tin, tantalum, tungsten, their ores and gold) are used, we pay attention to the implementation of the Battery Minerals Task Force relevant E.U. regulation in our supply and value chains. We also set store on certified sustainable supply chains and fair working In 2021, BASF established a Battery Minerals Task Force to meet conditions in the procurement of raw materials such as palm oil, the specific challenges associated with the growing demand for palm kernel oil and castor oil. We maintain dialog with national and battery materials. It bundles the expertise of the Catalysts division international NGOs and are involved in numerous networks and and various functional units. The initiative was formed to address partnerships (see page 113 onward). These include the Cobalt for the risks and opportunities of our global raw material supply Development initiative in the Democratic Republic of Congo, the chains for battery materials from a sustainability viewpoint and Responsible Lithium Partnership in Chile, the Global Battery Alliance steer the resulting activities. The aim is to ensure the responsible and the Roundtable on Sustainable Palm Oil (RSPO). procurement of battery materials. The task force is also respon- sible for the ongoing development of our internal guidelines to As an international company, we are a part of society in the coun- ensure their continuous improvement and adaptation to new tries in which we operate and have business relationships with regulatory requirements, as well as to take account of develop- partners around the world. We are confronted by the fact that there ments in our business areas. are states that do not honor their obligation to protect human rights. For more information on supplier management, see page 109 onward People are particularly at risk in such countries and companies’ For more information on mineral raw materials, see page 115 onward ability to act is often limited. We are committed to our values –
BASF Report 2021 Management’s Report – We Value People and Treat Them with Respect 106 Stakeholder Engagement We promote digital dialog on sustainability topics. In November as well as smallholder projects. The projects aim to help achieve GRI 102, 103, 413, 415 2021, we held the second hackathon as part of the Climathon SDG 2 by 2030 (Zero hunger). Forty-three companies signed the initiative in North and South America, where employees developed pledge, which is implemented by the Global Alliance for Improved At a glance digital solutions for sustainability topics. Nutrition (GAIN) and other international organizations. For more information on stakeholder dialog, see basf.com/en/stakeholder-dialog ▪ Dialog with various stakeholder groups with a focus on the For more information on our guidelines for responsible lobbying, see As a responsible neighbor and a partner in the Rhine-Neckar integration of the U.N. Sustainable Development Goals (SDGs) basf.com/guidelines_political_communication metropolitan region in Germany, our societal engagement strategy ▪ The Stakeholder Advisory Council’s focus areas: climate For more information on the Industry Associations Review, see basf.com/corporategovernance strengthens the participation and integration of disadvantaged protection, the energy transformation and food security groups, and promotes research and discovery. Societal Engagement GRI 203, 413 With Wissensfabrik – Unternehmen für Deutschland e.V., we We leverage the expertise of global initiatives and networks and promote a network of around 130 companies and corporate actively engage in dialog with various stakeholder groups, contrib- At a glance foundations that sponsor educational institutions and start-ups to . uting our expertise support children, young people, students and young entrepreneurs. ▪ BASF a responsible neighbor at sites worldwide The focus is on school projects that provide hands-on experience For instance, we have been a member of the U.N. Global Compact ▪ New business models improve local living conditions with STEM (science, technology, engineering and mathematics). (UNGC) since its establishment in 2000. As a recognized LEAD Due to the coronavirus pandemic, the project’s initiatives (such company, we contribute to the implementation of the Agenda 2030 as IT2School – Gemeinsam IT entdecken and KiTec – Kinder and the associated goals. For example, we support the UNGC Through our societal engagement, we want to address the needs of entdecken Technik) were also offered in digital formats, allowing action platforms, including the Sustainable Finance platform in the the communities surrounding our production sites worldwide, help these educational programs to continue even as school operations form of the CFO Taskforce for the SDGs, and the Decent Work in achieve the SDGs, and have a positive long-term impact on the were restricted. In the new City4Future project launched in early Global Supply Chains action platform, in which company represen- environment and society. This is why societal engagement is a 2022, schoolchildren explore topics related to energy, climate tatives and experts discuss how respecting human and labor rights cornerstone of our corporate social responsibility. It encompasses change and sustainability through play and can develop ideas for is crucial to achieving the SDGs. With the six-month SDG Ambition the focus areas of health, skills and resources. the urban living space of the future. program, the UNGC and the German Global Compact Network (DGCN) support participating companies in aligning their sustain- We work with partners worldwide to promote public health, for In South America, BASF initiated the Connect to Transform open call ability targets more closely with the SDGs and deriving specific example, to combat malaria. Through our New Nets project in coop- and has so far supported 48 social and environmental projects, measures from them. BASF is also active in 13 local Global Compact eration with The Global Fund, Unitaid and other financial partners, such as the Geração Futura Institute’s Mão na Massa project near ® G2 mosquito nets had networks. approximately 25 million of our Interceptor our local site in the São Bernardo do Campo region. The project been distributed in African countries as of December 2021. These trains women as bakers to promote their financial and personal In 2021, we again discussed relevant sustainability topics with the were specially developed to counter insecticide resistance in the autonomy. Stakeholder Advisory Council. Focus topics included climate fight against malaria and contain two different insecticides. The protection, the energy transformation and food security. Topics dis- project goal is to distribute a total of around 35 million nets by the We aim to create long-term value for BASF and society with new cussed by the Human Rights Advisory Council, which is chaired by end of 2022. business models and cross-sector partnerships. Our Starting our Chief Compliance Officer, included particular challenges in the Ventures program helps people from low-income areas to improve battery materials value chain. At the U.N. Food Systems Summit 2021, BASF signed the Zero their economic opportunities and their quality of life. The program Hunger Private Sector Pledge and announced that it would invest also provides access to new markets and partners, and contributes $11 million in initiatives in Africa, Asia, Central and South America, to reaching the SDGs. A new internal application round for Starting such as for seed production, malaria prevention and food fortification Ventures projects was launched in October 2021. The projects,
BASF Report 2021 Management’s Report – We Value People and Treat Them with Respect 107 which aim to help improve local living conditions, then enter the German sites (€702,668 in total) to around €1.4 million. BASF implementation phase. BASF contributes both technical expertise Stiftung distributed the donations to affected private households and resources to the projects to address local challenges and and charitable institutions. In September, BASF donated $500,000 contribute to the SDGs. One project under our Starting Ventures to disaster relief following Hurricane Ida and for long-term recovery program is the Waste- 2- Chemicals project in Lagos, Nigeria. Under efforts in Louisiana. Local nonprofit organizations used $300,000 of the project, plastic waste is collected by local residents, sorted this amount for emergency relief and reconstruction. In addition, and then converted into pyrolysis oil. This pyrolysis oil is used as $200,000 went to supporting BASF employees who were directly feedstock in the production of high-quality chemical products. In impacted by the effects of the hurricane. cooperation with nonprofit organizations, this will enable local waste For more information on Starting Ventures, see basf.com/en/starting-ventures collectors and their families to earn a regular income. For more information on societal engagement at our sites, see ludwigshafen.basf.de For more information on our societal engagement around the world, see basf.com/en/engagement BASF Group expenses for societal engagement activities¹ ~€30 million In the area of international development cooperation, we support the independent charitable BASF Stiftung with donations for its projects in cooperation with various organizations. The 2021 year-end donation campaign in favor of BASF Stiftung supported the United Nations Children’s Fund, UNICEF, which celebrated its 75th anniversary. Together with the Indian organization ChildLine and other partners, UNICEF is working to provide psychosocial care for children in India who have had difficulty accessing important services as a result of the pandemic. BASF doubled the donations made by employees of participating German Group companies to a total of around €600,000. BASF also made donations to support those affected by natural disasters in 2021. In July, BASF donated €1 million to flood relief in Germany, which hit the states of North Rhine-Westphalia and Rhineland-Palatinate particularly hard. The donation went to the German Red Cross, which was active in these crisis regions. In August, BASF doubled the amount donated by employees at its 1 As of 2020, we report a total figure for our societal engagement activities. The figure includes all consolidated companies with employees, including joint operations.
In Focus: Aid Measures During the Coronavirus Pandemic BASF Report 2021 Management’s Report – In Focus: Aid Measures During the Coronavirus Pandemic 108 In focus: Continuation of Global Aid Measures During the Coronavirus Pandemic BASF launched the Helping Hands aid campaign in 2020 to help fight the coronavirus and its effects. In 2021, we continued to use our expertise in research, production, procurement and logistics to support people affected by the pandemic around the world. In April 2021, BASF opened the first accredited corporate In 2021, BASF also provided in-kind support around the world to corona virus vaccination center in Germany at its Ludwigshafen overcome the challenges posed by the coronavirus pandemic. For site. More than 22,000 primary vaccinations and more than example, BASF donated molecular sieves to the Indian government 21,000 secondary vaccinations were administered there from to facilitate the production of medical oxygen. Medical equipment, April to August and more than 10,000 booster vaccinations were including ventilators, was also donated, and acute care units were administered there in December to BASF employees, contractors set up in Mumbai together with partners. We donated medical and site partners. The coronavirus vaccination center was estab- equipment to Malaysian hospitals for the treatment of COVID-19 lished and operated by an interdisciplinary team from various BASF patients. In South America, BASF launched a food drive and coordinated by Corporate Health Management. units, donated food packages to communities around BASF sites. The food was distributed there to those in need with the help of A global working group in our Pharma Solutions business unit employees who volunteered their time. has supported pharmaceutical companies in their research on vac- For more information on the Helping Hands aid campaign, see basf.com/en/helping-hands cines and therapies to combat COVID-19 since March 2020. The task force reviews patent applications, clinical trials and scientific publications to identify potential collaborations with companies. BASF is currently supporting the global development of more than 80 therapies with its ingredients and expertise. BASF products were used to cool coronavirus vaccines. For instance, Elastopir© insulation panels were produced in cooperation with a partner in Malaysia and used to equip refrigerated ware- houses in Asia. In cooperation with various partners in Germany, ® ® Neopor and Styropor , BASF’s expandable polystyrenes (EPS), Dr. Sung Min Pyo, a pharmacist in the Nutrition & Health division and part of BASF’s were used to produce boxes to transport COVID-19 vaccines due to interdisciplinary team at the coronavirus vaccination center, is responsible for their good insulating and shock-absorbing properties. ensuring that the v accines are used as required, among other things.
BASF Report 2021 Management’s Report – We Source Responsibly 109 We Source Responsibly In this section: Supplier Management As a global business, we have a responsibility to manage our supply chain carefully. We connect with our Raw Materials suppliers to source responsibly. Our partnerships with suppliers are based on mutual value creation, as well as a reliable supply of raw materials, technical goods and services at competitive prices. Supplier Management Strategy this program, we want to systematically gather data on upstream GRI 102, 103, 204, 308, 403, 407, 408, 409, 414 Scope 3 emissions to identify medium-term measures for opti- SUPPLIERS BASF CUSTOMERS Our partnerships with suppliers are based on mutual value creation, mization (see page 130). We make our suppliers’ contribution to as well as a reliable supply of raw materials, precursors, technical sustainable development transparent for us and for our stakeholders. BASF sources a wide range of raw materials, precursors, goods and services at competitive prices.2 In doing so, we want to For more information on suppliers, see basf.com/suppliers technical goods and services. Our suppliers are an important generate long-term benefits for both sides. Our sustainability- part of our value chain. Our objective is to secure competitive oriented supply chain management is an integral part of our advantages through our professional procurement struc- risk management. We have defined our standards and processes in Global targets tures, to establish stable and reliable supply chains, and at a global guideline. We are continually refining and optimizing this to the same time, meet high ethical and environmental stan- respond to changes in the regulatory environment and new require- We actively promote sustainability in the supply chain and have set dards. Together with our suppliers, we want to improve ments resulting, for example, from new laws and initiatives at national ourselves ambitious targets for this: By 2025, we aim to have con- sustainability in the supply chain and minimize risks. and international level. Procurement management systems such as ducted sustainability evaluations for 90% of the BASF Group’s 2 guidelines and targets are set centrally and are binding for all relevant spend and will develop action plans where improvement is At a glance employees with procurement responsibility worldwide. necessary. In addition, we aim to have 80% of suppliers improve their sustainability performance upon re-evaluation by 2025. In €43.5 billion 85% Our risk-based approach aims to identify and evaluate sustainability 2021, 85% of the relevant spend had been evaluated. Of the sup- matters in our value chains as best possible to improve sustain ability pliers re-evaluated in 2021, 74% had improved. Both global targets global procurement spend of relevant spend1 covered by together with our suppliers. We regularly review and document are embedded in the target agreements of persons responsible for sustainability evaluations progress based on the risk level. Employees with procurement procurement. ▪ Sustainability-oriented supply chain management responsibility receive ongoing training in sustainability-oriented ▪ Global targets to increase sustainability in the supply chain supplier management and responsible procurement. In 2021, 250 BASF employees received such training. Worldwide procurement ▪ Supplier Code of Conduct creates transparency ▪ Risk-based approach with clearly defined follow-up processes Our expectations of our suppliers are laid down in the global Our more than 70,000 suppliers make an important contribution to Sup plier Code of Conduct. This creates clarity around the standards our value creation. We work in long-term partnership with compa- to be met. We count on reliable supplier relationships and nies from different industries around the world. They supply us with support our suppliers in implementing our requirements. In 2021, raw materials, precursors, investment goods and consumables, we also launched the Supplier CO Management Program. With perform a range of services and are innovation partners. 2 1 We understand relevant spend as procurement volumes with relevant suppliers. We define relevant suppliers as Tier 1 suppliers showing an elevated sustainability risk potential as identified by our risk matrices, our purchasers’ assessments or other sources. 2 BASF considers all direct suppliers of the BASF Group in the business year concerned as Tier 1 suppliers. These are suppliers that provide us with raw materials, investment goods, consumables and services. Suppliers can be natural persons, companies or legal persons under public law.
BASF Report 2021 Management’s Report – Supplier Management 110 2025 target electronic ordering systems and purchasing conditions across the Good to know Group. We revised our Supplier Code of Conduct in 2021 and 90% 80% added our expectations around the procurement of conflict minerals (tin, tantalum, tungsten, their ores and gold). Around 5,900 new Share of relevant spend covered Percentage of suppliers suppliers committed to the Code of Conduct in 2021. by sustainability evaluations with improved sustainability performance upon re-evaluation BASF conducts audits and assessments to ensure that suppliers reserves comply with the applicable laws, rules and standards. BASF We acquired raw materials, goods and services for our own produc- the right to discontinue business relationships for non-adherence to tion worth approximately €43.5 billion in 2021. Of this, around 90% international principles. The same applies to failure to correct viola- Together for Sustainability (TfS) 1 was procured locally. There were no substantial changes to our tions, or for displaying patterns of non-compliance with these stan- supplier structure. dards. Our Code of Conduct expressly points out that potential BASF is a founding member of Together for Sustainability (TfS). violations of laws, rules or standards can be reported – including The initiative was established in 2011 to improve sustainability in anonymously – to our compliance hotlines. Each case is docu- the supply chain. The focus is on standardizing and simplifying What we expect from our suppliers mented and investigated, and appropriate measures are taken as supplier audits and evaluations globally. This increases trans- necessary. parency and creates synergies: Suppliers only have to complete Together with our suppliers, we want to improve sustainability in the an assessment process once. The results are then made available supply chain. Consequently, we expect our suppliers to comply with to all TfS members and are mutually recognized – saving time and the applicable laws in full and to adhere to internationally recognized Selection and evaluation of our suppliers money for both parties. Suppliers are evaluated by independent environmental, social and corporate governance (ESG) standards. experts either in on-site audits or online assessments. The latter We also expect our suppliers to make an effort to enforce these New suppliers are selected and existing suppliers are evaluated not are conducted by EcoVadis, a ratings agency specialized in sus- standards at their suppliers. In addition, we ask our suppliers to only on the basis of economic criteria, but also ESG standards. As tainability analyses. acknowledge, support and abide by our Supplier Code of Conduct such, selection, evaluation and auditing is an important part of our – or to demonstrate and ensure their commitment to the principles sustainable supply chain management. Processes and responsi- A new program on Scope 3 emissions was launched in 2021. The specified in the Code of Conduct, for example in their own code of bilities are defined in a global guideline. Due to the large number of aim is to develop a methodology for the chemical industry to conduct. suppliers, they are evaluated based on risk. We take into account calculate upstream greenhouse gas emissions in particular. TfS the materiality of the supply relationship and country and industry- members can use this data to implement and manage emissions Our global Supplier Code of Conduct is founded on internationally specific risks. We also use observations from our employees in reduction programs. recognized guidelines, such as the principles of the United Nations’ procurement and information from internal and external databases, At the end of 2021, TfS had 34 members with a combined Global Compact, the U.N. Guiding Principles on Business and such as TfS assessments. procurement spend of around €267 billion. A total of 284 audits Human Rights, the International Labor Organization (ILO) conven- and 5,817 online assessments were performed. As a TfS mem- tions and the topic areas of the Responsible Care initiative. Topics We have suppliers with a high potential sustainability risk evaluated ber, BASF itself is assessed and in 2021 was ranked among the covered by the Code of Conduct include compliance with human by third parties, either through sustainability evaluations or on-site top 1% companies worldwide in the sustainable procurement rights, the exclusion of child and forced labor, safeguarding labor audits. The list of suppliers to be assessed is updated every year. category. and social standards, antidiscrimination and anticorruption policies, Sustainability evaluations and on-site audits are mainly conducted For more information on Together for Sustainability, see tfs-initiative.com and protecting the environment. The Code of Conduct is available in according to the TfS framework. A total of 86 raw material supplier the most relevant languages for our suppliers and integrated into sites were audited on sustainability standards on our behalf in 2021. 1 “Local” means that a supplier is located in the same region (according to BASF’s definition) as the procuring company.
BASF Report 2021 Management’s Report – Supplier Management 111 We received sustainability evaluations for 701 suppliers. We also groups in 2021. It also facilitated direct dialog between Sibanye- We review our suppliers’ progress according to a defined timeframe take into account other certification systems and external audits, Stillwater and nongovernmental organizations active in this area. based on the sustainability risk identified, or after five years at the such as from the Roundtable on Sustainable Palm Oil, when latest. In the case of ongoing, serious violations of the standards assessing our suppliers. Depending on business requirements, we We discuss sustainability matters with our supplier Nornickel and defined in our Supplier Code of Conduct or international principles, additionally conduct our own Responsible Care audits at selected other aspects relevant to our cooperation on a monthly basis. These we reserve the right to impose commercial sanctions. These can go suppliers (see page 117). include current events and the findings from the mining-specific TfS as far as termination of the business relationship. In 2021, this hap- audits. In 2021, TfS audits were carried out at Nornickel’s site in pened in three cases. Polar, Russia. Nornickel seeks to join various industry initiatives that Audit results provide third-party verification of mining and responsible procure- ment standards, such as the International Council on Mining and We carefully analyze the results of our assessments and document Metals (ICMM) or the Initiative for Responsible Mining Assurance them in a central database. The on-site supplier audits conducted (IRMA). In addition, topics relevant to stakeholders were discussed in over the past few years have identified some need for adjustment meetings with interest groups. The dialogs continue in various forms. with respect to environmental, social and corporate governance standards, for example in waste management or deviations in occu- pational health and safety measures and standards under labor law. Supplier development Follow-up audits in 2021 identified improvements, for example, a reduction in health and safety risks following the implementation of We use TfS evaluations to pursue a risk-based approach with clearly appropriate measures and compliance with labor law requirements. defined, BASF-specific follow-up processes. If we identify deviations In 2021, none of our audits identified any instances of child labor or from standards, we ask suppliers to develop and implement dangerous work and overtime performed by persons under 18. corrective measures within a reasonable time frame. We support them in their efforts, for example by training employees from 31 sup- We maintained close dialog with our South African platinum supplier pliers in China on ESG topics in 2021 as part of a partnership with 1 in 2021 on the results of the audit from 2020, the Sibanye-Stillwater the East China University of Science and Technology. In South implementation of the resulting action plan, and other relevant America, around 190 suppliers took part in a diversity talk on gender topics. This includes working with all stakeholders, including local equality in the supply chain, and around 340 suppliers attended a authorities, to take a unified approach to community development. webinar on ethical principles, legislation and human rights in the Almost all the needs for adjustment identified by the audit had been supply chain. implemented by the end of 2021. BASF and Sibanye-Stillwater continue to discuss the progress made four times a year and also As part of TfS, training was also developed for suppliers undergoing use this as a platform for dialog on other sustainability topics. a sustainability evaluation for the first time and for suppliers that Sibanye-Stillwater is a member and supporter of the International already have a sustainability rating but have potential for improve- Platinum Group Metals Association (IPA) sustainability initiative that ment in ESG performance. In 2021, more than 1,800 participants was co-founded by BASF. The initiative’s measures include con- attended online TfS training on this topic in different languages. TfS ducting comprehensive sustainability audits and sharing factors for is also developing a global learning platform for buyers and sup- success. BASF continued its regular dialog with local stakeholder pliers, which will provide various (online) training opportunities on specific sustainability topics. It is scheduled for launch in 2022. 1 In 2012, an extended strike at a platinum mine in Marikana, South Africa, culminated in a violent confrontation between mine workers and armed South African police. Employees of the former mine operator, Lonmin, were among the fatalities. Ownership of the Marikana mine was transferred to Sibanye-Stillwater in 2019. For more information on the supplier relationship with the Sibanye-Stillwater mine, see basf.com/en/marikana
BASF Report 2021 Management’s Report – Raw Materials 112 Raw Materials Our expectations of our suppliers are laid down in our Supplier Code recyclability of plastics, which saves fossil resources and avoids CO 2 GRI 102, 103, 203, 301, 304, 308, 413, 414 of Conduct (see page 109). We take a closer look at suppliers in emissions. SUPPLIERS BASF CUSTOMERS critical supply chains, for example mineral raw materials, renewable For more information on our supplier management, see page 109 onward resources such as palm kernel oil, a number of pigments and highly For more information on the circular economy, see page 44 In 2021, BASF purchased a total of around 35,000 different toxic substances. Upstream stages of the value chain are assessed raw materials from more than 6,500 suppliers. Using resources for serious sustainability risks and, if necessary, suitable remedial as efficiently and responsibly as possible and the concept of measures are identified. In addition, we develop and test approaches Fossil and petrochemical resources the circular economy are firmly embedded in our strategy to make the supply of raw materials more sustainable in joint and our actions, for example, by our Verbund structure and initiatives with suppliers and other partners. Examples include our BASF’s most important raw materials (based on volume) include gas the increased use of renewable and recycled feedstocks. We cooperative ventures and investments to recycle batteries (see and crude oil-based petrochemical products such as naphtha and expect our suppliers to source and produce raw materials page 30) and our joint activities on certified sustainable supply benzene. We mainly use liquid gas and natural gas to generate responsibly. chains for renewable raw materials such as palm, palm kernel and energy and steam, and to produce key basic chemicals such as castor oil. ammonia or acetylene. Naphtha is mainly fed into our steam cracker, At a glance where it is split into products such as ethylene and propylene – both BASF’s Verbund concept is key to making the use of raw materi- important feedstocks for numerous value chains. We use aromatics 35,000 1.3 million als in our own processes as efficient as possible: Intelligently linking such as benzene or toluene to manufacture engineering plastics, different raw materials and steering our plants and processes creates efficient value chains. among other products. Thanks to a high degree of forward and purchased metric tons By-products from one facility are used as feedstocks elsewhere. backward integration, we can produce many feedstocks for our renewable raw materials This saves raw materials and energy (see page 128). At the same value chains efficiently while conserving resources within the BASF purchased time, the Verbund offers many opportunities to use renewable and Verbund. This increases supply security and reduces dependence recycled raw materials. We want to better leverage this potential on external supply sources to just a few key raw materials. We ▪ BASF’s Verbund concept enables the efficient use of resources going forward. For example, we are driving forward chemical recy- source these from different suppliers to minimize supply risks. TM ▪ Recycled and renewable raw materials are gaining in importance cling of mixed plastic waste and used tires in our ChemCycling ▪ Numerous projects to improve supply chain sustainability project (see page 115). As part of our efforts to improve sustainability, we are continuously investigating whether fossil and petrochemical resources can be Resource efficiency and stewardship are also becoming increasingly replaced with non-fossil alternatives. We carefully consider eco- important topics for our customers. That is why we are constantly nomic, environmental and social aspects, as well as other important Strategy working to reduce the resources consumed in the manufacturing of criteria like supply security and product safety. Our aim is to increase our products, for example through more efficient processes, inno- the share of renewable and recycled feedstocks in our value chains. Our strategy covers the entire value chain – from responsible vative technologies and the use of renewable and recycled raw This brings with it challenges and compromises in the supply of both procurement and the efficient use and recycling of raw materials in materials. This enables us to offer our customers solutions that energy and resources for carbon-based organic chemistry. For our processes to developing resource-saving solutions for our cus- make a greater contribution to sustainability, like a smaller carbon example, the use of renewable energy can involve additional costs, tomers. We want to decouple growth from resource consump- footprint and better biodegradability. Our products also improve our which can have an impact on competitiveness. Another area of tion with process and product innovations to accelerate the shift customers’ resource efficiency and sustainability in many areas. For conflict arises, for example, when the increased consumption of toward closed-loop value creation systems. Alongside economic, example, BASF additives increase the service life and mechanical renewable raw materials leads to greater land use. We raise aware- environmental and social criteria, we also consider aspects such as ness of these trade-offs through close dialog with our stakeholders. product safety and supply security when selecting suppliers and raw We are also involved in sustainability initiatives to develop and imple- materials. ment solutions in cooperation with partners.
BASF Report 2021 Management’s Report – Raw Materials 113 Good to know Renewable resources In addition to fossil resources, we employ renewable raw materials, mainly based on vegetable oils, fats, grains, sugar and wood. In 2021, we purchased around 1.3 million metric tons of renewable raw materials. For instance, we use renewable resources to produce ingredients for the detergent and cleaner industry, or to source natu- ral active ingredients for the cosmetics industry. We also use renew- able feedstocks such as biomethane and bio-naphtha in our Verbund as an alternative to fossil resources. The mass balance approach allows us to allocate the amount of renewable resources used to a wide variety of end products (see box at left). Examples ® ® include the Acronal Eco and Joncryl MB biomass balance binders ® for solvent-free paints and coatings, the HySorb Biomass Balanced ® superabsorbent, various biomass balance versions from the Trilon , ® ® Sokalan and Protectol product lines for the detergent and cleaner ® industry, and the biomass balance versions of our Styropor , Neopor® and Styrodur® insulation materials. The mass balance approach As for fossil raw materials, we also consider how renewable resources impact sustainability topics along the value chain. Many BASF value chains start in syngas plants or steam crackers, Mass balance products are identical in quality to conventionally Alongside positive effects like saving greenhouse gas emissions, where fossil resources, mostly natural gas and naphtha, are con- produced products but have a better sustainability balance due to these can also have negative effects on areas such as biodiversity, verted into hydrogen and carbon monoxide or important basic the use of bio-based or recycled raw materials. This method has land use or working conditions, depending on the raw material. This chemicals such as ethylene and propylene. These are used to already been applied to over 700 BASF products (2020: ~200 prod- is why we carefully weigh the advantages and disadvantages of create thousands of products in the BASF Verbund. Alongside fossil ucts), for example, engineering plastics such as polyamide, super- using renewable resources, for example using Eco-Efficiency Ana- resources, bio-based and recycled raw materials such as biometh- absorbents, dispersions and intermediates. We share our expertise lyses. We also take recognized certification standards such as the ane, bio-naphtha or pyrolysis oil can be used as feedstocks in our in numerous stakeholder platforms, such as the European Commis- Roundtable on Sustainable Palm Oil into account in our decisions. plants. Due to the simultaneous processing of fossil, bio-based and sion’s Circular Plastics Alliance, to harmonize and standardize recycled feedstocks, the raw materials cannot be directly assigned different allocation methods and certification schemes for mass We want to minimize raw material-specific risks and increase sus- to resulting derivatives. The share of bio-based or recycled raw balance products. tainability in our supply chains with measures, projects and targeted materials can however be allocated to derivatives using the mass For more information, see basf.com/massbalance involvement in initiatives. Our activities here concentrate on value balance approach, which is audited by a third party, and certifica- chains that are relevant quantitatively or that do not yet have certifi- 2 tion (such as the REDcert standard for the chemical industry). It is cation standards. We are also working on product innovations and similar in principle to green power, which has been established for on enhancing our production processes to improve the profitability many years: Energy from renewable sources is fed into the grid and and competitiveness of renewable resources. For example, we are then charged to individual customers. developing innovative processes such as biocatalysis and fermen- tation for the production of vitamins and enzymes; and we are
BASF Report 2021 Management’s Report – Raw Materials 114 driving forward white biotechnology for the production of chemical sustainable products in accordance with the RSPO’s mass balance SuCCESS, the Sustainable Castor Association (SCA), which was components from renewable resources. supply chain model. This helps our customers meet their obligations launched in 2019 by the founders of the Pragati initiative, has also to customers, consumers and stakeholders. developed a sustainability code for the wider supply chain. This will Palm oil, palm kernel oil and their derivatives are some of our allow castor beans obtained from the program to be further pro- most important renewable raw materials. We mainly use these raw We source most of our palm-based raw materials from Malaysia and cessed into certified castor oil and derivatives and to be introduced materials to produce ingredients for the cosmetics, detergent, Indonesia. Smallholders account for around one-third of the total into the downstream supply chain. We were able to source the first cleaner and food industries. We aim to ensure that palm-based raw volumes produced there. We have worked together with The Estée certified sustainable castor oil from the program in 2021 following materials come from certified sustainable sources. To this end, we Lauder Companies, the RSPO and Solidaridad in Indonesia since the successful audit of our supply chain by an independent certifica- have endorsed the Roundtable on Sustainable Palm Oil (RSPO) 2019 to expand our supplier base for RSPO-certified palm oil prod- tion body. In the coming years, we want to increase the share of this since 2004 and are engaged in other national and international ini- ucts while strengthening smallholder structures and sustainable oil in our total demand. tiatives, such as the German Forum for Sustainable Palm Oil, the production methods at local level. The project in the province Polish coalition Polska Koalicja ds. Zrównowazonego Oleju of Lampung supports around 1,000 independent smallholders in Our bioactives for cosmetics are based on plants. Through sus- Palmowego and the High Carbon Stock Approach organization. improving their livelihoods and the sustainable production of palm oil tainable sourcing practices, we aim to preserve ecosystems and Based on our Group-wide Supplier Code of Conduct (see page 109), and palm kernel oil. The focus is on efficient and sustainable farming enable sustainable management for those who depend on them. To we have outlined our expectations of suppliers in the palm-based practices and health and safety standards. The goal is for at least this end, we have set up various programs that unite economic, value chain in an additional sourcing policy (BASF Palm Sourcing one-third of program participants to become certified according to ecological and social aspects in holistic approaches. One example Policy). This addresses aspects such as forest and peat conserva- the RSPO Smallholder Standard in three years. is our rambutan program in Vietnam’s Dong Nai province. We have tion, respect of human and labor rights, smallholder inclusion, and been collaborating since 2014 with two local small plantations which certification and traceability standards. The annual BASF Palm Also important for BASF, albeit at a much smaller scale, is castor supply us with sustainably produced, organically certified raw mate- Progress Report reports on our measures and progress toward oil. We use castor oil to manufacture products such as plastics and rials. Upcycling the rambutan tree’s shells, leaves and seeds, previ- more sustainability and transparency in the value chain. ingredients for paints and coatings, as well as products for the ously disposed of as waste, creates new income streams for farmers cosmetics and pharmaceutical industries. With the aim of estab- and expands our portfolio of natural active ingredients. The partner- We purchased 242,946 metric tons of palm oil and palm kernel oil in lishing a certified sustainable supply chain for castor oil, we launched ship focuses in particular on responsible farming practices and 2021 (2020: 227,213 metric tons). We again met our own voluntary the Sustainable Castor Initiative – Pragati in 2016 together with the social inclusion, including gender equality, safe working conditions commitment to source only RSPO-certified palm oil and palm kernel companies Arkema and Jayant Agro and the NGO Solidaridad. The and fair incomes. oil. This avoided more than 330,000 metric tons of CO emissions initiative is intended to improve the economic situation of castor 2 compared with the procurement of conventional palm oil and palm bean farmers in India and, at the same time, raise awareness of Another example of sustainable supply chains and responsible inno- kernel oil. By 2025, we aim to extend our voluntary commitment sustainable farming methods. Around 80% of the world’s castor vation is our Castaline™ product, derived from the leaves of chest- 1 to sustainable procurement to the main intermediate products beans are produced in India, mainly by smallholders. As part of nut trees. These are harvested in late summer by forest owners in based on palm oil and palm kernel oil. We were able to trace 96% Pragati, smallholder farmers receive training on topics such as culti- France. The chestnut forests are organically certified and are mainly of our global palm footprint to oil mill level as of the end of 2021 vation methods, efficient water use, health and the safe use of crop used for the cultivation of chestnuts. By upcycling the leaves as a 2 (2020: 95% ). In addition, we continued to drive forward the RSPO protection products based on a specially developed sustain- by-product of chestnut extraction, we generate additional income supply chain certification of our sites for cosmetic ingredients. At the ability code, SuCCESS. Since the project was initiated, more than opportunities for forest owners and provide our customers with a end of 2021, 26 production sites worldwide were certified by the 5,800 smallholders and over 13,300 hectares of land have been product of completely natural origin. We are pursuing other similar RSPO (2020: 25). In line with raised awareness for sustainability, certified for sustainable castor cultivation. Yields from this land were we continue to see growing demand for certified palm-based prod- 35% higher than average amounts for the region published by the ucts from our customers. We are expanding our range of certified local government for the 2020/2021 harvest cycle. In addition to 1 Fractions and primary oleochemical derivatives as well as vegetable oil esters 2 The figure for 2020 was adjusted from 96% to 95% due to a data correction.
BASF Report 2021 Management’s Report – Raw Materials 115 initiatives, for example, in Morocco for our argan-based products, subject matter is the assessment of a joint investment in a pyrolysis metals from scrap of cell manufacturers and battery material pro- and in India for our active ingredients based on the moringa tree. plant for plastic waste. ducers that do not meet product specifications. For more information on biodiversity, see page 138 onward For more information on the circular economy, see page 44 For more information on our voluntary commitment to palm oil products and the Palm Progress We have also made further progress with the chemical recycling of Report, see basf.com/en/palm-dialog used mattresses made of flexible polyurethane. It is based on a wet chemical process developed by BASF. After initial successful trials, Mineral raw materials our teams continued developing the process in 2021. Precursors Recycled feedstocks recovered from old mattresses can now be used to produce new We procure a number of mineral raw materials, which we use to mattress-sized blocks of flexible polyurethane foam. The new pro- produce automotive and process catalysts or battery materials, Recycling is becoming increasingly important due to limited resources, cess is currently being optimized and tested on a larger scale. among other products. We are continually improving our products growing sustainability requirements in the markets and regulatory and processes to minimize the use of primary mineral raw materials. developments. We want to increase the use of recycled feedstocks We have many years of experience and a high degree of specializa- At the same time, we are driving forward the recycling of mineral raw with our Circular Economy Program: From 2025 onward, we aim to tion in recycling precious metals such as platinum, palladium materials, for example, by recovering platinum metals from auto- process around 250,000 metric tons of recycled and waste-based and rhodium. They are used in automotive catalysts as well as in motive and process catalysts and using these as secondary raw materials every year worldwide, replacing fossil raw materials process and chemical catalysts. We primarily use the precious resources (see “Recycled feedstocks”). (see page 44). metals recovered in this way as feedstocks in catalyst production. With the expansion of our refinery plant in Seneca, South Carolina, Sourcing mineral raw materials responsibly is important to BASF. We A focal point of our activities here is chemically recycling plastic and the acquisition of assets from Zodiac Enterprises in Caldwell, implemented measures to meet the requirements of the E.U. Conflict waste. This technology complements mechanical recycling and can Texas, we are further expanding our leading position in platinum Minerals Regulation by the January 1, 2021 deadline. This defines help to reduce the amount of plastic waste that is disposed of in group metal recycling. supply chain due diligence for tin, tantalum, tungsten, their ores and landfill or thermally recovered. Chemical recycling breaks down gold (3TG) imported into the E.U. from conflict-affected and high- plastics into their building blocks or converts them into basic chemi- The growing demand for electromobility is also increasing the need risk areas (CAHRAs). To supplement our Supplier Code of Conduct cals. Different methods are used to achieve this. for lithium-ion battery recycling. As a leading producer of battery (see page 109), we introduced a Group-wide Supply Chain Policy materials with future local production capacities in the three main for Conflict Minerals in 2021. It contains expectations for our TM project, our technology partners use the In our ChemCycling markets – Asia, Europe and North America – BASF has in-depth suppliers from CAHRAs and outlines voluntary commitments. pyrolysis process to extract pyrolysis oil from mixed plastic waste or expertise in battery chemistry and process technology. We are used tires, which were not previously recycled. We can feed this utilizing these competencies to address battery recycling as an In addition to responsible procurement of the 3TG minerals, BASF is pyrolysis oil into our Verbund as an alternative to fossil raw materials additional growth market in cooperation with partners along the committed to responsible and sustainable global supply chains for and use it to make new products. These have exactly the same value chain (see page 30). In this way, we want to ensure that valu- other mineral raw materials as well. These include cobalt, a key properties as products manufactured from fossil feedstocks. We able metals remain in the production cycle for as long as possible. component in the production of battery materials for electric vehi- use a certified mass balance approach to allocate the percentage This conserves resources while enabling production of cathode cles, among other applications. Our cobalt supply chain is organized of recycled content to the end product (see page 113). In 2021, active materials in Europe with a significantly lower carbon footprint according to special sustainability criteria. Our goal is to not purchase TM we were able to further expand our portfolio of these Ccycled compared with the industrial standard. At the Schwarzheide site in cobalt from artisanal mines and to exclude this in supply chains as products. It now comprises around 50 products that our customers Germany, where a cathode active materials plant is already under long as responsible artisanal production cannot be verified. use, for example to manufacture transport cases for medicine, construction, we will also build a prototype plant for battery recycling high-performance plastics for the automotive industry, packaging by 2023. The prototype plant will allow for the development of new Together with BMW, Samsung SDI, Samsung Electronics, Volks- materials and functional textiles. We also signed a memorandum of operating procedures and optimization of technology to deliver wagen and the German Agency for International Cooperation (GIZ), understanding in 2021 with our technology partner Quantafuel and superior recovery rates of lithium, nickel, cobalt and manganese we have been involved in the cross-industry Cobalt for Develop- Remondis, a global leader in waste and water management. Its from end-of-life lithium-ion batteries. The plant will also recycle ment initiative since 2018. It aims to improve working and living
BASF Report 2021 Management’s Report – Raw Materials 116 conditions for artisanal miners in the Democratic Republic of Congo. pledge with the ILO campaign against child labor, also focusing on To achieve this, the initiative offers programs such as training on the Democratic Republic of Congo. BASF is also an active member important environmental, social and governance aspects of respon- of the Responsible Minerals Initiative. sible mining practices. Since October 2020, 14 mining cooperatives in Kolwezi have participated in training on topics such as occupa- Furthermore, together with Daimler, Fairphone, and Volkswagen, we tional safety and environmental management. Cobalt for Develop- launched the Responsible Lithium Partnership in 2021. It advo- ment also works closely with local NGOs and the Good Shepherd cates for the responsible use of natural resources in Chile’s Salar de International Foundation to create additional income opportunities Atacama, home to the world's largest lithium reserves and a signifi- for families and improve access to education. The joint activities are cant portion of global production. As a first step, the German beginning to show results according to an evaluation of the initiative: Agency for International Cooperation (GIZ) was commissioned to Participants of the program since its launch have seen an increase organize a local multi-stakeholder platform on the opportunities and in average income and savings. Since construction of the new pub- risks of lithium mining and other economic activities such as copper lic primary and secondary schools in Kisote, the majority of children mining and tourism. The goal of the platform is to reach a common have enrolled in school. Overall, several thousand members of the understanding on the status quo and to jointly develop a vision for participating communities are already benefiting. In 2021, the initia- the future of the Salar de Atacama watershed. In addition, potential tive also made an action pledge to eliminate child labor as part of a risks are to be mitigated and opportunities promoted through the global campaign by the International Labor Organization (ILO). Three development and implementation of joint action plans. mining cooperatives around Kolwezi are receiving assistance to implement occupational safety measures and a zero-tolerance Another mineral raw material that BASF processes is mica. We use policy against child labor. both raw mica and effect pigments derived from mica, mainly in the production of coatings. BASF is conscious of its social responsibility We signed a long-term supply agreement with Nornickel for nickel with regard to mica sourcing and applies high standards which, and cobalt from a metal refinery in Finland. The agreement ensures among other things, exclude child labor. Suppliers are asked to locally sourced and secure supply of raw materials for battery mate- source mica in accordance with our Supplier Code of Conduct. As rial production in Europe. In cooperation with Eramet, we are also a member of the Responsible Mica Initiative (RMI), we advocate for assessing the development of a state-of-the-art hydrometallurgical the eradication of child labor and unacceptable working conditions, refining complex in Indonesia, which is expected to secure access specifically in India’s mica supply chain. The initiative focuses on to more sustainably sourced nickel and cobalt as of the mid-2020s. labor standards, strengthening local communities and legal frame- works. According to an RMI study, activities in the relevant regions We are also involved in various international initiatives to strengthen of India have already led to improved income and living conditions. sustainability and innovation in the value chain for batteries. These These include improved access to clean drinking water through the include the Global Battery Alliance (GBA), which we co-founded installation of pumps and filtration systems and improved access to in 2017. It promotes dialog between business, government and health care through doctors’ visits in villages and enrollment in public civil society and develops standards and tools to create a socially health insurance plans. responsible, ecological and economically sustainable, and inno- For more information on the Cobalt for Development project, see basf.com/cobalt-initiative and vative value chain for batteries. For instance, BASF is working with cobalt4development.com/ the GBA on the GBA Battery Passport. In the future, this “digital twin” For more information on the Global Battery Alliance, see globalbattery.org will contain information on the sustainability of a battery to increase For more information on the Responsible Mica Initiative, see responsible-mica-initiative.com transparency in the value chain. The GBA, as well, made an action
BASF Report 2021 Management’s Report – Our Management Systems 117 We Produce Safely and Efficiently In this section: Protecting people and the environment is our top priority. Our core business – the development, production, EHSQ Management Systems processing and transportation of chemicals – demands a responsible approach. We address environmental, Health and Safety, Emergency Response health and safety risks with a comprehensive Responsible Care Management System. We expect our employees Product Safety and partners to know the risks of working with our products, substances and plants and to handle these Transportation Safety responsibly. Energy and Climate Protection Emissions to Air, Waste and Remediation Water Biodiversity Our Management Systems Responsible Care Management System Quality Management System GRI 102, 103, 303, 305, 306, 307, 403, 410, 418 Our EHS management approach covers the different stages of our Our Quality Management System comprises our EHSQ policy as SUPPLIERS BASF CUSTOMERS value chain – from the transportation of raw materials to production well as further standards, guidelines and processes for quality man- BASF is actively involved in the International Council of at our plants, activities at our sites and warehouses, and distribution age ment along the value chain. Our Quality Management System is ® Chemical Associations’ global Responsible Care initiative. of our products down to our customers’ application of our products. risk-based, process-oriented and focused on customer satisfaction. We reaffirmed our commitment to the guiding principles of The Environmental Protection, Health & Safety unit in the Corporate Its mandatory elements are set out in a Corporate Requirement. ® Global Charter in the initiative and the Responsible Care Center defines Group-wide management and control systems and These include core processes such as nonconformance manage- 2021. Our Responsible Care Management System comprises monitors compliance with internal requirements and legal regula- ment, change management and the performance of internal audits. the global directives, standards and procedures for environ- tions, while the sites and legal entities implement these requirements Local implementation of the requirements is the responsibility of our mental protection, health and safety (EHS). At the same time, locally. Our global network ensures that information and insights business units and sites. our Quality Management System ensures the high quality are shared across the BASF Group on an ongoing basis. Our poli- of our products, processes and services, and enables our cies and requirements are continuously updated. We also maintain employees to best meet our customers’ needs. dialog with government institutions, associations and international Responsible Care audits organizations for this reason. We set ourselves ambitious goals for At a glance environmental protection, health and safety (see page 36) and regu- Regular audits help ensure that our safety, security, health and envi- larly review our performance and progress with audits. We assess ronmental protection standards are met. We conduct regular audits 143 audits €239 million the potential risks and weaknesses of all our activities – from every three to six years at all BASF sites and at companies in which to monitor performance and invested in environmental research and production to logistics – and the potential effects of BASF is a majority shareholder. We take a risk-based approach progress protection plants and facilities these on the safety and security of our employees, the environment and use an audit database to ensure that all sites and plants world- or our surroundings. We use databases to document accidents, wide are regularly audited. We have defined our regulations for ▪ Global EHS guidelines and standards near misses and safety-related incidents at our sites as well as along Responsible Care audits in a global Corporate Requirement. ▪ Quality management with a focus on customer satisfaction our transportation routes to learn from these; appropriate measures are derived according to specific cause analyses. Newly acquired sites and companies are audited after the integra- ▪ Risk-based site audits tion phase is complete, generally within one to two years depending on complexity and size.
BASF Report 2021 Management’s Report – Our Management Systems 118 During our audits, we create a safety and environmental profile Costs and provisions that shows if we are properly addressing the existing hazard poten- tial. If this is not the case, we agree on measures and monitor their We continuously invest in reducing the impact of our actions on implementation, for example, with follow-up audits. the environment. We also establish appropriate provisions for envi- ronmental protection measures and the remediation of active and In the BASF Group in 2021, 143 environmental and safety audits former sites. were conducted at 71 sites (2020: 112 audits at 60 sites). The sites were audited based on their individual risk profile. Auditing of the sites acquired from Solvay could not start in late 2021 as planned Costs and provisions for environmental protection in the BASF Group due to the coronavirus pandemic. These audits will be performed Million € in 2022. 2021 2020 Operating costs for environmental 1,133 1,125 protection In 2021, 13 sites were audited on occupational medicine and health protection (2020: 1). Online audits were conducted for 10 Investments in new and improved environmental protection plants and 239 231 of these sites. These remote audits focused on documented facilitiesa processes and management systems. Provisions for environmental protection 926 693 measures and remediationb For more information on occupational health and safety, see page 119 onward ® a Investments comprise end-of-pipe measures as well as integrated environmental protection measures. For more information on Responsible Care , see basf.com/en/responsible-care b Values shown refer to December 31 of the respective year. For more information, see Notes 9 and 23 on pages 224 and 260 External certification We pursue a decentralized certification approach for our busi- ness units and subsidiaries. This takes into account local needs, internal and legal requirements, and our customers’ requirements. Our Responsible Care audit system complies with the ISO 19011 standard and is certified according to ISO 9001. Worldwide, 130 BASF production sites are certified in accordance with ISO 14001 and EMAS (Eco-Management and Audit Scheme) (2020: 128). In addition, 54 sites worldwide are certified in accordance with OHSAS 18001 or ISO 45001 (2020: 51). Several BASF sites also have an ISO 17020 accredited inspection body for user inspection or an ISO 17025 accredited analytical laboratory for environmental emissions analyses. Based on our customers’ requirements, quality management at our production sites is generally certified according to external interna- tional standards such as ISO 9001, GMP, FAMI QS or IATF 16949.
BASF Report 2021 Management’s Report – Health and Safety, Emergency Response 119 Health and Safety, Emergency Response requirements. The Environmental Protection, Health & Safety unit in end devices and special apps for day-to-day tasks such as safety GRI 102, 103, 403, 410, 413, 418 the Corporate Center conducts regular audits to monitor this. As inspections, which continuously improves the efficiency and quality SUPPLIERS BASF CUSTOMERS part of our continuous improvement process, we regularly monitor of our processes. Other areas of application for digital solutions progress toward our goals. We have defined our reporting indicators include efficiently simulating maintenance and production processes For occupational and process safety as well as corporate in accordance with the reporting standard developed by the Interna- in digital plant models and predictive maintenance. At the Lud- security and health and environmental protection, we rely tional Council of Chemical Associations. wigshafen site in Germany, for example, over 40 plants already use on comprehensive preventive measures and expect the predictive maintenance models to monitor plant components such cooperation of all employees and contractors. Our safety and We promote risk awareness for every individual with measures as compressors, pumps and heat exchangers. security concepts serve to protect our employees, contrac- such as systematic hazard assessments, specific and ongoing tors and neighbors, to prevent property and environmental qualification measures and a wide range of safety initiatives. We damage, and to protect information and company assets. analyze accidents and incidents as well as their causes and conse- Occupational safety quences in detail at a global level to learn from these. Hazard At a glance assessments and the risk minimization measures derived from them Our aim is to reduce the worldwide lost-time injury rate to no more 1 by 2025. To prevent work- are an important prevention tool. We also promote regular dialog than 0.1 per 200,00 working hours 0.3 0.3 across different sites to strengthen risk awareness among our related accidents, we encourage and promote risk-conscious Lost-time injuries Process safety incidents employees and contractors, to learn from examples of good prac- behavior and safe working practices, learning from incidents and per 200,000 working hours per 200,000 working hours tice and in this way, continually develop our safety culture. regular dialog. We are constantly refining and enhancing our require- ments and training. ▪ Global health and safety standards Leaders are important role models for employees, which is why ▪ Strengthening risk awareness and mindful behavior environmental protection, health, safety and security are discussed 2025 target with newly appointed senior executives. Senior executives with a ▪ Intensive dialog on safety topics particular responsibility for such topics, for example, in production, Reduce the worldwide ▪ Regular review of safety concepts, emergency systems and crisis also receive specific further training to be able to meet their respon- lost-time injury rate per management structures sibilities. Due to the restrictions caused by the coronavirus pan- 200,000 working hours ≤ 0.1 ▪ Comprehensive protection measures against third-party demic, the seminars for senior executives were held virtually in 2021. interference Other events and initiatives in 2021 also focused on the high rele- vance of safety topics and dialog among our leaders. These included In addition to the legally required briefings, BASF requires new regular town halls for senior executives, the Lead with Safety initia- employ ees and contractors to complete compulsory health and Strategy tive in North America and the Visible Leadership in EHS @ CP safety training, as well as regular training on the safe handling of initiative in the Petrochemicals division. chemicals and the correct use of personal protective equipment for The safety of our employees, contractors and neighbors, and pro- employees at our production sites. Due to the coronavirus pan- tecting the environment is our top priority. This is why we have set Numerous digital solutions and applications are used in BASF’s demic, there was a greater focus on the safety aspects of remote ourselves ambitious goals for occupational and process safety as production plants to further increase safety, security, planning capa- working in 2021. well as health protection. We stipulate mandatory global standards bility and availability. For example, we had introduced augmented for occupational and process safety, emergency response and 1 reality solutions at around 340 plants worldwide as of the end of In 2021, 0.3 work-related accidents per 200,000 working hours health protection. Our sites and subsidiaries are responsible for 2021. We plan to implement these at more than 80 other plants by occurred at BASF sites worldwide (2020: 0.3). The share of chemi- implementing and complying with internal guidelines and legal the end of 2022. At many sites, our employees already use mobile cal-related accidents declined slightly to 4% (2020: 6%). 1 Hours worked by BASF employees, temporary employees and contractors
BASF Report 2021 Management’s Report – Health and Safety, Emergency Response 120 Unfortunately, there was one fatal work-related accident in 2021 2025 target restrictions associated with the coronavirus pandemic, in-person (2020: 1). At the Geismar site in Louisiana, an employee of a con- seminars were again held as virtual meetings or taught using web- tractor died while performing maintenance work. The accident is still Reduction of worldwide based applications in 2021. being investigated by the local authorities. BASF is assisting the process safety incidents inquiry into the circumstances and cause of the accident. We use per 200,000 working hours ≤ 0.1 We play an active role in improving process safety around the world the findings to take appropriate measures to prevent this from hap- in internal and external networks, through our involvement in organi- pening again. Such measures include regular informational events zations such as the International Council of Chemical Associations and awareness-raising campaigns. In order to maintain the highest level of safety at our plants across their (ICCA), the European Process Safety Centre (EPSC) or the Center entire life cycles, we verify that our protection concepts, safety reviews for Chemical Process Safety (CCPS), and by fostering dialog with We actively share insights to further increase occupational safety and resulting safety measures have been carried out in all our plants government institutions. and continually improve our processes and methods. For example, at timely intervals based on risk potential. We regularly update our For more information on process safety, see basf.com/process_safety we evaluate trends in data, analyze accidents and potential inci- plants’ safety and security concepts, taking into particular account dents, and share knowledge and best practices within our global new technological opportunities and regulatory developments. network of experts and as part of safety initiatives. We also seek Health protection dialog with government institutions and are actively involved in We use the number of process safety incidents (PSI) per 1 external occupational safety initiatives and networks around the 200,000 working hours as a reporting indicator. We have set our- Our global corporate health management serves to promote and world led, for example, by the European Chemical Industry Council selves the goal of reducing process safety incidents to a rate of no maintain the health and productivity of our employees. Our occupa- (CEFIC) or national associations such as the German Chemical more than 0.1 per 200,000 working hours by 2025. In 2021, we tional health standards are specified in a binding global requirement, Industry Association or the American Chemistry Council. recorded 0.3 process safety incidents per 200,000 working hours the implementation of which is the responsibility of our sites and For more information on occupational safety, see basf.com/occupational_safety worldwide (2020: 0.3). We investigate every incident in detail, even subsidiaries. They are supported in this task by a global network of under the constraints of the coronavirus pandemic, analyze causes experts. The Environmental Protection, Health & Safety unit in the and use the findings to derive suitable measures. We share the find- Corporate Center conducts regular audits to monitor compliance Process safety ings in our global network in the interest of continuous improvement. with the standards. Process safety is a core part of safe, effective and thus sustainable Around the world, we promote the reduction of process safety inci- We raise employee awareness of health topics with offerings tailored production. We meet high safety standards in the planning, construc- dents and improve risk awareness with a culture of dealing openly to specific target groups. The BASF health checks form the founda- tion and operation of our plants around the world. These meet and, with mistakes and initiatives to foster dialog around safety risks. To tion of our global health promotion program and are offered to in some cases, go beyond local legal requirements. reduce process safety incidents, we focus in particular on technical employees at regular intervals. measures and on a leadership culture that places even greater Our global guidelines provide the framework for the safe construc- emphasis on process safety, such as in the PM Global Safety Relay We measure our performance in health protection using the tion and operation of our plants as well as the protection of people Race initiative in the Performance Materials division. Avoiding and Health Performance Index (HPI). This has five components: recog- and the environment. Our experts have developed a safety concept detecting all leaks was again a key priority in 2021 with the Zero nized occupational diseases, medical emergency drills, first aid, for every plant that considers the key aspects of safety, health and Loss of Containment Mindset initiative in North America and the preventive medicine and health promotion. Each component con- environmental protection – from plant design to the end of the pro- Zero Leakage initiative in South America. tributes a maximum of 0.2 to the total score, meaning that the duction phase – and that sets out specific safety measures. Regular highest possible score is 1.0. We aim to reach a value of more than implementation checks ensure that all aspects of process safety In addition, we are continually refining and expanding our training 0.9 every year. With an HPI of 0.96, we once again reached this comply with the safety concept and are always up to date. methods and offerings to increase risk awareness. Due to the target in 2021 (2020: 0.92). As in 2020, the figure is slightly lower 1 Hours worked by BASF employees, temporary employees and contractors
BASF Report 2021 Management’s Report – Health and Safety, Emergency Response 121 than in previous years due to the coronavirus pandemic. Conse- seminars and interactive events on regeneration under the banner authorities or neighboring companies. Additional teams may be quently, a number of criteria crucial to the HPI could not be fully met of “Recharge yourself.” Focus topics were physical activity, nutrition called in depending on the extent of the damage and how or measures could not be performed as usual in the reporting year. and relaxation. Over 444 sites worldwide took part, offering events it develops. These included activities that required physical participation such as such as workshops, courses, lectures or exercises. emergency drills, examinations or first aider training. For example, the Global Crisis Management Support Team (GCMS), In October 2021, BASF SE’s Corporate Health Management unit led by a member of the Board of Executive Directors, was activated ® Award from the European In 2021, 36 work-related illnesses among BASF employees world- received the European Responsible Care in connection with the coronavirus pandemic. It provides the strate- wide were documented as recognized occupational diseases Chemical Industry Council (CEFIC) in the category “Supporting gic direction for crisis management and is supported by issue- (2020 : 26). The main recognized occupational diseases are health in COVID-19 times” for its wide-ranging activities and inno- specific and specialist working groups. occupational asthma, hearing loss, skin diseases, musculoskeletal vative approaches to fight the coronavirus pandemic – bundled disorders and cancer. under the motto of “Protect yourself and others.” Safety and emergency drills are also conducted regularly at site and For more information on occupational medicine, health campaigns and the HPI, see basf.com/health Group level. The number of employees and partners involved varies In 2021, we continued the measures to fight the coronavirus depending on the type of exercise. pandemic developed and successfully implemented at our sites in 2020, adapted to the local infection situation in each case. By Emergency response, corporate and cyber security We are actively involved in external networks, which quickly provide sharing information in our BASF medical network and working information and assistance in emergencies. These include the Inter- closely together with the authorities, employee representatives and We create working conditions and an environment in which our national Chemical and Environmental (ICE) initiative and the German our partners at BASF sites, we were able to make and implement employees can work safely. The focus of our emergency and Transport Accident Information and Emergency Response System sound and timely decisions according to the situation. Our actions crisis management is therefore on the safety of our employees, (TUIS), in which BASF plays a coordinating role. In 2021, we pro- focused on the health of all of our employees, contractors and third plants and sites as well as our communities. We are well prepared at vided assistance to public emergency response agencies and other parties. Measures included providing information to and raising global, regional and local level for exceptional situations such as companies in 138 cases (2020: 112). This included information on awareness among employees, tracing and breaking infection chains, major incidents or pandemics thanks to our extensive regulations chemicals and their proper disposal, on-site operational support for and vaccination services. For example, we set up our own corona- and measures for emergency preparedness, emergency response transportation accidents involving hazardous goods, or information virus vaccination center at our largest site in Ludwigshafen, and crisis management. All incidents are carefully followed up on to on human biomonitoring. We apply the experience we have gath- Germany. More than 22,000 primary vaccinations and more than identify potential for improvement, which is integrated into existing ered to improve our own processes and set up similar systems in 21,000 secondary vaccinations were administered there from April concepts as needed. Unusual incidents are recorded and reported other countries. to August 2021, and more than 10,000 booster vaccinations were centrally in accordance with a standard Group-wide procedure administered in December to BASF employees, contractors and site (e-Rapid Incident Report). This enables us to identify risks at an The corporate security requirements for site security are set out in partners. Another focus in 2021 was on influenza prevention. BASF early stage and, if necessary, initiate appropriate relief and commu- a global guideline. Local implementation by our sites and subsidi- employees could be vaccinated against the seasonal flu at many nication measures. aries is regularly audited and continuously improved. Respect for sites around the world, an offer that was very well received. At the human rights is a mandatory element of our requirements. Aspects Ludwigshafen site in Germany, for example, around 6,800 employ- Incidents are initially handled by the local crisis organization or local of human rights relevant to site security are a component of the ees participated in the influenza vaccination campaign. emergency response team. We have implemented precautionary global code of conduct and qualification requirements for our inter- organizational measures with clearly defined responsibilities and nal and external security personnel. We analyze the potential safety In light of the coronavirus pandemic, the Global Health Campaign procedures at all sites for this purpose. The responsible persons and security risks associated with investment projects and strategic 2021 was again devoted to the personal health of our employees. receive regular training. Depending on the situation, we also involve plans, and define appropriate safety and security concepts. Our The program included a wide range of in-person and virtual business partners and our sites’ communities, such as local
BASF Report 2021 Management’s Report – Health and Safety, Emergency Response 122 guiding principle is to identify risks for the company at an early Our worldwide network of information protection officers comprises Good to know stage, assess them properly and derive appropriate safeguards. around 650 employees. They support the implementation of our uniform requirements and hold events and seminars on secure We inform business travelers and transferees about appropriate behaviors. Around 100,000 employees had been trained on the protection measures prior to and during travel in countries with ele- basics of cybersecurity and information protection in 2021. Our vated security risks. We updated our travel recommendations in line standardized Group-wide recommendations for the protection of with the coronavirus pandemic. After any major incident, we can use information and knowledge were expanded to include additional a standardized global travel system to locate and contact employ- guidance for employees and updated in line with current ees in the affected regions. developments. For more information on emergency response, see basf.com/emergency_response We protect our employees, sites, plants and company know-how against third-party interference. This includes addressing in depth the issue of cybersecurity and information security. BASF applies the “security by design” principle to critically review and Automation Security Roadmap optimize IT applications from a cybersecurity perspective as early as the design phase. We are continually improving our ability to prevent, The advance of digitalization increases the risk of cyberattacks detect and react to security incidents with various measures and on IT systems such as online stores or servers. At the same time, training programs. Our global cybersecurity team monitors and pro- automation technology (operational technology) is increasingly tects our IT systems against hacker attacks. We cooperate with being used in production plants, buildings, laboratories and in experts and partners in a global network to ensure that we can logistics, which is also connected to the internet via various protect ourselves against cyberattacks as far as possible. Our IT protection levels. An interdisciplinary team with experts from security management system is certified according to DIN EN information and automation technology developed the Auto- ISO / IEC 27001:2017. It also supports, in particular, our critical infra- mation Security Roadmap to reduce risk in these areas. It serves structures in meeting additional compliance requirements such as as a guide for facilities to protect themselves against cyber- DIN EN ISO/IEC 27019:2020, IT security catalog and corresponding attacks. Part of the concept is training Officers for Automation industry-specific standards (B3S). Security (OAS). BASF now has over 300 OASs. They provide advice and support on cybersecurity in automation technology Around the world, we work to sensitize our employees about pro- at all BASF sites worldwide – for example, on risk analysis, tecting information and know-how. We further strengthened our protecting sensitive data and access control. employees’ awareness of risks in 2021 with mandatory, regular online training for all employees and complementary offerings such as seminars, case studies and interactive training. These increas- ingly addressed aspects of working practices that have changed as a result of the coronavirus pandemic, such as cybersecurity when working from home.
BASF Report 2021 Management’s Report – Product Safety 123 Product Safety aid measures, measures to be taken in the case of accidental and are continuously optimizing alternative methods to experi- GRI 102, 103, 416, 417 release, and disposal. Our global emergency hotline network mentally assess the safety and tolerance of our products without SUPPLIERS BASF CUSTOMERS enables us to provide information around the clock. In order to help animal studies. Our aim is to replace, reduce and refine animal users to quickly find out about our products and the risks associated studies to minimize the impact on them. W e made great progress We see product safety as an integral part of all business with them, we use the Globally Harmonized System (GHS) to classify toward this goal in 2021. For example, an animal-free toxicological processes, as an element of our risk management, and as an and label our products around the world, provided this is legally testing strategy jointly developed by BASF and Givaudan was ®. We important pillar of our commitment to Responsible Care permissible in the country concerned. We take into account any approved by the OECD – the first of its kind worldwide. The strategy continuously work to ensure that our products pose no risk national or regional modifications within the GHS framework, such comprises three individual alternative methods. By combining these to people or the environment when they are used responsibly as the E.U.’s CLP Regulation. methods, it is possible to test more precisely than in animal studies and in the manner intended. We aim to comply with all rele- whether a substance causes allergic skin reactions. vant national and international laws and regulations. We train our employees, customers and logistics partners world- wide on the proper handling and optimal use of selected products with particular hazard potential. Furthermore, in associations and Management of nano- and biotechnology Strategy together with other manufacturers, BASF is pushing for the estab- lishment of voluntary global commitments to prevent the misuse of Nanotechnology and biotechnology offer solutions for key societal We are committed to continuously minimizing the negative effects of chemicals. challenges – such as environmental and climate protection or health our products on the environment, health and safety and to the and nutrition. For example, nanomaterials can improve battery per- ongoing optimization of our products. This commitment to product formance and biocatalytic methods can improve process resource ® charter and the initia- safety is enshrined in our Responsible Care Global chemicals regulations efficiency. We want to harness the potential of both technologies. tives of the International Council of Chemical Associations (ICCA). Using them safely and responsibly is our top priority. Safe handling Our products should not pose any risk to humans or the environ- Most of the products we manufacture are subject to statutory of nanomaterials is stipulated in our Nanotechnology Code of Con- ment when used responsibly and in the manner intended. We aim to chemicals regulations. We want to ensure compliance with these. duct, for instance. We produce a range of products with the help of comply with all relevant national and international laws and regula- We are bound by the relevant regional and national chemicals regu- biotechnological methods, including natural fragrances and flavors, tions. Our global requirements define rules, processes and lations, which continue to grow in number worldwide. Examples enzymes, vitamins or seeds for agriculture. This provides us with responsibilities, for example, to ensure uniformly high product safety include REACH in the E.U., TSCA in the United States and KKDIK in extensive experience in their safe use in research, development and standards worldwide. Our sites and subsidiaries are responsible for Turkey. BASF Group companies work closely together with a global production. We are guided by the code of conduct set out by implementing and complying with internal guidelines and legal network of experts to ensure that BASF complies with the applicable EuropaBio, the European biotechnology association, and want to requirements. The Environmental Protection, Health & Safety unit in regulations. adhere to all relevant standards and legal regulations governing the Corporate Center conducts regular audits to monitor this. production and marketing in our use of biotechnology. BASF’s global network of experts shares information, insights and best practices around product safety on an ongoing basis. Environmental and toxicological testing We maintain and evaluate environmental, health and safety data for Before launching products on the market, we subject them to a all of our substances and products in a global database. This infor- variety of environmental and toxicological tests using state-of-the- mation is continuously updated. The database forms the basis for art knowledge and technology. If we employ animal studies, we substance and product assessments and for our safety data sheets, adhere to the specifications laid down by the German Animal which we make available to our customers in around 40 languages. Welfare Act as well as the requirements of the Association for These include information on the physical/chemical, toxicological Assessment and Accr editation of Laboratory Animal Care – the and ecotoxicological properties of products, potential hazards, first highest standard for laboratory animals in the world. We develop
BASF Report 2021 Management’s Report – Product Stewardship for Crop Protection Products and Seeds 124 Product Stewardship for Crop Protection Products Crop protection We also work closely together with associations such as CropLife and Seeds International and CropLife Europe to promote the safe and proper GRI 102, 103, 416, 417 BASF adheres to the International Code of Conduct issued by the use of crop protection products. For example, we support steward- SUPPLIERS BASF CUSTOMERS World Health Organization (WHO) and the Food and Agriculture ship initiatives of both associations and various programs on the Organization (FAO) for the distribution of crop protection products. proper disposal and recycling of product containers. Technological Crop protection products and seeds are highly regulated at These are only marketed once they have been approved by the rele- innovations developed together with industry partners such as the national and international level, which brings with it strict vant authorities. We no longer sell WHO Class 1A or 1B products easyconnect closed transfer system in Europe or the Wisdom sys- requirements for registering and re-registering active ingre- (high acute oral and dermal toxicity). Depending on availability, we tem in South America also help to make using crop protection dients and crop systems. Regulatory approval is only granted offer our customers alternatives. products easier and safer. when extensive documentation can be provided showing that our products are safe for people, animals and the environ- All of BASF’s crop protection products can be used safely under ment when used in the manner intended. local farming conditions if the information and directions on the label Seeds are followed. Customers can contact us directly if they have any At a glance questions, complaints or issues, for example, by calling the tele- BASF is a member of Excellence Through Stewardship, a global phone number printed on product labels, using the contact forms industry initiative for seeds. This initiative promotes the adoption of ▪ High regulatory requirements and safety standards for crop on our websites or by approaching our sales employees directly. We quality management systems for seeds and product stewardship protection products and seeds record all products incidents relating to health or the environment programs covering the entire life cycle. It also has independent ▪ Wide range of training on the safe and proper handling of our that come to our attention in a global database. If necessary, we ETS-certified auditors verify members’ compliance with its guide- products take appropriate measures on the basis of this information, such as lines. In 2021, BASF successfully passed ETS audits in the areas of updating the instructions for use on the product label to minimize laboratory operations, contained biotech plants, general steward- preventable incidents in the future. We communicate changes to ship, incident response management and product handling at our Potential risks are assessed and minimized throughout the research, instructions for use and general recommendations on the safe use Ghent and Astene sites in Belgium. development and registration process, and on an ongoing basis of our products through channels such as our Farmer Field School For more information on our Agricultural Solutions segment, see page 88 onward following market registration. We regularly perform a large number initiatives in Asia and in training programs such as the On Target For more information on biodiversity, see page 138 onward of scientific studies and tests to ensure that, as far as possible, our Application Academy in the United States. For more information on risks from litigation and claims, see the Notes to the Consolidated Financial registration dossiers address all questions on potential environ- Statements on page 262 mental and health effects. One of the ways we meet our commitment to product stewardship is by offering a wide range of courses and training on the safe We adapt our portfolio to the specific requirements of regional mar- storage and safe use of our products. In India, for example, BASF kets as crops, soils, climate conditions, plant diseases and farming launched the Suraksha Hamesha program. Suraksha Hamesha practices vary around the world. Consequently, product approvals means “safety all the time.” The program creates a platform for edu- differ from country to country. cating farmers and agricultural workers about the nine steps of responsible use of crop protection products and personal protec- tion. Through Suraksha Hamesha, BASF has engaged with over 162,600 agricultural workers and around 33,200 users across India since 2016. BASF also involves government agencies and the cen- tral government’s farm extension teams in these meetings to support and promote farm safety.
BASF Report 2021 Management’s Report – Transportation Safety 125 Transportation Safety External logistics partners are evaluated based risk either through Transportation incidents GRI 102, 103, 306 assessments or on-site audits. BASF’s global network of experts SUPPLIERS BASF CUSTOMERS ensures that information, insights and best practices are shared on To evaluate transportation safety, we systematically record trans- an ongoing basis. porta tion incidents according to defined criteria. We use the number 1 Our regulations and measures for transportation safety cover of transportation incidents as a reporting indicator. In 2021, we the delivery of raw materials, the handling and distribution recorded 21 transportation incidents worldwide (2020: 19). of chemical products between BASF sites, warehouses and Preventive safety measures customers, and the transportation of waste. A particular focus is incidents involving goods spillages that could National and international dangerous goods regulations are based lead to significant environmental impacts. These include dangerous At a glance on an assessment of transportation risks and set out rules and goods leaks of BASF products in excess of 200 kilograms on public measures for safely transporting dangerous goods. We use various traffic routes, provided BASF arranged the transport. We recorded Zero tools to minimize transportation risks. For example, for every dan- three incidents in 2021 with spillage of more than 200 kilograms of 2 transportation incidents with significant impact gerous good to be transported, we check in each case whether the dangerous goods (2020: 2). None of these transportation incidents on the environment packaging is suitable for the type of transport. We conduct digital had a significant impact on the environment (2020: 0). dangerous goods checks before shipping orders are released. In For more information on transportation safety, see basf.com/distribution_safety ▪ Risk minimization along the entire transportation chain addition, vehicles are subjected to a thorough dangerous goods ▪ Risk assessment based on national and international check prior to loading and rejected if there are any issues. dangerous goods regulations Above and beyond this, we use our global requirement to specifi- ▪ Regular review of logistics service providers cally assess the safety and environmental risks of transporting and handling raw materials and sales products with high hazard potential. This is based on the Guidance on Safety Risk Assessment Strategy for Chemical Transport Operations published by the European Chemical Industry Council (CEFIC). We want our products to be loaded, transported and handled safely. This is why we depend on global standards, an effective We stipulate worldwide requirements for our logistics service pro- organization and reliable logistics partners. Our goal is to minimize viders and assess them in terms of safety and quality. Our experts risks along the entire transportation chain – from loading and trans- use our own evaluation and monitoring tools as well as internation- portation to unloading. The transportation of dangerous goods is ally approved schemes such as the ship inspection reports issued subject to mandatory national and international dangerous goods by the Chemical Distribution Institute (CDI) and the Oil Companies regulations as well as our global guidelines. The sites and subsidi- International Marine Forum (OCIMF). aries are responsible for implementing transportation safety regula- tions and guidelines. Compliance is regularly monitored by the Environmental Protection, Health & Safety unit in the Corporate Center using globally standardized transportation safety reviews. 1 Data is collected based on the International Council of Chemical Association’s (ICCA) guidance for reporting performance and includes road, rail and container shipping incidents. 2 Hazardous goods are classified in accordance with national and international hazardous goods regulations.
BASF Report 2021 Management’s Report – Energy and Climate Protection 126 Energy and Climate Protection Schematic overview: development of the BASF Group’s greenhouse gas emissions (Scope 1 and 2) GRI 102, 103, 201, 301, 302, 305 Million metric tons of CO equivalents 2 SUPPLIERS BASF CUSTOMERS 40.1 2030 target Baseline 2018 –25% greenhouse gas emissions compared with 2018 21.9 –7.8% As an energy-intensive company, we take responsibility for the efficient use of energy and global climate protection. Five levers to reduce greenhouse 20.8 20.2 gas emissions: 20.1 2030 target We are committed to the Paris Climate Agreement. Our 16.4 - Gray-to-green inno va tive products enable a reduction in greenhouse gas - Power-to-steam 21.9 - New technologies Carbon management emissions in many areas. At the same time, we are working - Bio-based feedstocks to significantly reduce our own carbon footprint with our - Continuous opex carbon management. 16.4 2050 target At a glance Net zero greenhouse gas emissions 20.2 million 2.4 TWh 0 metric tons Renewable 1990 2018 2030 2050 2018 2019 2020 2021 2030 Greenhouse gas emissions in 2021 energy We have bundled our global activities to reduce greenhouse gas ensures that climate protection-relevant aspects are integrated into ▪ Even more ambitious emission reduction targets emissions in our carbon management (see “Global targets and strategic decision-making processes as well as into core business ▪ New Net Zero Accelerator unit bundles and accelerates projects measures”). We only consider external offsetting measures as a activities (see page 46). In parallel, our operating divisions are work- to achieve targets temporary stop-gap if our activities do not make the desired con- ing on division-specific projects to reduce emissions, supported by ▪ Corporate and product carbon footprints create transparency tribution to reducing emissions. By 2025, we plan to invest up to the global service units. ▪ Supplier CO Management Program €1 billion to achieve our climate protection targets. Additional invest- 2 ments of up to €3 billion are to follow by 2030. We consistently align our actions with our climate protection targets, based on a comprehensive analysis of our emissions. Group-wide Our new organizational structure aims to drive forward our CO emissions are anchored in the BASF Group’s steering and 2 Strategy climate protection targets and carbon management activities with compensation systems as a most important nonfinancial key perfor- even greater focus and speed: The Corporate Strategy & Sustain- mance indicator, giving them even more weight. Investments and Climate protection is very important to us and is an important part of ability unit in the Corporate Center will continue to develop targets acquisitions are assessed with regard to their impact on our climate our corporate strategy. We significantly raised our climate protec- and track global target achievement, while the Net Zero Accelerator protection targets. tion targets in 2021: As a leading chemical company, we want to unit, which was launched at the beginning of 2022, will focus on 1 reduce total greenhouse gas emissions from our production sites accelerating the implementation of existing and new cross-company We are gradually integrating our suppliers into the management of and our energy purchases by 25% by 2030 compared with 2018 – projects to reduce emissions. The emphasis is on low-carbon greenhouse gas emissions along the value chain. To this end, we despite targeted growth and the construction of a large Verbund site production technologies (see page 132), the circular economy (see launched our Supplier CO Management Program in 2021 (see 2 in southern China.2 By 2050, we aim to achieve net zero emissions page 44) and renewable energies (see page 128). Both units report page 130). from our production sites and our energy purchases. directly to the Chairman of the Board of Executive Directors. This 1 The goal includes greenhouse gases according to the Greenhouse Gas Protocol, which are converted into CO equivalents (CO e). 2 2 2 In March 2021, we replaced our previous target of CO -neutral growth until 2030 (baseline 2018: 21.9 million metric tons of CO e) with a new, more ambitious climate protection target to reduce absolute CO emissions by 25% compared with 2018 (new target: 16.4 million metric tons of CO e). 2 2 2 2
BASF Report 2021 Management’s Report – Energy and Climate Protection 127 We offer our customers solutions that help prevent greenhouse gas BASF Group’s greenhouse gas emissions according to the Greenhouse Gas Protocola Million metric tons CO equivalents emissions and improve energy and resource efficiency. More than 2 60% of our annual research and development spending1 goes 2018 BASF operations 2021 2020 (baseline) toward developing these products, optimizing our processes, and Scope 1b toward research projects to make our processes more energy and CO (carbon dioxide) 17.234 16.860 17.025 resource-efficient and to prevent greenhouse gas emissions. 2 N2O (nitrous oxide) 0.418 0.609 0.677 CH f We continuously analyze potential risks to our business operations 4 (methane) 0.034 0.023 0.027 arising in connection with the topics of energy and climate pr otection HFC (hydrofluorocarbons) 0.034 0.031f 0.091 and derive appropriate measures. We support the recommenda- SF6 (sulfur hexafluoride) 0.001 0 0 tions of the Task Force on Climate-related Financial Disclo- Scope 2c sures (TCFD). Since the 2019 reporting year, BASF’s annual report CO 2.464 3.279 4.067 has included an overview showing the sections and subsections in 2 f which TCFD-relevant information can be found (see page 19). We Total 20.185 20.802 21.887 also participate in the program established by the international Offsetting 0 0 0 nonprofit organization CDP for reporting on data relevant to climate f Total after offsetting 20.185 20.802 21.887 protection and have done so since 2004. BASF achieved a score of Sale of energy to third parties (Scope 1)d A– in CDP’s 2021 climate change questionnaire, again attaining f CO 0.947 0.845 0.773 Leadership status. Companies on the Leadership level are distin- 2 f guished by factors such as the completeness and transparency of Total 21.132 21.647 22.660 their reporting. They also pursue comprehensive approaches in Use of biomasse managing the opportunities and risks associated with climate change CO 0.091 0.024 n/a 2 as well as strategies to achieve company-wide emission reduction goals. a BASF reports separately on direct and indirect emissions from the purchase of energy. Scope 1 emissions encompass both direct emissions from production and generation of steam and electricity, as well as direct emissions from the generation of steam and electricity for sale. Scope 2 emissions comprise indirect emissions from the purchase of energy for BASF’s use. b Emissions of N O, CH and HFC have been translated into CO emissions using the Global Warming Potential, or GWP, factor. GWP factors are based on the Intergovernmental Panel on Climate Change (IPCC) 2007, errata 2 4 2 table 2012 for the 2018 and 2020 reporting years, and IPCC 2014 for the 2021 reporting year. HFC (hydrofluorocarbons) are calculated using the GWP factors of the individual components. c Market-based approach. Under the location-based approach, Scope 2 emissions were 3.362 million metric tons of CO in 2020 and 3.670 million metric tons of CO in 2021. We report on greenhouse gas emissions in accordance with the 2 2 d Includes sales to BASF Group companies; as a result, emissions reported under Scope 2 can be considered twice in some cases. Greenhouse Gas Protocol as well as the sector-specific standard for e Emissions are reported separately from Scope 1 and Scope 2 in accordance with the Greenhouse Gas Protocol. f The comparative figure for 2020 has been adjusted to reflect updated data. the chemical industry. Climate protection is a shared task. This is why we support various supply chain and will provide the basis for a Scope 3 target-setting national and international initiatives and are involved in partnerships. methodology for the chemical sector. For instance, in 2021 we worked with Together for Sustainability For more information on climate protection, see basf.com/climate_protection (TfS), the World Business Council for Sustainable Development (WBCSD) and the World Economic Forum’s Low-Carbon Emitting Technologies Initiative (LCET) to harmonize the methodological approaches used to calculate Scope 3 emissions. This will help increase the transparency of greenhouse gas emissions along the 1 Costs not relevant to the calculation of this share include research expenses in early innovation stages of the phase-gate process, patent costs and expenses for supporting services.
BASF Report 2021 Management’s Report – Energy and Climate Protection 128 Global targets and measures Energy supply of the BASF Group 2021 a Fossil fuels and residual fuels used in the BASF Group’s Compared with baseline 2018, we want reduce greenhouse gas Electricity supply central power and steam generation plants emissions from our production sites (excluding emissions from the 26% sale of energy to third parties) and our energy purchases by 25% by Purchased (nonrenewable) 16% 15.3 million 80.3% Natural gas 2030, i.e., from 21.9 million metric tons to 16.4 million metric tons. MWh 30.9 million MWh This corresponds to a reduction of around 60% compared with Purchased (renewable) 1990. Our long-term goal is net zero greenhouse gas emissions by 58% 0.2% Heating oil 2050 (Scope 1 and 2). Internally generated 0.1 million MWh 2.1% Coal 2030 and 2050 targets 0.8 million MWh Steam supplya –25% Net zero 44% 17.4% Substitute fuels Waste heat 6.7 million MWh 13% 45.0 million Reduction in our absolute Greenhouse gas emissions MWhb Total: 38.5 million MWh a Purchased (nonrenewable) greenhouse gas emissions by 2050 43% by 2030 compared with 2018a (Scope 1 and 2) (Scope 1 and 2) Internally generated a BASF operations excluding sale of energy to third parties, including offsetting a Adjusted method for recognizing import/export of electricity and steam b Conversion factor: 0.75 MWh per metric ton of steam The BASF Group’s emissions reported under these targets in 2021 amounted to 20.2 million metric tons of CO equivalents (2020: 2 20.8 million metric tons of CO equivalents). We were able to reduce lever), and ongoing measures to further increase energy and To generate our own steam and power, we mainly use natural 2 emissions by around 3% year on year despite significantly higher resource efficiency in our production (continuous opex lever). gas (80.3%) and substitute fuels (17.4%). These are residues from production volumes due to the increased use of renewable energy For more information on climate protection, see page 27 chemical production plants that cannot be reused in the BASF and measures to improve energy efficiency and optimize processes. A projection of greenhouse gas emissions in 2022 can be found in the forecast from page 148 onward Verbund. We cover more than 58% of our electricity demand with Lower ammonia production due to the high price of natural gas also our own gas and steam turbines in highly efficient combined heat reduced emissions. and power plants. To achieve the highest possible energy yield with Energy supply the lowest possible greenhouse gas emissions, we continu ously To achieve our ambitious climate protection goals, we have adopted invest in our combined heat and power plants. One example is our comprehensive carbon management. This has five levers to Our total energy consumption, comprising fuel demand in our own gas and steam turbine power plant at the Schwarzheide site in reduce greenhouse gas emissions: Using renewable energies central power and steam generation plants, primary energy require- Germany, which is undergoing a €73 million modernization. Once it for both electricity and steam production (gray-to-green and power- ments in our process plants, and net power and steam imports, was is started up in 2022, it will produce 10% more electricity and the to- steam levers), developing and applying new carbon-free and 58.8 million MWh in 2021. CO emissions factor of the power generated will be around 10% 2 low-carbon production processes (new technologies lever, see lower thanks to higher fuel efficiency. page 132), using alternative raw materials (bio-based feedstocks
BASF Report 2021 Management’s Report – Energy and Climate Protection 129 Additional key indicators for energy and climate protection in BASF operations capacity of 24 megawatts peak (MWp) to supply the Schwarzheide 2018 site in Germany. 2021 2020 (baseline) Specific greenhouse gas emissionsa (metric tons of CO2 equivalents per metric ton of sales productb) 0.564 0.639 0.577 In addition to these cooperative ventures, in 2021 we concluded Primary energy demandc (million MWh) 57.627 60.256 60.586 further long-term supply agreements for green power. In Europe, these include a power purchase agreement for wind energy with the Energy efficiency (kilograms of sales productb per MWh) 621 540 626 Engie group (volume: up to 20.7 TWh / term: 25 years) and an off- a Scope 1 and Scope 2 (market-based) according to the GHG Protocol, excluding emissions from the generation of steam and electricity for sale to third parties, including offsetting shore wind power purchase agreement with Ørsted (installed b Sales product volumes include sales between BASF Group companies; merchandise is not taken into account. c Primary energy used in BASF’s plants as well as in the plants of our energy suppliers to cover energy demand for production processes Purchased renewable energy has a primary energy conversion efficiency rate of 100%. capacity: 186 MW / term: 25 years). We will procure energy for our new Verbund site in Zhanjiang, China, from a wind and solar park with a capacity of 400 megawatts. Further long-term supply agree- Compared with separate methods of generating steam and elec- To ensure access to energy from renewable sources, we are pursu- ments for wind and solar power were concluded in the United States tricity, we saved 15.0 million MWh of fossil fuels and avoided ing a make and buy approach. Firstly, BASF is investing in its own for the Freeport and Pasadena sites (both in Texas). 3.0 million metric tons of carbon emissions in 2021. In 2021, inter- renewable power assets, particularly offshore wind farms. Secondly, nally generated power in the BASF Group had a carbon footprint of BASF will purchase green power on the market through long-term In addition, we have converted existing agreements to green power around 0.24 metric tons of CO per MWh of electricity and was supply agreements with plant operators, green power agreements and have acquired renewable energy certificates in a number of 2 below the national grid factor at most BASF Group locations. or renewable energy certificates, depending on the region and mar- regions. The aim is to gradually replace these temporary measures ket regulations. A key purchasing criterion is the “additionality” of the with our own power assets or long-term supply agreements. Another important component of carbon-optimized energy supply energy purchased. This means that power is primarily generated by at our sites is the Verbund system. It helps us realize synergies and new wind and solar farms. In total, over 88 sites worldwide (2020: 19) were already partially or manage value chains in a resource-efficient way. For example, fully powered by emission-free electricity at the end of 2021. The waste heat from one plant’s production process is used as energy in In 2021, we entered into pioneering cooperative agreements to carbon footprint of purchased electricity in 2021 was around other plants. The Verbund saved us around 21.4 million MWh in transform our energy supply. For instance, we currently hold a 0.21 metric tons of CO /MWh (market-based approach), significantly 2 2021, which translates to 4.3 million metric tons less CO released 49.5% share in Vattenfall’s Hollandse Kust Zuid (HKZ) offshore wind lower than in the previous year (0.41 metric tons CO /MWh). 2 2 into the environment. With combined power and steam generation farm. Pending approval of the relevant merger control authorities, as well as our optimized Energy Verbund, we were thus able to we plan to sell shares in HKZ to Allianz Capital Partners in the first avoid a total of 7.3 million metric tons of carbon emissions in 2021. originally quarter of 2022. This will reduce our interest to 24.3%. The That is why we will continue to invest in the creation and optimization agreed power purchase volumes remain unaffected by the trans- of Verbund structures and drive forward the consolidation of pro- action on the basis of a long-term fixed-price power purchasing duction at highly efficient sites. agreement. Once fully operational, expected in 2023, HKZ will have a total capacity of 1.5 gigawatts. We will use part of the electricity A central component of reducing greenhouse gas emissions as part generated there at the Verbund site in Antwerp and at other of our carbon management is gradually shifting our energy sup- European production sites. Under a letter of intent, together with ply to renewable sources. This applies to both our electricity RWE we are developing a project concept for an offshore wind farm and steam supply and our production processes, where we will in the German North Sea with a capacity of 2 gigawatts. Provided increasingly replace fossil fuels with energy from renewable sources. the regulatory framework is adapted by the authorities, this wind The electrification of our processes will significantly increase the farm could supply the Verbund site in Ludwigshafen, Germany, with BASF Group’s green power demand over the coming years (see green electricity before 2030. Together with enviaM, we are also page 27). planning to build and operate a solar park with a total installed
BASF Report 2021 Management’s Report – Energy and Climate Protection 130 Specific greenhouse gas emissions and energy efficiency Certified energy management systems (ISO 50001) at BASF Group sites Carbon footprint, product carbon footprint and climate worldwide, in terms of primary energy demand protection products Energy use and greenhouse gas emissions are closely linked to % capacity utilization and production volumes at our plants. Specific 85.1 91.0 90.2 BASF has published a comprehensive corporate carbon footprint greenhouse gas emissions in 2021 amounted to 0.564 metric tons 69.9 every year since 2008. This reports on all emissions along the value 1 of CO equivalents per metric ton of sales product, a decrease of chain – from raw materials extraction to production and disposal. 2 54.3 11.7% compared with the previous year (2020: 0.639 metric tons of 42.3 CO2 equivalents per metric ton of sales product). This was mainly The Scope 3 greenhouse gas emissions arising before and due to higher demand compared with the previous year and conse- after BASF’s activities in the value chain (in accordance with the quently, better and more stable capacity utilization at our plants. In Greenhouse Gas Protocol’s definition) were determined as around addition, the increased use of renewable energy had a positive 101 million metric tons of CO equivalents for 2021 (2020: 92 million 2 impact on specific greenhouse gas emissions. Since 1990, we have 2016 2017 2018 2019 2020 2021 metric tons of CO2 equivalents).3 We are continually working to been able to lower our overall greenhouse gas emissions from BASF reduce greenhouse gas emissions from our business activities – in operations by 49.7% and even reduce specific emissions by 75.4%. our own production and, together with our partners, along the value We are currently pursuing more than 250 technical and organiza- chain. As part of our carbon management, we aim to make our plants and tional measures to reduce energy consumption and increase com- processes even more efficient and resource saving. An important petitiveness. Our employees are an important source of optimization BASF was able to reduce emissions in the Scope 3 category component of this is the introduction and ongoing maintenance of ideas in this regard. For instance, suggestions for improvement sub- “customers” by 2 million metric tons in 2021, primarily through the certified energy management systems according to DIN EN ISO mitted by our employees in 2021 enabled us to avoid around use of new blowing agents in polyurethane (PU) foams. Until now, 2 These help us to identify and 12,000 metric tons of CO at the Ludwigshafen site in Germany alone. the main blowing agents used were hydrofluorocarbons. These are 50001 at all relevant production sites. 2 implement further potential for improvement in energy efficiency. used in the production of PU insulation materials to create foams This not only reduces greenhouse gas emissions and saves valuable We further improved energy and resource consumption in produc- with excellent insulation properties. The use of these hydrofluoro- energy resources but also increases our competitiveness. In 2021, tion with numerous projects around the world in 2021. At the Lud- carbons in PU products will be prohibited in the European Union 76 production sites worldwide had certified energy management wigshafen site in Germany, for example, a multi-stage evaporation from 2023 due to their high climate impact. We are therefore systems, representing 90% of our primary energy demand. system set up at one plant saves over 60,000 metric tons of steam gradually replacing them with hydrofluoroolefins, which have a much per year. At another plant, additional heat integration made it lower climate impact (measured by global warming potential, GWP). A global working group provides ongoing support to the sites and possible to supply other users with higher-pressure steam, reducing BASF began rolling out PU spray foams based on this new genera- Group companies in implementing and maintaining certified energy fuel consumption on the power plant side. At the Shanghai-Caojing tion of blowing agents on the European market back in 2017. By the management systems. All energy efficiency measures are recorded site in China, a modernized control concept reduced the fuel end of 2021, we will have almost completely converted our Eur opean in a global database, analyzed and made available to BASF sites as demand of a heat recovery unit, and at another plant, steam demand PU spray foam production and will continue to systematically drive best practices. was reduced by additional heat integration using a cooler. At the this forward in other regions as well. Geismar Verbund site in Louisiana, steam demand was reduced by the use of optimized condensate separators. In total, these mea- Our climate protection products offer our customers solutions to sures save more than 23,000 metric tons of CO2 annually. We also avoid greenhouse gas emissions over their entire life cycle com- achieved additional savings in steam, electricity and fuel through pared with reference products. The systematic analysis we conduct process improvements at many other sites. on our portfolio – Sustainable Solution Steering (see page 141) – 1 Sales product volumes include sales between BASF Group companies; merchandise is not taken into account. 2 Relevant sites are selected based on the amount of primary energy used and local energy prices. 3 Calculated in accordance with internationally recognized rules, including the use of values from general databases and industry averages.
BASF Report 2021 Management’s Report – Energy and Climate Protection 131 a Scope 3 emissions along the BASF value chain in 2021 Good to know Million metric tons CO equivalents 2 BASF Customers Disposal Production (including generation Emissions from the use of Incineration with energy of steam and electricity) end products (C 11) recovery, landfilling (C 12) 59 21 4 4 28 6 Suppliers Transport Other Purchased products, services and Transport of products, (C 3b, 3c, 5, capital goods (C 1, 2, 3a) employees’ commuting and 8, 13, 15) business travel (C 4, 6, 7, 9) Product Carbon Footprint We use an in-house digital solution to calculate the carbon a According to Greenhouse Gas Protocol; Scope 1, 2 and 3; categories within Scope 3 are shown in parentheses. Scope 3 emissions in category 10 (“Processing of sold products”) are not reported according to the standard for footprint of our products (PCF). In 2021, this was recognized the chemical sector. Only direct use phase emissions are reported in the customer category (Scope 3.11). For more information on our Scope 3 emissions reporting, see basf.com/corporate_carbon_footprint by organizations such as the German chemical industry asso- ciation (VCI) with the Responsible Care Award for digitalization. rates the use of these Accelerator solutions as particularly good with In 2021, we introduced a global Supplier CO Management Pro- The methodology follows general standards for life cycle 2 respect to climate protection and energy. gram to create transparency and better steer and, in the long term, analysis such as ISO 14044 and ISO 14067, as well as the reduce upstream emissions. In a first step, we ask our suppliers Greenhouse Gas Protocol Product Standard, and has been We calculate carbon footprints for around 45,000 sales products to provide PCFs for our raw materials. We support them by sharing certified by TÜV Rheinland. to increase carbon transparency for our customers (see box our knowledge of evaluation and calculation methods. In this way, on the right). These Product Carbon Footprints (PCF) include all we are also contributing to the standardization of PCF calculation. We used the new method to calculate PCFs for around product- related greenhouse gas emissions generated until a BASF In a second step, we want to work with our suppliers on solutions 45,000 sales products in 2021. The transparency this creates product leaves the factory gates (“cradle-to-gate”). to reduce product-related emissions and establish the PCF as a enables us to target our CO2 reduction measures to those criterion for our purchasing decisions. areas where our customers can later achieve the greatest The extraction of the raw materials we require and the production of For more information on our emissions reporting, see basf.com/corporate_carbon_footprint value added from lower carbon emissions in the value chain. purchased precursors account for the largest share of the PCF. We For more information on Product Carbon Footprints, see basf.com/pcf In 2021, we were able to offer the first products with a certified currently use industrial averages and values from commercial data- reduced carbon footprint through the use of renewable energy. bases as the basis for calculating these upstream emissions. We also started to make the automated PCF calculation approach available to interested industry players by way of partnerships. In a first step, IT companies will be able to trans- late BASF’s methodology and in-house solution into a market- able software through licensing agreements.
In Focus: Innovative Processes BASF Report 2021 Management’s Report – In Focus: Innovative Processes 132 In focus: Innovative Processes for Climate-Smart Chemistry Most of our production processes are already highly optimized. This makes it increasingly difficult to implement further improvements to reduce CO . Completely new technologies are needed to reduce 2 greenhouse gas emissions over the long term and on a large scale. Different teams are working on this in our Carbon Management R&D Program. Our focus here is on the production of basic chemicals such as It will provide insights into the heating concept, as well as the use of hydrogen. The element is needed as a reaction partner in many new types of materials. processes. The processes currently used to produce hydrogen, such as steam reforming, produce high levels of CO emissions. That is Another focus area is alternative heating concepts for our steam 2 why BASF is open to different technologies and is driving forward cracker furnaces (see page 72). We use these plants to split two alternative processes for climate-smart hydrogen production: petroleum into olefins and aromatics. This requires temperatures of water electrolysis and methane pyrolysis. In water electrolysis, around 850 degrees Celsius, which are normally achieved by burning water is split directly into its two components, hydrogen and oxygen. fossil fuels – which emits high levels of CO . A fundamentally new 2 If the required energy comes from renewable sources, the process is heating concept based on electric resistance heating ( eFurnace) and carbon-free. We intend to use the hydrogen generated by water the use of renewable energy could eliminate up to 90% of process- electrolysis primarily as a material in the BASF Verbund and also, to related emissions in the future. To develop and pilot the concept, we a limited extent, for hydrogen model region projects in Germany’s signed a cooperation agreement with SABIC and Linde in 2021 and Rhine-Neckar region. We are currently working with Siemens Energy jointly applied for funding to build a demonstration plant. on initial concepts for the construction of a PEM (proton exchange membrane) water electrolyzer with a capacity of 50 megawatts at the In addition to new, low-carbon production processes, we are also Ludwigshafen site in Germany. We are also exploring various options investigating the use of innovative carbon storage methods. for project funding. At the Antwerp site in Belgium, BASF plans to invest in one of the largest carbon capture and storage (CCS) projects under the North In parallel, we are developing methane pyrolysis technology Sea together with its Antwerp@C consortium partners. The project together with partners from academia and industry in a project spon- can potentially avoid more than one million metric tons of CO2 sored by the German Federal Ministry of Education and Research. emissions per year from the production of basic chemicals. A final In this innovative process, (bio)methane is split directly into hydrogen investment decision is targeted for 2022. Hydrogen is a key element on the journey to climate neutrality. BASF and solid carbon. The process requires around 80% less electricity For more information on carbon management, see basf.com/carbon-management is developing a process – methane pyrolysis – that significantly than water electrolysis and is virtually carbon-free if renewable energy reduces carbon emissions in the production of hydrogen. Find out is used. Following extensive groundwork, we started up a test plant more about what drives project manager Dieter Flick and which for methane pyrolysis at the Ludwigshafen site in Germany in 2021. groundbreaking technologies are still being researched in the online report at report.basf.com.
BASF Report 2021 Management’s Report – Emissions to Air, Waste and Remediation 133 Emissions to Air, Waste and Remediation guidelines. BASF’s global network of experts regularly shares infor- supply chain management. We support our suppliers in developing GRI 102, 103, 305, 306 mation, insights and best practices to further reduce our emissions and implementing measures for improvement, for example in waste SUPPLIERS BASF CUSTOMERS to air, manage waste and responsibly handle contaminated sites. management (see page 111). We offer our customers a wide range of products that can reduce air pollutants or waste – from industrial We want to minimize the impact of our activities on people Continuous documentation and monitoring of emissions to air, process catalysts, fuel additives and catalysts for the automotive and the environment by continually reducing emissions to waste streams and contaminated sites as well as the implementa- sector to additives and track-and-trace technologies to extend the air, preventing waste and protecting the soil. Our plants are tion of measures for improvement are an integral part of our environ- useful life of plastics or improve mechanical recycling of plastic operated safely and efficiently. We use resources responsibly mental management. In addition to greenhouse gases (see page waste. and are continually reducing the environmental impact of 126 onward), we also measure and analyze emissions of air pol lut- our plants and processes with our Operational Excellence ants to avoid potentially harmful substances as best possible. We are increasingly aligning our actions with the circular economy Program. principle. For example, we are increasingly using recycled and Our waste management is based on the systematic tracking of waste-based raw materials in our production, recycling operating At a glance material flows and follows a clear hierarchy: We aim to avoid waste supplies, and expanding our capacities for recovering precious as far as possible, for example, by continuously optimizing our pro- metals from spent automotive and industrial catalysts. We are also 26,358 metric 47.0% cesses or developing new production methods. BASF’s Verbund developing product-specific recycling technologies, often together structure with its networked plants and value chains is key here. We with partners along our value chains. For instance, we are driving tons Share of our waste recycled use it to efficiently manage our material flows. The by-products of forward the chemical recycling of mixed plastic waste and disposed Air pollutants or thermally recovered one plant serve as feedstock for other plants and processes else- foam mattresses and are working on new concepts for recycling from BASF operations where in the BASF Verbund, avoiding waste and enabling us to use battery materials. We are also involved in cross-industry networks raw materials as efficiently as possible. and initiatives to avoid waste and strengthen the circular economy. ▪ Improvements based on continuous monitoring of emissions These include the Alliance to End Plastic Waste (see box on to air and waste streams If these cannot be used within BASF’s Verbund structures, we page 134) and the Ellen MacArthur Foundation. ▪ Circular concepts an important part of our activities assess whether they can be recycled or thermally recovered. Non- For more information on the circular economy, see page 44 ▪ Systematic management of contaminated sites recyclable materials are disposed of safely, appropriately and in an environmentally responsible manner. If we use external waste disposal companies, we conduct regular audits to ensure that waste is disposed of properly. In this way, we also contribute to Strategy preventive soil protection and keep today’s waste from becoming tomorrow’s contamination. If soil and groundwater contamination The safe and efficient operation of our plants and the responsible occurs at active or former sites, appropriate remediation measures management of resources and waste are core components of our are reviewed and implemented. Responsible Care Management system. We have defined our global standards for emissions to air, waste and contaminated sites in In addition to optimizing our own processes, we are committed to Group-wide guidelines, the implementation of which is the responsi- reducing the impact on air and soil and minimizing our disposal bility of the sites and subsidiaries. The Environmental Protection, volumes and material consumption along our value chains. We Health & Safety unit in the Corporate Center conducts regular expect our suppliers to comply with internationally recognized envi- audits to monitor compliance with legal requirements and internal ronmental standards. This is assessed as part of our sustainable
Emissions to Air, Waste and Remediation BASF Report 2021 Management’s Report – Emissions to Air, Waste and Remediation 134 Emissions to air Waste Contaminated sites Total emissions of air pollutants from our production plants BASF generated 2.47 million metric tons of waste in 2021 (2020: We have global standards for managing contaminated sites. A amounted to 26,358 metric tons in 2021 (2020: 24,496 metric 2.21 million metric tons). Of this, 53.0% was disposed of. Hazard- worldwide network of experts ensures these are implemented. We ª). Emissions of ozone-depleting substances as defined by the tons ous waste accounted for 73.9% of the total disposed waste (2020: develop remediation solutions that balance nature conservation, Montreal Protocol totaled 17 metric tons in 2021 (2020: 14 metric 69.6%). Based on the concept of the circular economy, we are climate protection concerns, costs and social responsibility. This tons). We significantly reduced these emissions compared with continuously examining options for material or thermal recycling for means making differentiated decisions on a case-by-case basis, 2002 (229 metric tons) by successively shifting to alternative cool- all waste (see “Strategy”). In this way, we were able to find new uses founded on the legal framework and current technological stan- 1 ants. Emissions of heavy metals in 2021 amounted to 2 metric tons for 47.0% of our waste in 2021. We continuously identify and evalu- dards. Contaminated sites are documented in a database. Ongoing (2020: 2 metric tonsª). ate the safest and most environmentally sound disposal routes for remediation work around the world continued on schedule in 2021 non-recyclable waste. In 2021, most of our hazardous waste was and planning was concluded for future remediation projects. Emissions to air incinerated (77.7%), where possible with energy recovery. 7.6% of For more information on provisions for environmental protection, see the Notes to the Consolidated Metric tons hazardous waste was disposed of in landfill. This is mainly contami- Financial Statements on pages 224 and 260 Air pollutants from BASF operations 2021 2020 nated construction waste that cannot be reused or recycled due to CO (carbon monoxide) 3,951 3,731ª legal requirements. NO (total nitrogen oxides) 11,450 10,646ª X Good to know NMVOC 4,988 4,532ª Waste generation in the BASF Group (nonmethane volatile organic compounds) Million metric tons Hazardous Nonhazardous Alliance to End Plastic Waste SO (total sulfur oxides) 1,864 1,861 wastea wastea X Dust 2,154 2,000 2021 2020 2021 2020 In 2019, we co-founded the Alliance to End Plastic Waste (AEPW) NH (ammonia) and other inorganic substances 1,951 1,711 Recycled 0.14 0.13 0.37 0.31 with other companies along the value chain – from plastics pro- 3 a Thermally recovered 0.52 0.43 0.13 0.09 ducers and consumer goods manufacturers to waste dis posal Total 26,358 24,496 companies. The AEPW now has around 65 members, who a The comparative figure for 2020 has been adjusted to reflect updated data. Waste recovered 0.66 0.56 0.50 0.40 together aim to develop solutions that stop plastic waste from We want to further reduce our emissions with various measures. For Through incineration 0.75 0.64 0.10 0.10 entering the environment, especially the ocean. There are four (without energy recovery) instance, we use catalysts to reduce nitrogen oxides or feed waste main focus areas: developing infrastructure for waste collection, gases back into the production process. One example is the nitrous In surface landfills 0.12 0.13 0.22 0.23 promoting innovative recycling methods, education and engage- oxide generated in the production of adipic acid at the Ludwigshafen Otherb 0.10 0.10 0.02 0.05 ment of various stakeholders, and cleanup of areas heavily site in Germany: 99% of this by-product is already decomposed or Waste disposed of 0.97 0.87 0.34 0.38 impacted by plastic waste. The initiative aims to invest up to used in the BASF Verbund. In the future, it will even be 99.9%. This Total waste generation 1.63 1.43 0.84 0.78 $1.5 billion by 2023. For instance, BASF supports the AEPW’s will be made possible by an automation project implemented a Waste is classified as hazardous or nonhazardous waste according to local regulations. goal of establishing a circular economy for plastics with its in 2021 to optimally control processes based on important plant b Physical/chemical and biological treatment, underground disposal TM ChemCycling project. parameters and using predictive model calculations. The aim is to For more information on the Alliance to End Plastic Waste, see endplasticwaste.org avoid around 550 metric tons of nitrous oxide emissions annually, corresponding to around 145,000 metric tons of CO equivalents. 2 1 Heavy metals are included in the figure for dust (see the table “Emissions to air”).
BASF Report 2021 Management’s Report – Water 135 Water bodies as far as possible. Our sites and subsidiaries are responsible We work with numerous partners along the value chain and from GRI 102, 103, 303 for implementing and complying with internal guidelines and legal civil society to protect water as a resource. For instance, BASF is SUPPLIERS BASF CUSTOMERS requirements. The Environmental Protection, Health & Safety unit in a member of the Alliance for Water Stewardship, a global multi- the Corporate Center conducts regular audits to monitor this. stakeholder organization that promotes the responsible use of water. Water is of fundamental importance in chemical production. BASF’s global network of experts shares information, insights and We are co-founders of the Alliance to End Plastic Waste (AEPW) and It is used as a coolant, solvent and cleaning agent, and to best practices around the responsible use of water on an ongoing are also involved in other global networks such as the World Plastics make our products. Our goods are transported via water- basis. Council or Operation Clean Sweep to effectively reduce and prevent ways. At the same time, water is a scarce commodity in more plastic waste, especially in water bodies. and more regions. That is why we promote the responsible Introducing and implementing sustainable water management use of this resource with sustainable water management. has been a cornerstone of our strategy for many years now. Our We report transparently and comprehensively on water. For instance, focus here is on our Verbund sites and on production sites in water we again provided detailed answers to the 2021 water survey from 1 The aim is to protect water as a resource, to use it as At a glance stress areas. the nonprofit organization CDP. BASF again achieved leadership efficiently as possible through recirculation, and to continuously status with an A– rating in the final assessment. CDP evaluates how 1,695 million 78.5% reduce wastewater and emissions. We consider the quantitative, transparently companies report on their water management activi- Cubic meters of water demand covered qualitative and social aspects of water use. ties and how they reduce risks such as water scarcity. The assess- total water abstraction by reuse ment also considers the extent to which product developments can We pursue our goal by applying the European Water Stewardship also contribute to sustainable water management at the customers ▪ Responsible use a core part of our strategy standard, which rests on four principles: sustainable water abstrac- of the evaluated companies. ▪ Global water target 53.5% achieved tion, maintaining good water quality, preserving conservation areas, For more information on our position paper on water protection, see basf.com/water and ensuring continuous improvement processes. For more information on the CDP water survey, see basf.com/en/cdp ▪ Demand and utilization continuously optimized We advocate the responsible use of water as a resource along the entire value chain. We audit supplier compliance with envi- Strategy ronmental standards in our regular supplier assessments (see page 110). Where improvement is necessary, we support suppliers The responsible use of water as a resource is a core element of our in developing and implementing appropriate measures, such as the Responsible Care Management System and an important part of correct handling of wastewater. In addition, we are involved in a wide our commitment to the United Nations’ Sustainable Development range of initiatives to promote sustainability in the supply chain Goals (SDGs). This is also reflected in our position paper on water (see page 113). For example, efficient water use is a core part of the protection, which we published in 2021. Pragati project to improve sustainability in castor bean farming, the source of the castor oil we use. Our global standards and requirements for water are defined in Group-wide guidelines. Among other things, these stipulate that We offer our customers solutions that help purify water and use water protection concepts must be implemented at all production it more efficiently while minimizing pollution. These include high- sites. The guidelines also cover aspects such as process and performance plastics to produce ultrafiltration membranes, seeds transportation safety (see pages 120 and 125) in order to prevent with higher drought and heat tolerance, or water-saving thin-film production and transportation-related product spillages into water processes for metal pretreatment. 1 We define water stress areas as regions in which more than 40% of available water is used by industry, households and agriculture. Our definition is based on the Water Risk Atlas (Aqueduct 3.0) published by the World Resources Institute. For more information, see wri.org/aqueduct.
Water BASF Report 2021 Management’s Report – Water 136 Global target and measures Water in the BASF Group 2021 Million cubic meters per year Our goal is to introduce sustainable water management at our Abstraction / supply Use Discharge Verbund sites and at all production sites in water stress areas 1,695 6,881 1,503 by 2030, covering 89% of BASF’s total water abstraction. We 1 Of which in water stress areas: 1% 87% Water used in cooling processes Of which cooling water: 1,326 achieved 53.5% of our target in 2021 (2020: 46.2%). Sustainable Of which wastewater from production: 177 water management was introduced at seven additional sites in 2021 Percentage in (2020: 6). Surface water / freshwater 1,308 recirculating 81% Surface water / freshwater 1,239 cooling systems Brackish water / seawater 259 Brackish water / seawater 245 As part of sustainable water management, our sites regularly assess the water situation in the catchment area. This raises awareness Groundwater 100 229 Groundwater 1 of potential risks and impacts for the population such as water Drinking water 20 External treatment plant 18 Water used in production scarcity. Based on the assessments conducted until the end of Reusable wastewater from third parties 3 13% Consumption 2021, we did not identify any activities with a significant impact on Water from raw materials 5 Percentage of 10% water availability and quality at any site. water reused 72 Of which in water stress areas: 16% 2030 target Introduction of sustainable water management at our with various technical improvements. One example is the ethylene Water balance production sites in water stress areas and at our Verbund sites oxide plant, where a change in the pipeline route implemented in 2020 reduces the river water used for cooling purposes by around Our water abstraction totaled 1,695 million cubic meters in 2021 4.7 million cubic meters compared with the reference period (June (2020: 1,728). This demand was covered for the most part by fresh- Another important part of our sustainable water management is the 2019 to June 2020). Since then, the cooling system has operated water such as rivers and lakes (84% of water abstraction). At some continuous analysis and implementation of measures for improve- without pumps. This also saves around 360,000 kilowatt hours of sites, we use alternative sources such as treated municipal waste- ment. For instance, we use wastewater from municipal wastewater electricity compared with the reference period. water, brackish water or seawater. A small part of the water we use treatment plants to reduce our demand for freshwater at our sites in reaches our sites as part of raw materials and steam, or is released Tarragona, Spain (since 2013) and Freeport, Texas (since 2019). At Depending on the local situation, we also implement measures for in our production processes. We abstract most of the water we the Pontecchio site in Italy, we partially use rainwater, which reduced improvement at our sites’ catchment areas together with other need for cooling and production ourselves. In 2021, 5% of our total our demand for river and groundwater by 22,200 cubic meters in stakeholders. One example is the Incentivo ao Produtor de Água water demand was covered by third parties (2020: 5%). 2021. In Belgium, our Verbund site in Antwerp is a member of the program that we launched at the Guaratinguetá site in Brazil in Lerend Netwerk Water network of the Belgian chemical association 2011 together with local authorities, the Espaço ECO Foundation We predominantly use water for cooling purposes (87% of water Essenscia together with other chemical and pharmaceutical compa- and other partners. Measures such as better soil management or abstraction), after which we discharge it back to our supply sources nies. The aim is to facilitate dialog on the responsible use of water the reforestation of riverbank woodlands have since significantly with no product contact. We reduce our demand for cooling water and to develop action plans for water conservation and circular reduced surface runoff and soil erosion in the Ribeirão Guaratinguetá by recirculating as much of it as possible. To do this, we use recool- water use. At the Verbund site in Ludwigshafen, Germany, we have catchment area. ing plants that allow water to be reused several times. Around 13% continually optimized cooling water needs over the past few years of our total water abstraction is used in production plants, for 1 Our water target also continues to take into account the sites that we identified as water stress sites in accordance with Pfister et al. (2009) prior to 2019.
Water BASF Report 2021 Management’s Report – Water 137 example, for extraction or dissolution processes or for cleaning. Emissions to water Here, too, we reduce our demand for water by recycling waste- water. Most of the water used for production purposes is discharged A total of 1,503 million cubic meters of water were discharged from back to water bodies after being treated in our own or third-party BASF production sites in 2021 (2020: 1,429), including 177 million plants. Overall, 78.5% of the water we use in cooling or production cubic meters of wastewater from production. is reused several times. Our wastewater is subject to strict controls and we carefully assess The BASF Group’s water consumption describes the amount of the impact of wastewater discharge in accordance with the applica- water that is not discharged to a water body, meaning that it is no ble laws and regulations. Both internal audits and the responsible longer available to other users. Consumption is mainly attributable local authorities regularly assess whether the analyses and safety to the evaporation of water in recirculating cooling systems. A precautions at our sites comply with internal guidelines and legal smaller amount is from the water contained in our products. Water requirements. consumption in 2021 amounted to around 72 million cubic meters (2020: 63 million cubic meters). Emissions of nitrogen to water amounted to 3,000 metric tons in 2021 (2020: 2,900). Around 12,500 metric tons of organic sub- In 2021, around 25% of our production sites were located in stances were emitted in wastewater (2020: 11,500). Our wastewater water stress areas (2020: 25%). These sites accounted for 1% of contained 17 metric tons of heavy metals (2020: 22). Phosphorus 1 BASF’s total water abstraction (2020: 1%). In water stress areas, emissions amounted to 340 metric tons (2020: 270). we mainly source water from third parties (81%) and largely cover our demand with freshwater. Water consumption in water stress Our approach is to reduce wastewater volumes and contaminant areas accounted for 16% of BASF’s total water consumption in loads at the source in our production processes and to reuse 2021 (2020: 11%) and was primarily attributable to evaporation in wastewater and material flows internally as far as possible. To treat cooling processes. Wastewater in water stress areas accounted for wastewater, we use both central measures in wastewater treatment less than 1% of BASF’s total wastewater. The share of wastewater plants and the selective pretreatment of individual wastewater from cooling processes in water stress areas is lower than for the streams before these are sent to the wastewater treatment plant. BASF Group as a whole. Cooling water is rarely used for once- We use different methods depending on the type and degree of through cooling here. Instead, it is generally recirculated to reduce contamination – including biological processes, chemical oxidation, water demand. Production wastewater in water stress areas is pri- membrane technologies, precipitation or adsorption. marily treated at third-party facilities. In order to avoid unanticipated emissions and the pollution of sur- The supply, treatment, transportation and recooling of water is face or groundwater, we have water protection concepts for our asso ciated with a considerable energy demand. We are constantly production sites in place. This is mandatory for all production plants working to optimize our energy consumption and the amount of as part of our Responsible Care Management System. The waste- water we use, and to adapt to the needs of our business and the water protection plans involve evaluating wastewater in terms of risk environment. and drawing up suitable monitoring approaches. We use audits to check that these measures are being implemented and complied with. For more information, see basf.com/water 1 Aqueduct 3.0 was used to identify sites in water stress areas to determine pro rata water abstraction and water consumption.
BASF Report 2021 Management’s Report – Biodiversity 138 Biodiversity land-use change, climate change, invasive species, overexploitation own initiatives, such as our rambutan program. This was launched GRI 102, 103, 304 and pollution. Our analysis showed that our impacts along the value in 2014 in close collaboration with partners in Vietnam to source SUPPLIERS BASF CUSTOMERS chain mainly relate to the drivers of climate change, land-use change botanical ingredients for cosmetic products from certified organic and pollution. We counteract the climate change driver of bio- rambutan gardens. In cooperation with local farmers and NGOs, Biodiversity describes the variety of life forms on Earth. Low diversity loss – and in this way, help to preserve biodiversity – with BASF’s program promotes the preservation of biodiverse habitats, flora and fauna diversity weakens ecosystems’ ability to our climate protection measures, which play an integral role in all our as well as good agricultural practices, gender equity and fair working withstand changes such as climate change. As a chemical impact areas (see page 126). conditions. company, we depend on ecosystem services like the avail- ability of renewable resources and high air, water and soil We use various methods to measure our sustainability perfor- Our position on forest protection sets out our commitment to quality, while also influencing them. Protecting biodiversity is mance that implicitly and explicitly consider relevant risks and preserving biodiversity in areas of High Conservation Value such as a key element of our commitment to sustainability. opportunities for biodiversity. These include the Eco-Efficiency High Carbon Stock forest areas and peatlands in the procurement ®, Sustainable Solution Steering, Value to Analysis, SEEbalance of renewable raw materials. BASF participated in the “Forests” Society, AgBalance® and the corresponding biodiversity calculator. assessment conducted by the international organization CDP for At a glance Under Value to Society, we assess land use along value chains, the second time in 2021 and achieved a score of A–, again giving it ▪ Strategic alignment of our biodiversity measures based on among other things. Newly developed assessment methods help us Leadership status. CPD is a nonprofit organization that evaluates impact assessments to understand further influences on biodiversity. On the basis of this companies’ management of the environmental risks and opportuni- ▪ Commitment to preserving biodiversity along the entire value understanding, we seek dialog with partners and enter into strategic ties relating to forests, among other things. The assessment is chain with strategic partnerships partnerships, through which we drive forward measures to protect conducted based on detailed insights into the palm value chain and biodiversity around the world. activities that impact ecosystems and natural habitats. Strategy Responsibility to our supply chains Responsibility to our sites and production BASF sees the United Nations’ Convention on Biological Diversity Some of the business activities of our raw material suppliers involve Preservation of biodiversity is taken into consideration in the and the Sustainable Development Goals (SDGs) – including Life land uses that can influence biodiversity (biodiversity loss driver: manage ment of our sites. We operate our facilities in a responsible below water (SDG 14) and Life on land (SDG 15) – as important land-use change). We have laid down our expectations of our sup- manner and minimize negative effects on the environment (bio- orientation and reference frameworks. Our measures help to pre- pliers with regard to environmental, labor and social standards in the diversity loss driver: pollution) by keeping air, water and soil emissions serve biodiversity and meet our responsibility to maintaining the supply chain in the Supplier Code of Conduct (see page 109). as low as possible and reducing and avoiding waste (see page 133 wellbeing of the environment and society. Our corporate sustain- for more information). ability goals on climate protection, product portfolio, circular eco- BASF procures a variety of renewable raw materials. In the procure- nomy, water management and responsible procurement also help ment of palm and palm kernel oil in particular, there is an elevated Our site management measures consider our impact on the bio- to protect biodiversity. risk that forest areas are cleared to create farmland. To improve diversity loss driver of land-use change. For example, given the sustainability in procurement, we established the BASF Palm Com- rele vance of conservation areas to preserving diversity, we check We align our biodiversity measures with the impact of our business mitment in 2011, which was updated in 2015 and is implemented how close our production sites are to internationally recognized activities along the value chain. Our focus here is on three impact with our Palm Sourcing Policy. Third-party certification with stan- conservation areas. In 2021, we included this indicator in our areas: supply chains, sites and production, and product impact. We dards such as the Roundtable on Sustainable Palm Oil (RSPO) environmental database. This allows us to raise awareness of bio- analyzed these in an internal workshop according to the five drivers standard enables us to take biodiversity criteria into account when diversity at local level and draw attention to potential impacts of our of biodiversity loss as defined by the Intergovernmental Science- purchasing raw materials (see page 113). We are also committed to sites on these areas. Four percent of our production sites are Policy Platform on Biodiversity and Ecosystem Services. These are the environmental sustainability of other supply chains through our adjacent to a Ramsar site and 1% are adjacent to a category I, II or
Biodiversity BASF Report 2021 Management’s Report – Biodiversity 139 III protected area as defined by the International Union for Conser- to optimize our products on an ongoing basis. It is important to con- Good to know 1 vation of Nature. None of our production sites are adjacent to a sider the potential impacts of product use on biodiversity, for example, UNESCO protected area. with regard to the biodiversity loss driver of pollution. We have adopted biodiversity as a criterion in decision-making For example, we evaluate our products and solutions in crop pro- processes. In addition, we systematically consider sustainability tection and seeds throughout the entire research, development aspects when deciding whether to invest in the construction of new and registration process. After they have been approved for the sites or expand existing ones. Aspects assessed include the poten- market, we continue assessing them regularly for potential risks and tial impacts on forests and biodiversity. impact to the ecosystems in which they are used. We have initiated various projects and offer training to prevent misuse of our products We are implementing local measures to protect biodiversity at a (see page 124). number of sites. In Clermont, France, for example, grassed areas were converted into biodiversity-friendly spaces, nesting boxes for All types of land development, such as agriculture and forestry, swallows and other bird species were installed, and their population play a role in changing biodiversity (biodiversity loss driver: land-use sizes were measured and documented. In addition, training was change). Activities such as tillage, drainage, fertilization and the use Initiative to preserve the habitat of held to raise employees’ awareness of biodiversity. of crop protection products can affect flora and fauna, for example, the monarch butterfly by influencing food sources. Minimizing these impacts while ensur- We also take biodiversity conservation into account in our produc- ing the necessary productivity is one of the biggest challenges The Alas para el Campo cooperation between the German tion. We are committed to complying with the provisions of interna- farmers are facing. Our Agricultural Solutions segment focuses on Agency for International Cooperation (GIZ), BASF and partners tional environmental agreements such as the Nagoya Protocol. The four areas to help farmers to find the right balance: climate-smart from politics, academia, distributors and local communities was supplementary agreement to the U.N.’s Convention on Biological farming, sustainable solutions, digital farming and smart steward- launched in Mexico in 2019. The aim is to restore the natural Diversity regulates access to genetic resources and access and ship (see page 90). In this context, we work with farmers to create habitat of the monarch butterfly along its migration route. This benefit sharing. It sets out obligations (for example, compensation balanced agricultural systems which enable productive and efficient also protects other pollinators. The focus of the initiative is on payments) for the users of genetic resources such as plant-based farming of high-quality food products and at the same time promote introducing sustainable farming measures, good agricultural raw materials. We use internal control mechanisms to monitor com- biodiversity in the field. For example, we advise them on soil cultiva- practices and ecosystem conservation strategies, for the protec- pliance with standards. tion and look for suitable ways to improve biodiversity in farmlands. tion of pollinators and other beneficial insects. This enables Our many years of experience in sustainability measurement and farmers in Mexico, Central America and the Caribbean to restore evaluation in agriculture are particularly useful here. natural habitats to promote biodiversity while laying the founda- Management of our product impact tion for sustainable yields and prosperity in their communities. Our AgBalance® method and the biodiversity calculator, which BASF offers products and solutions for a wide range of industries. We has been available since 2020, enable a scientifically sound want to ensure that our products meet our customers’ standards in assessment of the impact of agricultural practices on biodiversity. BASF started the global registration for a new, more environmentally quality and, through appropriate use, pose no risk to humans, animals Based on these assessments, we issue recommendations for friendly insecticide active ingredient in 2021. The active ingredient, TM or the environment. Our commitment to the objectives set forth by the measures such as planting flower strips or establishing nesting Axalion , enables farmers to control a wide range of piercing and ® Responsible Care charter of the International Council of Chemical places to benefit pollinators like wild bees and farmland birds. sucking pests that are harmful to crops. At the same time, it is highly Associations (ICCA) obligates us to continuously minimize the nega- Our modern seed solutions also enable better yield on existing compatible with beneficial insects such as pollinators. This supports tive effects of our products on the environment, health and safety and farmlands and thus help protect natural habitats. 1 We have defined “adjacent” as the area within a 3 km radius.
Biodiversity BASF Report 2021 Management’s Report – Biodiversity 140 farmers in balancing agricultural productivity, environmental protec- example, BASF is a member of the Honey Bee Health Coalition, tion and societal demands. which aims to achieve healthy honey bee populations and support healthy populations of native and managed pollinators in productive Animal farming is essential to meeting growing global demand for agricultural systems and thriving ecosystems. BASF France is part products of animal origin such as meat, eggs and milk. Industrialized of the Entreprises pour l’environnement (EpE) network, which livestock production also requires large areas of agricultural land for launched the Act4nature campaign with the main objective of pro- growing feed, which has implications for the share of forest areas tecting and enhancing biodiversity. and biodiversity. BASF offers a range of feed additives such as enzymes, vitamins, glycinates and organic acids that improve nutri- Since 2013, we have also been working with different farmers ent utilization from feed. Better feed conversion and more sustain- and experts from the BASF FarmNetwork Sustainability, an able livestock production mean that less land is needed, preserving association of farms in Europe, to integrate more connected bio- natural ecosystems. diversity areas into agricultural production. Based on the insights gained from working together, an advisory board of experts from agriculture, nature conservation and environmental protection Strategic partnerships to promote biodiversity developed a biodiversity checklist and published it in 2021. This summarizes 10 ecologically effective and practicable measures to Engaging in ongoing dialog with a variety of stakeholders is import- promote biodiversity. Since 2021, BASF has supported farmers ant to BASF. That is why we seek out partnerships with relevant participating in its #wirzahlenBiodiversität (“We pay biodiversity”) interest groups and organizations worldwide to raise awareness of program financially and with professional advice. Our initiatives to biodiversity and drive forward the action needed to preserve natural preserve biodiversity help farmers to achieve the right balance habitats. This enables us to firstly share the knowledge gained from between economic and environmental factors and help them make our biodiversity activities and secondly learn from others to improve an important societal contribution to the preservation of ecosystems. our own practices. For more information on our responsible management of resources, see page 44 For more information on product stewardship, see pages 123 and 124 We cooperate with a number of organizations including the Round- For more information on our commitment to biodiversity, see basf.com/biodiversity table on Sustainable Palm Oil, the Sustainable Palm Oil Forum, For more information on our position on forest protection, see basf.com/forestprotection the Brazilian Coalition on Climate, Forests and Agriculture and the High Carbon Stock Approach Steering Group. The Taskforce on Nature-related Financial Disclosures (TNFD) is working to provide a framework for reporting on nature-related risks and related activities. In 2021, BASF joined the newly established TNFD Forum, a consul- tative network, to support this development. Our involvement in organizations such as the Alliance to End Plastic Waste and the Alliance for Water Stewardship (see page 135) help to preserve biodiversity in bodies of water. Together with international partners and based on dialog with stake- holders in the food value chain, we are driving forward measures to promote sustainable agriculture. In the United States, for
BASF Report 2021 Management’s Report – We Drive Sustainable Solutions 141 We Drive Sustainable Solutions In this section: Steering Our Product Portfolio Innovations based on chemistry are key to solving global challenges such as climate change or resource scarcity. Circular Economy They can play a pivotal role in reducing emissions or decoupling growth and resource consumption, for example. Product Carbon Footprint Targeted research and development is the foundation for sustainable solutions and an important growth driver for BASF. Steering Our Product Portfolio Classification of assessed portfolio according to the Sustainable Solution Steering method GRI 102, 416, 417 Accelerator Accelerator sales SUPPLIERS BASF CUSTOMERS Substantial sustainability contribution 2021: €24,103 million in the value chain 2020: €16,740 million We take advantage of business opportunities by offering our cus- tomers innovative products and solutions that support their sustain- Performer Performer sales ability goals. We ensure that the business units follow standard Meets basic sustainability standards 2021: €39,033 million processes to evaluate and take into account relevant sustainability on the market Assessed 2020: €30,519 million criteria when they develop and implement strategies, research portfolio Transitioner €71,041 million Transitioner sales projects and innovation processes. Specific sustainability issues which are 2021: €7,879 million being actively addressed 2020: €6,799 million Accelerator products make a substantial sustainability contribution in the value chain. These include catalysts that reduce emissions to Challenged Challenged sales the environment, biodegradable mulch films for agricultural applica- Significant sustainability concern identified and 2021: €26 million tions, and high-performance insulation materials for higher energy action plan in development or implementation 2020: €72 million savings and reduced material use in building construction. Based on our corporate strategy, we have set ourselves a global target: We aim to make sustainability an even greater part of our enables us to systematically improve them. We review the cate- tributions to sustainability, in 2018 we started phasing out all innovation power and achieve €22 billion in Accelerator sales by gorization of the portfolio at least every four years. This includes Challenged products within five years of their initial classification at 2025. We met this target already in 2021. Consequently, we will analyzing the portfolio in workshops. the latest. We strive to offer products that make a greater contribu- update our product portfolio steering target over the course of 2022. tion to sustainability in their area of application to live up to our own If, during reassessment of our portfolio, we identify products with commitments and meet our customers’ demands. That is why an A significant steering tool for the product portfolio, based on the significant sustainability concerns, we classify these as “ challenged.” adapted version of our Sustainable Solution Steering method is sustainability performance of our products, is the Sustainable Solu- We develop and systematically implement action plans for all used in areas such as our research and development pipeline, and tion Steering method. It considers our products’ applications in products in this category. These include research projects and in merger and acquisition projects. The results and any measures various markets and customer industries. Transparently classifying reformulations to optimize products, or even replacing the product required are part of our business strategies. our products on the basis of their contribution to sustainability with an alternative. To systematically align our portfolio with con-
Circular Economy BASF Report 2021 Management’s Report – Circular Economy 142 By the end of the 2021 business year, we had evaluated 98.7% of In addition, we want to increasingly use alternative raw materials in The data helps us to target our CO reduction measures to those 2 1 the relevant portfolio (2020: 98.4%). This refers to the BASF Group’s the manufacturing of our products. These include bio-based raw areas where our customers can later achieve the greatest value sales from products in its strategic portfolio to third parties in the materials such as bionaphtha and biogas, and renewable raw added from lower carbon emissions in the value chain. business year concerned. By the end of 2021, sustainability materials such as RSPO-certified palm oil, which we have been ana lyses and assessments had been conducted for more than using for many years as a substitute for fossil resources. To expand To determine the carbon footprint of our purchased raw materials 56,000 specific product applications (2020: >57,000), accounting our supply base for alternative raw materials and at the same time, (upstream Scope 3 emissions), we have until now worked with for €71 billion in sales (2020: €54.1 billion). contribute to the circular economy, we are also developing new, industry averages and values from external databases. To obtain a waste-based sources of raw materials. To achieve this, we develop more accurate data base and reduce emissions in the supply chain, In 2021, we generated sales of €24.1 billion with Accelerator innovative technologies, usually in cooperation with partners, for we launched our Supplier CO Management Program in 2021. The 2 products (2020: €16.7 billion) – already reaching our target for 2025. example for the chemical recycling of plastic waste or disposed aim of the program is to, in a first step, determine the carbon foot- Accelerator products account for 33.9% of the assessed relevant mattresses made of polyurethane. We aim to process 250,000 met- prints of raw materials as accurately as possible. We support our portfolio. Sales of Accelerator products rose by 44.3% compared ric tons of recycled and waste-based raw materials in our production suppliers here by sharing our knowledge of valuation and calculation with the previous year. This is primarily attributable to the positive plants annually from 2025. methods, for example. In the second step, we then want to work development of Accelerator sales in the Surface Technologies with our suppliers to identify levers and targets to continuously and Chemicals segments. Performer products account for 54.9%, One of the steps we have taken to achieve our goals is establishing reduce greenhouse gas emissions along the supply chain. Transitioner products for 11.1% and Challenged products for 0.1% a company-wide Circular Economy Program. As part of this pro- For more information on our corporate carbon footprint and Supplier CO2 Management Program, of the solutions assessed. gram, BASF teams are currently developing new approaches to the see page 130 onward three main action areas in more than 35 initiatives: alternative raw New market requirements arise as a result of the continuous develop- material pathways, innovative material cycles and new business ment of new product solutions in the industry or changing regulatory models for the circular economy – which also include digital and frameworks. This has an effect on the comparative assessment, service-based concepts. which is why we regularly reassess our product portfolio. For more information on the circular economy, see page 44 For more information on Sustainable Solution Steering, see basf.com/en/sustainable-solution-steering For more information on raw materials, see page 112 onward Product Carbon Footprint Circular economy Circularity is a particular focus in the continued development of our In line with increasingly ambitious climate protection targets, CO 2 product portfolio. This enables us to help our customers achieve transparency is becoming more and more important for us and our their sustainability goals while improving the resource and carbon customers. We have published a comprehensive corporate carbon footprint of our products. footprint along our value chain every year since 2008. In addition, we already calculated carbon footprints for individual products in the By 2030, we aim to generate sales of €17 billion with solutions for past. To further increase transparency, we developed a digital solu- the circular economy. These include products based on renewable tion to determine product-specific greenhouse gas emissions in or recycled raw materials that close material cycles (“close the loop”) 2020 and have since calculated the carbon footprints of around or increase the resource efficiency or life of materials (“extend the 45,000 sales products. These Product Carbon Footprints include all loop”). greenhouse gas emissions from raw material extraction to the finished BASF product leaving the factory gates (“cradle-to-gate”). 1 The definition of the relevant portfolio and further information can be found in the Sustainable Solution Steering manual at basf.com/en/sustainable-solution-steering
In Focus: Sustainable Solutions BASF Report 2021 Management’s Report – In Focus: Sustainable Solutions 143 In focus: BASF Solutions for a Sustainable Future Solutions based on chemistry are fundamental to a sustainable future. Every day, around 111,000 employees at BASF work to turn good ideas into innovative products that help solve global challenges such as climate change, resource scarcity or food supply. Enabling climate-smart mobility expects to save around 3,700 metric tons of kerosene and reduce CO by around 11,700 metric tons every year. 2 The transportation sector is one of the largest sources of green- house gases. In Europe, for example, around one-quarter of all CO emissions are caused by road traffic. BASF helps to reduce Making better use of sun and wind 2 exhaust emissions and vehicle fuel consumption with innovative solutions to treat exhaust gases such as zeolite SCR catalysts BASF products enable renewable energies to be used more effi- or tri-metal catalyst technology (see page 82), Keropur® fuel addi- ciently. One example is solar salt. This mixture of sodium nitrate and ® tives or light weight high-performance plastics such as Ultramid , potassium nitrate is used in concentrated solar power (CSP) plants ® ® Ultradur or Elastoflex . (image left). As a heat transfer fluid at high temperatures of over 550 degrees Celsius, molten solar salt allows solar energy to be At the same time, as a leading supplier of battery materials for stored and thus used even in bad weather or at night. lithium-ion batteries, we are paving the way for the age of electro- ® mobility. Here, too, the focus is on sustainability – from the respon- Other examples are the amine-based hardeners Baxxodur EC 301 sible procurement of mineral raw materials and the most economical and EC 201. Both have proven effective in processing epoxy resins use in production to recycling at the end of the life cycle. In the future, for the manufacture of rotor blades for modern wind turbines. the carbon footprint of our European production will be significantly Baxxodur® hardeners contribute significantly to the advantageous below the industry standard thanks to our efficient manufacturing properties of the cured epoxy resin, such as low weight, high processes, the high share of renewable energy, and regional pro- mechanical strength, and high chemical and thermal resistance – all curement and recycling of key raw materials. of which are key to the longevity of rotor blades. In aviation, the Novaflex Sharkskin surface film developed jointly with Lufthansa Technik leads to noticeable CO reductions. Its structure 2 Although one of BASF’s oldest products, sodium nitrate is also used is modeled on sharkskin and optimizes aerodynamics at the flow- for innovative applications: Its excellent heat storage properties related parts of the aircraft. The sharkskin technology will be used makes the technical salt ideal for solar thermal plants. BASF supplies it to one of the largest solar projects in the world – Noor Energy 1 in on Lufthansa Cargo’s entire freighter fleet from 2022. Through its Dubai. use on the 10 Boeing 777F freighters alone, Lufthansa Technik
BASF Report 2021 Management’s Report – In Focus: Sustainable Solutions 144 ® Avoiding CO through efficient thermal insulation Materials such as Infinergy can be recycled. The expanded poly- to southwest China and is suitable for applications such as gels and 2 urethane is used in products such as shoe soles thanks to its out- fluids, as well as novel products such as patches and jelly cosmetics. An important lever in reducing CO is the energy efficiency of build- standing spring and cushioning properties. Through a combination 2 ings. For a number of years now, we have also offered biomass of mechanical processing and finishing, Infinergy can be recycled balance versions of our proven insulating materials Styropor®, and regenerated with its original level of material quality. Reducing the environmental impacts of agriculture ® ® ® Neopor , Styrodur and Elastopir . Under a certified mass balance method, we replace 100% of the fossil raw materials used in the We also have sustainable solutions for packaging and food contain- The demand for food, feed and energy is increasing, while natural production of these product lines with renewable feedstocks. This ers made of cardboard, such as cups or boxes. Until now, these resources are limited. Agriculture is a key enabler in providing significantly reduces the carbon footprint of the end product – in the have typically been coated with a thin layer of polyethylene, which enough healthy, affordable food. Our innovative solutions help farm- ® BMB, by 66% per cubic meter of insulation panel case of Neopor provides a protective barrier to liquids. However, this plastic layer ers find the right balance between productive and sustainable ® ® compared with conventional Neopor . makes recycling difficult. With its Joncryl HPB 4K range, BASF has cultivation. One example is Revysol . The new fungicidal active developed a dispersion system that provides an excellent liquid ingredient controls several economically important fungal diseases barrier. Unlike conventional solutions, it is water-based. This makes in several key crops globally. Its enhanced efficacy, improved selec- Creating new products from waste it possible to efficiently recycle coated cardboard. tivity and favorable regulatory profile allows farmers to maximize yield and to reduce the need to convert more natural habitat to Our innovative technologies and solutions help to reduce waste ®’s performance and its formulation innovation, farmland. Revysol generation and increase the amount of waste that can be recycled. Natural ingredients for industrial and consumer goods which provides long-lasting protection under critical weather condi- One example is our portfolio of plastics additives. Among other tions, avoids the need for repeated fungicide applications. Revysol® things, these additives help to reduce waste by improving the dura- Both industrial users and end consumers are increasingly interested helps to significantly reduce CO emissions per ton of crop. 2 bility of materials. Additives also enable improved mechanical recy- in nature-based ingredients. We are addressing this trend with a TM TM cling. For example, the IrgaCycle product series launched in 2021 growing portfolio of plant-based solutions. One example is BASF tapped the Brazilian market with Pingo Doce watermelons, helps our customers avoid certain quality problems in mechanically ® APG 215 for the wood processing industry. Used as an introducing not only high-quality seeds but also a new business Disponil recycled plastics. This means that recycled plastics can also be adjuvant in production, this surfactant increases the bond strength model. BASF provides technical support to farmers and demon- used for higher-value applications and recycled content can be of medium-density fiberboard (MDF). This enables manufacturers to strates best practices in efficient water management, fertilization increased in the manufacture of new products. achieve a denser and smoother surface and with it, improved and traceability to establish sustainable production. Regular quality water-repellent properties compared with conventional manufactur- controls are carried out to check the sweetness, color and size of In addition to our mechanical recycling solutions, we are driving ing processes. Disponil® APG 215 also offers energy saving potential the watermelons in order to reduce the amount of fruit rejected by TM forward chemical recycling (see page 115). In our ChemCycling in the production process and is 100% based on natural, renewable supermarkets. This new approach delivers a product that benefits project, our technology partners convert waste such as used tires or plant-based raw materials. farmers, consumers and the environment alike. mixed plastic waste, which was not previously recycled, into pyroly- sis oil. We can feed this pyrolysis oil into our Verbund structure in Alongside the natural trend, sensory characteristics such as consis- place of fossil raw materials and use it to make new products based tency and texture play an important role in skin and hair care. That is on a certified mass balance approach. This reduces waste, saves why we are researching and developing alternatives to synthetic resources and simultaneously reduces the carbon footprint of our ingredients and excipients for cosmetics and personal care prod- ® TM ® products. One example is Styropor Ccycled , which is used to ucts. One example is Hydagen Clean. Launched on the market in manufacture products like insulated transport boxes for temperature- 2021, the biopolymer is characterized by its ease of use and high sensitive goods such as coronavirus vaccines. Another application quality. It can be processed in both cold and hot water and is bio- is functional textiles. For example, VAUDE will be launching outdoor degradable. It is extracted from the tuber of the konjac plant native ® TM pants made using our Ultramid Ccycled polyamide from 2022.
Economic Environment in 2022 BASF Report 2021 Management’s Report – Economic Environment in 2022 145 Forecast In this section: Economic Environment 2022 Outlook 2022 We expect the global economic recovery to continue in 2022. As a result, we anticipate global GDP growth of 3.8% Opportunities and Risks (2021: +5.8%). Global growth should be supported by the gradual containment of the coronavirus pandemic. In the advanced economies in particular, demand will increasingly shift from goods to services. However, the bottlenecks in global supply chains will ease only slowly. As order backlogs in industry are high, we expect global industrial production to grow at an above-average rate of 3.8% and chemical production at 3.5%. Economic Environment in 20221 At a glance energy prices and higher inflation rates could dampen consumer For the United States, we are forecasting growth of 3.8% (2021: purchasing power more strongly than expected in our forecast. 5.7%). Growth will be supported by government spending on infra- ▪ Moderate GDP growth expected in Europe and the United States structure, social and climate programs. A continued revival of the ▪ Strong growth assumed in Asia labor market should partially compensate for the phasing out of Trends in the global economy in 2022 extended unemployment benefits under the COVID relief package. ▪ Moderate growth in global industrial production Delays in the clearance of goods at U.S. ports should gradu ally ▪ Fragile recovery in the automotive industry Overall, we anticipate moderate GDP growth of 3.6% (2021: 5.2%) become less relevant as growth in demand for goods slows and ▪ Slower but still above-average growth forecast for the chemical in the European Union (E.U.). This will be driven in part by the shifts toward the services sector. In addition, congestion at ports industry economic upturn in the services sector and the gradual overcoming should gradually ease. Labor shortages will prevent a stronger of supply difficulties that we anticipate for the industrial sector. upturn, which will dampen the recovery in the services sector in Growth will also be supported by payments from the European particular. For Europe and the United States, we expect a moderate weaken- Recovery and Resilience Facility. We expect the differences in ing of growth momentum compared with the previous year. For growth rates between the E.U. member states to be less pro- We expect growth in the emerging markets of Asia to slow China, however, – which made an earlier start to its economic recov- nounced than in the previous year. The dynamic recovery in the overall. In China, the real estate sector will cool. In addition, the ery following the downturn in 2020 – we anticipate much slower but western European countries that grew particularly strongly in 2021 zero- tolerance policy toward the coronavirus pandemic will likely still solid growth. Growth in the other emerging markets in Asia will (France, Italy) is expected to weaken somewhat, while Germany curb the recovery in private consumption. We also assume that likely be slightly stronger than in the previous year. should see slightly stronger growth. In the eastern E.U. countries, selective measures to contain new coronavirus outbreaks will con- we expect growth rates to converge at a similar level. tinue to negatively impact industrial value chains and logistics. However, uncertainty about future developments remains high. The Overall, we expect Chinese GDP to grow by 4.5% in 2022 (2021: further course of the coronavirus pandemic could impact demand We expect the recovery to continue in the United Kingdom, 8.1%). Economic development in India remains uncertain given more severely than expected. Supply difficulties in the global value although this is subject to considerable uncertainty. In particular, the still low vaccination rate. We expect growth there to be slightly chains could continue for longer than assumed in our outlook. High labor shortages in logistics and hospitality may slow further recov- lower than in the previous year (2022: 7.0%; 2021: 8.1%). This will ery. Overall, we anticipate GDP growth of 3.8% there (2021: 7.5%). be driven in particular by a recovery in private consumption. In this 1 Our assumptions account for current estimates by external institutions, including economic research institutes, banks, multinational organizations and consulting firms.
BASF Report 2021 Management’s Report – Economic Environment in 2022 146 environ ment, we expect slightly higher GDP growth of 4.6% (2021: Outlook for gross domestic product 2022 Auto motive production there fell by around one-fifth overall in the 4.2%) for the other emerging Asian economies. This is anticipated Real change compared with previous year past two years, compared with around 7% in Asia. Accordingly, we due to positive base effects and a gradual recovery in tourism. World 3.8% anticipate the strongest catch-up effects in Europe, followed by European Union 3.6% North America and Asia. However, the supply of precursors, espe- In Japan, we expect growth momentum to pick up only slightly in cially semiconductors, will remain a problem and will continue to the coming year (+2.5%) after weak growth of just 1.7% in 2021. United States 3.8% limit growth. Growth will be supported by private consumption and investment, Emerging markets of Asia 4.8% while the slowdown in China is expected to have a dampening Japan 2.5% In the energy and raw materials sector, we are forecasting slightly effect on exports. Government stimulus measures could however South America 1.6% higher production growth than in 2021 due to strong demand and accelerate growth more strongly than assumed in our forecast. higher raw materials prices. We expect the OPEC+ countries to continue to gradually step up oil production. Oil and gas production In South America, growth is expected to weaken significantly in Trends in gross domestic product 2022–2024 in the United States should increase as well. 2022. High net exports of industrial and agricultural commodities will Average annual real change continue to support the Brazilian economy but will no longer provide World 3.2% Growth in the construction industry is expected to weaken some- strong growth impetus. Growth in domestic demand will be curbed European Union 2.6% what. More so than in 2021, commercial construction and infra- by high inflation rates, increased debt and rising interest rates. Over- structure investment will be a stronger driver than new residential all, we are forecasting growth of only 0.4% for Brazil in 2022 (2021: United States 2.8% construction. Residential construction activity is expected to cool 4.7%). In Argentina, too, growth will slow significantly against the Emerging markets of Asia 4.9% sharply, especially in China. However, the infrastructure program backdrop of continued very high inflation and increasing fiscal con- Japan 1.7% in the United States, projects under the European Recovery and solidation requirements (2022: 2.3%; 2021: 9.0%). For the other South America 2.0% Resilience Facility, further government programs to support the emerging markets in South America, we expect growth to be slightly ener getic renovation of existing buildings and still low interest rates higher compared with other countries, but likewise significantly will continue to support growth in the construction industry. weaker year on year (2022: 3.2%; 2021: 9.5%), as the positive base Outlook for key customer industries effects from the previous year also level off in these countries. Consumer goods production is expected to grow slightly faster Overall, we anticipate growth of 3.8% (2021: 6.5%) in global indus- than global GDP. We expect growth in textiles and consumer dura- trial production. Growth in the advanced economies (2022: 3.4%; bles to decline. Production of care products will presumably likewise 2021: 5.3%) is likely to be weaker than growth in the emerging grow at a slightly slower rate than in the previous year. markets (2022: 4.1%; 2021: 7.4%). In the electronics industry, demand is likely to remain high and 1 We are forecasting higher growth in the transportation industry in benefit from the ongoing trend toward digitalization and automation 2022 compared with our other customer industries on average. in many areas of application, both in industry and in private house- Based on the current, exceptionally low level, we expect production holds. Nevertheless, we expect weaker growth compared with the in the automotive industry to return to strong growth. Overall, pro- exceptionally strong prior year. duction volumes will however still remain well below pre-coronavirus pandemic levels. Growth should pick up again in Europe in particu- In the health and nutrition sector, we are forecasting lower growth lar, after automotive production declined by 26% overall in 2020 compared with 2021, as the exceptionally strong growth in the and 2021. North America also has a lot of ground to make up. pharmaceutical industry is expected to level off. Growth in the food 1 The transportation industry includes the production of motor vehicles, motor vehicle parts and the construction of other vehicles (especially ships and boats, trains, air and spacecraft, and two-wheelers).
BASF Report 2021 Management’s Report – Economic Environment in 2022 147 industry is also likely to return to its long-term growth path after the for the manufacturing sector. We are assuming growth of 2.0% in Trends in chemical production 2022–2024 (excluding pharmaceuticals) gradual reopening of the hospitality sector following the lockdowns the United Kingdom (2021: 2.5%). Average annual real change in the previous year provided above-average growth in 2021. World 3.3% For the United States, we are forecasting significantly stronger European Union 2.0% Under normal weather conditions, growth in agricultural produc- growth in chemical production (2022: 4.5%; 2021: 1.8%) following tion in 2022 will presumably be similar to the long-term average. the weather-related production outages in the previous year. In United States 2.7% Production in industrialized countries will grow only weakly. By addition to statistical base effects, we expect growing demand Emerging markets of Asia 4.1% contrast, we anticipate solid production growth in emerging markets above all from the automotive industry, the energy sector and the Japan 1.7% such as Argentina, China, India and Ukraine. consumer goods industry. South America 2.1% In Japan, we expect growth in chemical production to track the Outlook for the chemical industry growth rate for GDP. The strongest growth stimulus will be provided by the electronics industry and the automotive sector (2022: 2.5%; Global chemical production (excluding pharmaceuticals) is expected 2021: 3.7%). to grow by 3.5% in 2022, slower than in the previous year (2021: 6.1%) but still above the average for the years prior to the corona- Chemical production in South America will presumably grow at virus pandemic. In the advanced economies, we anticipate growth around the same rate as the economy as a whole (2022: 1.5%; of 3.1% (2021: 3.9%), which is above the average for the pre-crisis 2021: 4.6%). This will be primarily driven by the significant recovery years. Growth in the emerging markets is expected to slow at a in automotive production and continued moderate growth in much stronger rate (2022: +3.7%; 2021: 7.2%). Based on these demand from agriculture and the raw materials sector. forecasts, global chemical production at the end of the year will be almost 10% above the 2019 level. Outlook for chemical production 2022 (excluding pharmaceuticals) Real change compared with previous year In China, the world’s largest chemical market, we are forecasting World 3.5% much weaker growth in chemical production of 4.0% as base effects European Union 2.8% from the previous year level off (2021: 7.7%). Growth in demand for chemicals in the consumer goods industries and from the electron- United States 4.5% ics industry is expected to weaken. We anticipate continued growth Emerging markets of Asia 3.9% in demand from the Chinese automotive industry. In the other Japan 2.5% emerging markets of Asia, we expect chemical growth to be slightly South America 1.5% weaker than in China. In the E.U., we expect chemical production to increase by 2.8% (2021: 6.0%). We anticipate a significant recovery in the automotive industry, which will strengthen growth in demand for chemicals. For the other customer industries, we are forecasting growth slightly above the long-term average. However, momentum in chemical production already slowed over the course of 2021. As a result, the European chemical industry will presumably grow below the average
BASF Report 2021 Management’s Report – Outlook 2022 148 Outlook 2022 We expect global economic growth to be somewhat more moderate in 2022 following the very strong recovery in 2021. Global growth should be supported by the gradual containment of the coronavirus pandemic. Nevertheless, a full recovery of the market environment is still not yet expected in 2022 as uncertainty remains exceptionally high. Our CO emissions are expected to be between 19.6 million metric the Industrial Solutions and Surface Technologies segments. The At a glance 2 tons and 20.6 million metric tons in 2022 (2021: 20.2 million metric Agricultural Solutions and Nutrition & Care segments plan to consid- ▪ Forecast sales of between €74 billion and €77 billion tons). No forecast has been made for the previous Accelerator erably increase EBIT before special items. ▪ Expected EBIT before special items of between €6.6 billion and sales target as we plan to update our portfolio steering target in €7.2 billion 2022. Based on the forecast for global economic development and expected ▪ Projected ROCE of between 11.4% and 12.6% For more information on our expectations for the economic environment in 2022, see page 145 onward business development in the BASF Group in 2022, we expect a For more information on our opportunities and risks, see page 151 onward ROCE of between 11.4% and 12.6%. Compared with the previous ▪ Capex of around €4.6 billion planned for 2022 year, we anticipate a considerable decrease in ROCE in the Chemi- cals, Materials and Surface Technologies segments. The Agricultural Sales, earnings and ROCE forecast for the BASF Group1 Solutions and Nutrition & Care segments are expected to consid- Our forecast assumes moderate growth in the majority of our cus- erably increase ROCE, while the Industrial Solutions segment will see tomer industries, while the automotive industry is expected to see a The BASF Group is expected to generate sales of between €74 billion a slight increase. stronger recovery. Our forecast range takes into account uncertainty and €77 billion in 2022. Contributing factors will include the volume resulting in particular from the effects of ongoing supply chain dis- growth expected in all segments and slightly positive portfolio effects ruptions, the further course of the coronavirus pandemic and the from the formation of BASF Shanshan Battery Materials Co., Ltd. We CO emissions forecast for the BASF Group 2 development of energy prices. The global economy is expected to anticipate lower price levels, mainly from lower commodity and pre- grow by 3.8% in 2022 (2021: 5.8%). As order backlogs in industry cious metal prices, which will lead to a significant decrease in sales in CO emissions are expected to be between 19.6 million metric tons 2 are high, we expect global industrial production to grow by 3.8% the Surface Technologies and Chemicals segments. We expect and 20.6 million metric tons in 2022. We will take specific emission (2021: 6.5%) and chemical production by 3.5% (2021: 6.1%). We slightly lower sales in the Industrial Solutions segment due to negative reduction measures to limit the additional emissions from moderate anticipate an average oil price of $75 for a barrel of Brent crude and portfolio effects from the sale of the pigments and kaolin businesses. growth and the expected higher capacity utilization of the ammonia an exchange rate of $1.15 per euro. By contrast, we are forecasting considerable sales growth in the plants following low capacity utilization in 2021. These include mea- Agricultural Solutions and Nutrition & Care segments following signifi- sures to increase energy efficiency and process optimization, as well Based on these assumptions, we are forecasting sales of between cant price increases. We expect slightly higher sales in the Materials as the continued shift to renewable energy. In addition, the reductions €74 billion and €77 billion (2021: €78.6 billion). The BASF Group’s segment and in Other. in emissions from divestitures, including the agreed sale of the kaolin income from operations (EBIT) before special items is expected to business, will slightly more than compensate for the additional emis- be between €6.6 billion and €7.2 billion (2021: €7.8 billion). ROCE The BASF Group’s EBIT before special items is expected to decline to sions from the formation of BASF Shanshan Battery Materials Co., should be between 11.4% and 12.6% (2021: 13.5%). between €6.6 billion and €7.2 billion. We anticipate significantly lower Ltd. in 2022. contributions from the Chemicals and Materials segments and from Other. We are forecasting slightly lower EBIT before special items in 1 For sales, “slight” represents a change of 0.1%–5.0%, while “considerable” applies to changes of 5.1% and higher. “At prior-year level” indicates no change (+/–0.0%). For earnings, “slight” means a change of 0.1%–10.0%, while “considerable” is used for changes of 10.1% and higher . “At prior-year level” indicates no change (+/–0.0%). At a cost of capital percentage of 9% for 2022, we define a change in ROCE of 0.1 to 1.0 percentage points as “slight,” a change of more than 1.0 percentage points as “considerable” and no change (+/–0.0 percentage points) as “at prior-year level.”
BASF Report 2021 Management’s Report – Outlook 2022 149 a Forecast by segment forecasting a slight decline in the segment’s EBIT before special Million € items compared with 2021. This will primarily result from the Sales EBIT before special items ROCE decrease in the Dispersions & Resins division, largely due to the 2021 Forecast 2022 2021 Forecast 2022 2021 Forecast 2022 divestiture of the pigments business. The Performance Chemicals Chemicals 13,579 2,974 32.9% division will likely see significant growth in EBIT before special items Materials 15,214 2,418 22.8% mainly as a result of higher sales volumes and stronger margins. However, this will not be able to fully compensate for lower earnings Industrial Solutions 8,876 1,006 15.2% in the Dispersions & Resins division. Surface Technologies 22,659 800 5.6% In the Surface Technologies segment, we are forecasting consid- Nutrition & Care 6,442 497 8.2% erably lower sales in 2022, primarily as a result of lower precious Agricultural Solutions 8,162 715 4.5% metal prices in the Catalysts division. This will be partly offset by Other 3,666 –643 – – higher volumes in both divisions. The segment’s EBIT before special items is expected to decline slightly. We anticipate considerably BASF Group 78,598 €74 billion–€77 billion 7,768 €6.6 billion–€7.2 billion 13.5% 11.4%–12.6% higher EBIT before special items in the Coatings division but a con- siderable year-on-year decrease in EBIT before special items in the At prior-year level: no change (+/–0.0%) | Slight increase/decrease: “slight” represents a change of 0.1%–5.0% for sales; 0.1%–10.0% for earnings; 0.1 to 1.0 percentage points for ROCE Catalysts division due to lower contributions from precious metal | Considerable increase/decrease: “considerable” represents a change of 5.1% or higher for sales; 10.1% or higher for earnings; more than 1.0 percentage points for ROCE. trading. a For sales, “slight” represents a change of 0.1%–5.0%, while “considerable” applies to changes of 5.1% and higher. “At prior-year level” indicates no change (+/–0.0%). For earnings, “slight” means a change of 0.1%–10.0%, while “considerable” is used for changes of 10.1% and higher. “At prior-year level” indicates no change (+/–0.0%). At a cost of capital percentage of 9% for 2022, we define a change in ROCE of 0.1 to 1.0 percentage points as “slight,” a change of more than 1.0 percentage points as “considerable” and no change (+/–0.0 percentage points) as “at prior-year level.” For the Nutrition & Care segment, we expect considerable sales growth compared with 2021. We anticipate higher volumes in both The material opportunities and risks that could affect our forecast are For the Materials segment, we are forecasting slight sales growth in divisions and higher price levels overall, primarily due to the passing described under Opportunities and Risks on pages 151 to 160. 2022. Despite the strong recovery in 2021, this will be largely attri- on of higher raw materials prices and logistics and energy costs. butable to further volume growth in both divisions. Increased infla- This will be partly offset by portfolio effects from the sale of the pro- tionary pressures will be offset by efficiency gains. We anticipate duction site in Kankakee, Illinois. The segment’s EBIT before special Sales and earnings forecast for the segments lower prices due to a normalization of the market environment. EBIT items should be significantly above the prior-year level. We expect before special items in the Monomers division is expected to significantly higher earnings contributions from both divisions, mainly For the Chemicals segment in 2022, we expect sales to decline decrease considerably after strong margins in 2021 as a result of due to higher margins on the back of strong volume growth. considerably following very high prices in 2021 due to supply short- lower price levels and higher raw materials prices. In the Perfor- ages in the market. The decrease in 2022 will be driven by consid- mance Materials division, by contrast, we anticipate a considerable We are forecasting considerable sales growth in the Agricultural erably lower sales in the Petrochemicals division. We expect a increase in EBIT before special items due to the positive develop- Solutions segment. We will raise our sales prices and volumes in a normalization of the market situation, particularly in the United ment of sales volumes. However, this will only be able to partly continued challenging market environment, characterized by supply States, following the supply disruption caused by Winter Storm Uri compensate for the decline in the Monomers division. bottlenecks and high energy and raw materials prices. Based on the in January 2021. In the Intermediates division, we anticipate higher positive development of sales, we anticipate a strong improvement sales volumes driven mainly by amines and polyalcohols. Prices in We expect sales in the Industrial Solutions segment to be slightly in EBIT before special items. In 2022, we will continue to invest in the segment are expected to decline to a lower level while higher below the prior-year level. Higher volumes and continuing high price research and development and digitalization at a high level. raw materials prices will put pressure on margins. For both divisions, levels in both operating divisions will presumably not be able to we therefore anticipate a considerable decline in EBIT before special completely offset the negative portfolio effects from the divestiture Sales in Other are expected to be slightly above the 2021 level in items. of the global pigments business as of June 30, 2021. We are 2022. This will be mainly attributable to sales growth in commodity
BASF Report 2021 Management’s Report – Outlook 2022 150 trading. Despite lower corporate research expenses, we anticipate Capex by segment 2022–2026 Dividend considerably lower EBIT before special items for 2022 compared with the previous year. 27% 9% We have an ambitious dividend policy and offer our shareholders an Nutrition & Care attractive dividend yield. We aim to increase our per-share dividend Chemicals 4% each year. Capital expenditures (capex) €25.6 billion Information on the proposed dividend can be found on page 13 Agricultural Solutions 11% We are planning capital expenditures (additions to property, plant Materials 28% and equipment excluding acquisitions, IT investments, restoration Other (infrastructure, R&D) Financing obligations and right-of-use assets arising from leases) of around 3% €4.6 billion for the BASF Group in 2022. For the period from 2022 to Industrial Solutions In 2022, we expect cash outflows in the equivalent amount of 2026, we have planned capital expenditures totaling €25.6 billion, around €2.0 billion from the scheduled repayment of bonds. To including €12.9 billion for our major growth projects. The investment 18% refinance maturing bonds and to optimize our maturity profile, we volume in the next five years will thus be above that of the planning Surface Technologies continue to have medium to long-term corporate bonds and our period 2021 to 2025 (€22.9 billion). Focus areas will be our invest- global commercial paper program at our disposal. ment project in Zhanjiang, China, to expand our businesses in Asia, Information on our financing policies can be found on page 64 as well as investments in battery materials. Capex by region 2022–2026 45% Projects currently being planned or underway include: Asia Pacific Events after the reporting period 15% Capex: selected projects North America On January 4, 2022, the Board of Executive Directors resolved on a €25.6 billion share buyback program with a volume of up to €3 billion, which shall 1% 1 Location Project South America, Africa, be concluded by December 31, 2023, at the latest. The share buy- 37% Middle East back program started on January 11, 2022. Antwerp, Belgium Capacity expansion: integrated ethylene oxide complex Europe 2% Gradual capacity expansion: alkoxylates Alternative sites currently being investigated Chalampé, France Construction: production plant for hexamethylenediamine Geismar, Louisiana Capacity expansion: MDI plant Harjavalta, Finland, and Investment: battery materials Schwarzheide, Germany Zhanjiang, China Planned construction: integrated Verbund site 1 Subject to a renewed authorization to purchase own shares by the Annual Shareholders’ Meeting on April 29, 2022.
BASF Report 2021 Management’s Report – Opportunities and Risks 151 Opportunities and Risks GRI 102, 201 The goal of BASF’s risk management is to identify and evaluate opportunities and risks as early as possible and to take appropriate measures in order to seize opportunities and limit risks. The aim is to avoid risks that pose a threat to BASF’s continued existence and to make improved managerial decisions to create value. We define opportunities as potential successes that exceed our defined goals. We understand risk to be any event that can negatively impact the achievement of our short-term operational or long-term strategic goals. At a glance Overall assessment According to our assessment, there continue to be no significant individual risks that pose a threat to the continued existence of the ▪ Integrated process for opportunity and risk identification, For 2022, we expect the overall economic recovery to continue and BASF Group. The same applies to the sum of individual risks, even assessment and reporting the coronavirus pandemic to weaken as the population becomes in the case of a global economic crisis like the coronavirus crisis. ▪ Decentralized management of specific opportunities and risks: increasingly immunized. General economic uncertainty will never- aggregate reporting at Group level thel ess remain high. The course of the pandemic is difficult to Ultimately, however, residual risks (net risks) remain in all entrepre- ▪ Material opportunities and risks for 2022 arise from overall predict; in particular, mutations of the coronavirus may lead to neurial activities that cannot be ruled out, even by comprehensive economic developments and margin volatility further waves of infection. This can result in production stoppages risk management. and supply chain disruptions in our customer industries, with our suppliers and in our own production plants. Moreover, restricted As a non-integral shareholding, income from Wintershall Dea is In order to effectively measure and manage identified opportunities economic activity resulting from further lockdowns can have a sig- reported in net income from shareholdings. The opportunities and and risks, we quantify these where appropriate in terms of proba- nificant negative impact on aggregate demand. In addition, an risks resulting from the shareholding in Wintershall Dea are therefore bility and economic impact in the event they occur. Where possible, ongoing low supply of energy and raw materials and the resulting not included in the outlook for the EBIT of the BASF Group. Oppor- we use statistical methods to aggregate opportunities and risks into high prices could cause inflation rates to rise further. This could tunities and risks that have an impact on net income from share- risk factors. In addition, we use a qualitative evaluation scale for dampen the production of energy-intensive products and consumer holdings and cash flow from the shares in Wintershall Dea are opportunities and risks if quantification is not possible. This enables demand beyond our assumed level of slowed growth. monitored and tracked through BASF’s involvement in the relevant us to not only evaluate economic impact but sustainability-related govern ing bodies. aspects as well. In this way, we achieve an overall view of opportu- An escalation of geopolitical conflicts as well as the ongoing trade nities and risks allowing us to aggregate risks at Group level and conflicts between the United States and China and the associated take effective risk management measures. slowdown of the economy also pose significant risks. Opportunities will arise from stronger demand growth, in particular from a greater reduction in pandemic-related risks than assumed by our forecasts. Rapidly increasing global vaccination rates and the approval of effective antiviral drugs against COVID-19 could be contributing factors. In addition to the uncertainties surrounding market growth and the development of key customer industries, material opportunities and risks for our earnings arise from margin volatility.
BASF Report 2021 Management’s Report – Opportunities and Risks 152 Potential short-term effects on EBIT of key opportunity and risk factors Risk management process of commodity price risks takes place in the Global Procurement a subsequent to measures taken unit or in authorized Group companies. Possible variations related to: Outlook The BASF Group’s risk management process is based on the inter- – The BASF Group’s management is informed of short-term opera- – 2022 + national risk management standard, COSO II Enterprise Risk tional opportunities and risks that fall within an observation period Business environment and sector Management – Integrated Framework, and has the following key of up to one year in the monthly management report produced by features: Corporate Finance. In addition, Corporate Finance provides infor- Market growth mation twice a year on the aggregated opportunity/risk exposure Margins Organization and responsibilities of the BASF Group. Furthermore, any arising individual risks which Competition – Risk management is the responsibility of the Board of Executive have an impact of more than €10 million on earnings or risks Regulation/policy Directors, which also determines the processes for approving qualitatively evaluated to have a material impact, for example, investments, acquisitions and divestitures. reputational risks, must be reported immediately. Company-specific opportunities and risks – The Board of Executive Directors is supported by the Corporate – As part of strategy development, the Corporate Development unit Procurement Center. Corporate Finance and Corporate Development, which additionally conducts strategic opportunity/risk analyses with a are units within the Corporate Center, and the Chief Compliance 10-year assessment period. These analyses are annually reviewed Supply chain Officer coordinate the risk management process at a Group level, as part of strategic controlling and are adapted if necessary. Investments/production examine financial and sustainability-related opportunities and Scenarios were also developed to map possible developments Personnel risks, and provide the structure and appropriate methodology. beyond the ten-year horizon. Opportunity and risk management is thus integrated into the – BASF’s Chief Compliance Officer (CCO) manages the imple- Acquisitions/divestitures/cooperations strategy, planning and budgeting processes. mentation of our Compliance Management System, supported by Information technology – BASF’s risk committee reviews the BASF Group’s risk portfolio at additional compliance officers worldwide. The CCO regularly Compliance/legal least twice a year to evaluate any adjustments to risk-manage- reports to the Board of Executive Directors on the status of imple- Tax ment measures and informs the Board of Executive Directors of mentation as well as on any significant results and provides a these. Members of the risk committee are the president of status report to the Supervisory Board’s Audit Committee at least Corporate Finance, the president of Corporate Development, the once a year, including any major developments. The Board of Financial president of Corporate Legal, Compliance & Insurance and the Executive Directors immediately informs the Audit Committee Exchange rate volatility heads of the Corporate Audit, Corporate Environmental Protec- about significant incidents. Other financial opportunities and risks tion, Health & Safety, Corporate Treasury, and Group Reporting & – The internal audit unit (Corporate Audit) is responsible for regu- Performance Management units. larly auditing the risk management system established by the €100 million – The management of specific opportunities and risks is largely Board of Executive Directors in accordance with section 91(2) of €100 million €500 million €500 million €1,000 million delegated to the divisions, the service and research units and the the German Stock Corporation Act. Furthermore, as part of its €1,000 million €1,500 million regions, and is steered at a regional or local level. This also applies monitoring of the Board of Executive Directors, the Supervisory €1,500 million €2,000 million to sustainability-related topics relevant to BASF including the Board considers the effectiveness of the risk management €2,000 million impact of climate change on BASF. A network of risk managers in system. The suitability of the early detection system we set up for a Using a 95% confidence interval per risk factor based on planned values; summation is not permissible the divisions, service and research units as well as in the regions risks is evaluated by our external auditor. advances the implementation of appropriate risk management practices in daily operations. Financial risks are an exception. The management of liquidity, currency and interest rate risks is con- ducted in the Corporate Finance department. The management
BASF Report 2021 Management’s Report – Opportunities and Risks 153 Tools Organization of BASF Group’s risk management – The Governance, Risk Management, Compliance (GRC) Policy, applicable throughout the Group, forms the framework for risk Supervisory Board management and is implemented by the operating divisions, the External auditors a service and research units and the regions according to their spe- Corporate Audit cific business conditions. Board of Executive Directors – A catalog of opportunity and risk categories helps to identify all Chief Compliance Officer relevant financial and sustainability-related opportunities and risks as comprehensively as possible. We also systematically assess Risk Committee opportunities and risks with effects that cannot yet be measured in monetary terms, such as reputational and climate risks. To Corporate Center reflect these, risks for companies in connection with the transition Corporate to a low-carbon economy (transition risks) as well as physical risks Corporate Corporate Corporate Legal, Corporate Corporate Corporate Corporate Development Finance Compliance & Taxes & Environmental Human Communications & Investor Relations as defined by the Task Force on Climate-related Financial Disclo- Insurance Duties Protection, Resources Government sures (TCFD), among others, were added to the catalog. Health & Safety Relations – Because global climate policy ambitions and the implementation of the relevant measures play a decisive role in the ongoing growth of the chemical industry and its customer industries, global long- term scenarios (up to 2050) with various global warming paths Divisions Regions Service units Research units were defined. To assess the impact of different global climate a The Corporate Audit unit is part of the Corporate Center. policy approaches on our business units, the scenarios were discussed by the business units in workshops. Their feedback will be incorporated into the further development of scenario Executive Directors are also expressly obligated to follow these applicable in the European Union, defines the significant processes assumptions and outcomes. A dataset of scenario-specific principles. and deadlines for the Group. There are binding directives for the macroeconomic parameters will be provided to test the eco- For more information on our Group-wide Compliance Program, see page 171 onward internal reconciliations and other accounting operations within the nomic feasibility of investments and business strategies. Group. Standard software is used to carry out the accounting pro- For more information on our sustainability management processes, see page 45 onward cesses for the preparation of the individual financial statements as Significant features of the internal control and risk well as for the Consolidated Financial Statements. There are clear – We use standardized evaluation and reporting tools for the identi- management system with regard to the Group rules for the access rights of each participant in these processes. fication and assessment of risks. The aggregation of opportuni- financial reporting process ties, risks and sensitivities at division and Group level using a Employees involved in the accounting and reporting process meet Monte Carlo simulation helps us to identify effects and trends The Consolidated Financial Statements are prepared by a unit in the the qualitative requirements and participate in training on a regular across the Group. We also aggregate qualitatively assessed risks Corporate Finance department. The Consolidated Financial State- basis. There is a clear assignment of responsibilities between the at Group level using a risk portfolio. ments are derived from the separate financial statements of the specialist units, companies and service units involved. We strictly – Our Group-wide Compliance Program aims to ensure adherence subsidiaries and joint operations, taking into account the relevant adhere to the principles of segregation of duties and dual control, or to legal regulations and the company’s internal guidelines. Our data for the joint ventures and associated companies accounted for the “four-eyes principle.” Complex actuarial reports and evaluations global employee Code of Conduct firmly embeds these manda- using the equity method. The BASF Group’s accounting process is are produced by specialized service providers or specially qualified tory standards into everyday business. Members of the Board of based on a uniform accounting guideline that, alongside accounting employees. policies based on the International Financial Reporting Standards
BASF Report 2021 Management’s Report – Opportunities and Risks 154 An internal control system for financial reporting continuously moni- – Monitoring of control weaknesses macroeconomic risks result from the escalation of other geopolitical tors these principles. To this end, methods are provided to ensure The responsible managers receive reports on any control weak- conflicts and a renewed intensification of the trade conflict between that evaluation of the internal control system in financial reporting is nesses identified and their resolution; and an interdisciplinary the United States and China. Both can have a considerable impact structured and uniform across the BASF Group. They also work in committee investigates their relevance to the BASF Group. The on global demand for intermediate goods for industrial production accordance with the international risk management standard, Board of Executive Directors and the Audit Committee are and demand for investment goods. COSO II Enterprise Risk Management – Integrated Framework. informed if control weaknesses with a considerable impact on financial reporting are identified. Only after material control weak- Weather-related influences can result in positive or negative effects Material risks for the BASF Group regarding a reliable control envi- nesses have been resolved does the company’s managing direc- on our business, particularly in the Agricultural Solutions segment. ronment for proper financial reporting are reviewed and updated on tor confirm the effectiveness of the internal control system. an annual basis. Risks are compiled into a central risk catalog. – Internal confirmation of the internal control system Margins All managing directors and chief financial officers of each consoli- Opportunities and risks for the BASF Group primarily result from Moreover, a centralized selection process identifies companies that dated Group company must confirm to the Board of Executive higher or lower margins in the Chemicals and Materials segments. are exposed to particular risks, that are material to the Consolidated Directors of BASF SE every half-year and at the end of the annual Opportunities arise here if the positive margin trend continues for Financial Statements of the BASF Group, or that provide service cycle, in writing, that the internal control system is effective with longer than expected. However, further increases in energy and raw processes. The selection process is conducted annually. Persons regard to accounting and reporting. materials prices in particular, new capacities and raw materials responsible for implementing the requirements for an effective con- shortages could increase margin pressure on a number of products trol system in financial reporting are appointed at the relevant and value chains. This would have a negative effect on our EBIT. companies. Operational opportunities and risks Moreover, if oil and gas prices rise, Wintershall Dea does not have The process for identifying, evaluating, managing and controlling Market growth a compensating effect on the BASF Group’s EBIT because this risks related to preparing the Consolidated Financial Statements as The development of our sales markets is one of the strongest shareholding is no longer reported in EBIT, but in net income from well as monitoring these processes in the selected companies com- sources of opportunities and risks. For more details on our assump- shareholdings. prises the following steps: tions regarding short-term growth rates for the global economy, – Evaluation of the control environment regions and key customer industries, such as the chemicals, auto- The year’s average oil price for Brent crude was $71 per barrel in Adherence to internal and external guidelines that are relevant to motive and construction sectors, see Economic Environment in 2021, compared with $42 per barrel in the previous year. For 2022, the maintenance of a reliable control environment is checked by 2022 on pages 145 to 147. we anticipate an average oil price of $75 per barrel. We therefore means of a standardized questionnaire. expect price levels for the raw materials and petrochemical basic – Identification and documentation of control activities We also consider opportunities and risks caused by deviations in products that are important to our business to rise. In order to mitigate the risks to the financial reporting processes assumptions. Stronger demand resulting from faster eradication of listed in our central risk catalog, critical processes and control the coronavirus pandemic, for example through sustained efficacy Competition activities are documented. and growing acceptance of coronavirus vaccines and drugs, will We continuously enhance our products and solutions in order to – Assessment of control activities give rise to macroeconomic opportunities. A significant macro- maintain competitive ability. We monitor the market and the compe- After documentation, a review is performed to verify whether the economic risk arises from the possibility that measures to contain tition, and try to take targeted advantage of opportunities and described controls are capable of adequately covering the risks. the coronavirus are kept in place for a longer period of time or aug- counter emerging risks with suitable measures. Aside from inno- In the subsequent test phase, spot checks are carried out to test mented, and, as a result, negatively affect global supply chains and vation, key components of our competitiveness are our ongoing whether, in practice, the controls were executed as described and slow global economic growth. Further increases in energy prices, cost management and continuous process optimization. effective. caused, for example by an escalation of the conflict between Russia and Ukraine, and the resulting higher inflation rates for manufacturer and consumer prices also pose a risk to the economy. Additional
BASF Report 2021 Management’s Report – Opportunities and Risks 155 Regulation/policy partners, developed a special type of ship designed for extreme Acquisitions, divestitures and cooperations Risks for us can arise from intensified geopolitical tensions, new low-water situations. These measures are already making longer We constantly monitor the market in order to identify possible acqui- trade sanctions, stricter emissions limits for plants, and energy and periods of low water on the Rhine River more manageable. sition targets and develop our portfolio appropriately. In addition, we climate laws. In addition, changes in chemical regulations can affect collaborate with customers and partners to jointly develop new, both the BASF Group’s product portfolio and that of our customers, Investments and production competitive products and applications. for example, on the use or registration of agrochemicals. We try to prevent unscheduled plant shutdowns by adhering to high technical standards and by continuously improving our plants. We Opportunities and risks arise in connection with acquisitions and Political measures could also give rise to opportunities. For example, reduce the effects of an unscheduled shutdown on the supply of divestitures from the conclusion of a transaction, or it being com- we view measures around the world to increase energy effi- intermediate and end products through diversification within our pleted earlier or later than expected. They relate to the regular ciency and reduce greenhouse gas emissions as an opportunity for global production Verbund. earnings contributions gained or lost as well as the realization of increased demand for our products, such as our insulation foams gains or losses from divestitures if these deviate from our planning for buildings, catalysts, battery materials for electromobility, or our In the event of a production outage – caused by an accident, for assumptions. solutions for wind turbines. Our broad product portfolio enables us example – our global, regional or local emergency response plans For more information on opportunities and risks from agreed transactions, see page 41 to, in some cases, offer alternatives if new chemicals have to be and crisis management structures are engaged, depending on the developed as a result of restrictions in connection with the REACH impact scope. Every region has crisis management teams on a local Personnel chemicals regulation or new standards in our customers’ industries. and regional level. They not only coordinate the necessary emer- Due to BASF’s worldwide compensation principles, the develop- gency response measures, they also initiate immediate measures ment of personnel expenses is partly dependent on the amount of Procurement and supply chain for damage control and resumption of normal operations as quickly variable compensation, which is linked to the company’s success, We minimize procurement risks through our broad portfolio, global as possible. among other factors. The correlation between variable compen- purchasing activities and the purchase of raw materials on spot sation and the success of the company has the effect of minimizing markets. If possible, we avoid procuring raw materials from a single Crisis management also includes dealing with extreme weather risk. Another factor is the development of interest rates for discount- supplier. When this cannot be avoided, we try to foster competition conditions such as hurricanes (for example, at the sites on the Gulf ing pension obligations. Furthermore, changes to the legal environ- or we knowingly enter into this relationship and assess the conse- of Mexico in Freeport, Texas, and Geismar, Louisiana) or signifi- ment of a particular country can have an impact on the development quences of potential nondelivery. We continuously monitor the cantly elevated water temperatures in rivers due to extended heat of personnel expenses for the BASF Group. For countries in which credit risk of important business partners. waves, which limit the available cooling capacity (for example, at the BASF is active, relevant developments are therefore constantly Ludwigshafen site in Germany). Appropriate precautions are taken monitored in order to recognize risks at an early stage and enable Around the world, the frequency and intensity of extreme weather at the sites in the case of a potential change in risk in connection BASF to carry out suitable measures. conditions (such as high/low water levels on rivers, heat/cold waves with climate change. For example, over the past few years, the For more information on our compensation system, see page 102 and hurricanes) are increasing as a result of climate change. We Verbund site in Ludwigshafen, Germany, has implemented several For more information on risks from pension obligations, see page 157 address the risk of supply interruptions on the procurement and measures to increase cooling capacity, including expanding and sales side caused by extreme weather conditions by switching to optimizing the central recooling plants and optimizing cooling water Information technology risks alternative logistics carriers and the possibility of falling back on flows. These are capable of preventing production outages due to BASF employs on a large number of IT systems. We use tech- unaffected sites within our global Verbund. extreme heatwaves. nologies such as big data and the Internet of Things to develop new business models, corporate concepts and strategies and to respond We implemented a package of climate resilience measures for our Short-term risks from investments can result from, for example, appropriately to changing customer behavior. IT system downtime, Verbund site in Ludwigshafen, Germany, to address low water levels technical malfunctions or schedule and budget overruns. We confidentiality breaches and the manipulation of data stored on the Rhine River: We developed an early warning system for low counter these risks with highly experienced project management in critical IT systems and applications can all have a direct impact water, created multimodal transportation concepts, chartered more and controlling. on production and logistics processes. The threat environment ships that can navigate low water levels and, in cooperation with has changed in recent years, as attackers have become better
BASF Report 2021 Management’s Report – Opportunities and Risks 156 organized, use more sophisticated technology, and have far more particularly based on estimates as to the probability of occurrence The chief aim is the management of counterparty, transfer and resources available. If data are lost or manipulated, this can, for and the range of possible claims. These estimates are the result of currency risks for the BASF Group. example, negatively affect plant availability, delivery quality or the close cooperation between the relevant operating and service units accuracy of our financial reporting. Unauthorized access to sensitive together with Corporate Finance and Corporate Legal. If sufficient Exchange rate volatility data, such as personnel records or customer data, competition- probability of occurrence is identified, a provision is recognized Our competitiveness on global markets is influenced by fluctuations related information or research results, can result in legal conse- accordingly for each proceeding. Should a provision be unneces- in exchange rates. For BASF’s sales, opportunities and risks arise in quences or jeopardize our competitive position. This would also be sary, general risk management continues to assess whether these particular when the U.S. dollar exchange rate fluctuates. A full-year accompanied by the associated loss of reputation. litigations nevertheless represent a risk for the BASF Group’s EBIT. appreciation of the U.S. dollar against the euro by $0.01, which could result from a macroeconomic slowdown, would increase the To minimize such risks, BASF uses globally uniform processes and We use our internal control system to limit risks from potential BASF Group’s EBIT by around €30 million, assuming other condi- systems to ensure IT availability and IT security. These include stable infringements of rights or laws. For example, we try to avoid patent exchange tions remain the same. On the production side, we counter and redundantly designed IT systems, backup processes, virus and and licensing disputes whenever possible through extensive clear- rate risks by producing in the respective currency zones. access protection, encryption systems as well as integrated, Group- ance research. As part of our Group-wide Compliance Program, our wide standardized IT infrastructure and applications. The systems employees receive regular training. Financial currency risks result from the translation of receivables, used for information security are constantly tested, continuously liabilities and other monetary items in accordance with IAS 21 at the updated, and expanded if necessary. In addition, our employees Tax closing rate into the functional currency of the respective Group receive regular training on information and data protection. IT-related The recognized tax-related opportunities and risks only concern company. In addition, we incorporate planned purchase and sales risk management is conducted using Group-wide regulations for taxes that impact the BASF Group’s EBIT in the short term. These transactions in foreign currencies into our financial foreign currency organization and application, as well as an internal control system arise when BASF has taken a position that differs from the opinion risk management. These risks are hedged using derivative instru- based on these regulations. of a competent administrative authority. If a tax payment has already ments, if necessary. been made and could be reclaimed, this is presented as an oppor- The Cyber Defense Center was established in 2015 and is continu- tunity. If, on the other hand, a potential payment is outstanding in Interest rate risks ously being expanded in line with the growth in current accordance with the administrative opinion, this is a risk. We Interest rate risks result from potential changes in prevailing market requirements. BASF is also a member of Cyber Security Sharing primarily evaluate opportunities and risks with regard to their proba- interest rates. These can cause a change in the fair value of fixed- and Analytics e.V. (CSSA) and a founding member of the Ger- bility of occurrence and, if necessary, set up a provision for the rele- rate instruments and fluctuations in the interest payments for man Cybersecurity Organization (DCSO) together with Allianz SE, vant risk. If a provision is not necessary, this is taken into account in variable- rate financial instruments, which would positively or nega- Bayer AG and Volkswagen AG. BASF has also established an determining EBIT-relevant risks of the BASF Group. tively affect earnings. To hedge these risks, interest rate swaps information security management system and is internationally and combined interest rate and currency derivatives are used in certified according to IDIN EN ISO/IEC 27001:2017. individual cases. Financial opportunities and risks Legal disputes and proceedings In addition to market interest rates, BASF’s financing costs are We constantly monitor current and potential legal disputes and Detailed guidelines and procedures exist for dealing with financial determined by the credit risk premiums to be paid. These are proceedings, and regularly report on these to the Board of Executive risks. Among other things, they provide for the segregation of finan- mainly influenced by our credit rating and the market conditions at Directors and Supervisory Board. In order to assess the risks from cial instrument trading and back office functions. the time of issue. In the short to medium term, BASF is largely pro- current legal disputes and proceedings and any potential need to tected from the possible effects on its interest result thanks to the recognize provisions, we prepare our own analyses and assess- As a part of risk management, activities in countries with transfer balanced maturity profile of its financial indebtedness. ments of the circumstances and claims considered. In addition, in restrictions are continuously monitored. This includes, for example, individual cases, we consider the results of comparable proceedings regular analysis of the macroeconomic and legal environment, and, if needed, independent legal opinions. Risk assessment is shareholders’ equity and the business models of the operating units.
BASF Report 2021 Management’s Report – Opportunities and Risks 157 Risks from metal and raw materials trading projects are suspended. Following the impairments recognized in interest rates used in discounting pension obligations leads immedi- In the catalysts business, BASF employs commodity derivatives for the third quarter of 2020, we currently consider the risk of further ately to changes in equity. To limit the risks of changing financial precious metals and trades precious metals on behalf of third parties impairment for assets such as property, plant and equipment, market conditions as well as demographic developments, and on its own account. Appropriate commodity derivatives are also goodwill, technologies and trademarks to be immaterial. The same employees have, for a number of years now, been almost exclu- traded to optimize BASF’s supply of refinery products, gas and applies to investments accounted for using the equity method, with sively offered defined contribution plans for future years of service. other petrochemical raw materials. To address specific risks associ- the exception of Wintershall Dea, which was remeasured at fair Some of these contribution plans include minimum interest ated with these non-operating trades, we set and continuously value in 2019. As the value of the shareholding is dependent on guarantees. If the pension fund cannot generate this, it must be monitor limits with regard to the type and volume of the deals expected oil and gas price developments, impairments of the share- provided by the employer. A permanent continuation of the low concluded. holding and of the assets held by the company are possible. interest rate environment could make it necessary to recognize pension obligations and plan assets for these plans as well. Liquidity risks Long-term incentive program for senior executives Risks from fluctuating cash flows are recognized in a timely manner Since 2020, BASF has offered its leaders the opportunity to partici- as part of our liquidity planning. We have access to extensive pate in a long-term incentive program (LTI program) in the form or a Strategic opportunities and risks liquidity at any time thanks to our good ratings, our unrestricted performance share plan. The LTI plan incentivizes the achievement access to the commercial paper market and committed bank credit of strategic growth, profitability and sustainability targets and takes Long-term demand development lines. In the short to medium term, BASF is largely protected against into account the development of the BASF share price and the We assume that growth in chemical production (excluding pharma- potential refinancing risks by the balanced maturity profile of its dividend. The need for provisions for this program varies according ceuticals) will be about as strong as that of the global gross financial indebtedness as well as through diversification in various to assumptions on the degree of strategic target achievement, the domestic product over the next five years and stronger than the financial markets. development of the BASF share price and the dividend. This leads five-year average prior to the coronavirus pandemic. Through our to a corresponding increase or decrease in personnel costs. market-oriented and broad portfolio, which we will continue to Risk of asset losses strengthen in the years ahead through investments in new produc- We limit country-specific risks with measures based on internally Until 2020, BASF offered leaders the opportunity to participate in a tion capacities, research and development activities and acquisi- determined country ratings, which are continuously updated to share price-based compensation program. The need for provisions tions, we aim to achieve volume growth that slightly exceeds this reflect changing environment conditions. We selectively use invest- for this program varies according to the development of the BASF market growth. Should global economic growth see unexpected, ment guarantees to limit specific country-related risks. We lower share price and the MSCI World Chemicals Index; this leads to a considerable deceleration because of prolonged restrictions due credit risks for our financial investments by engaging in transactions corresponding increase or decrease in personnel costs. to the coronavirus pandemic, an ongoing weak period in the only with banks with good credit ratings and by adhering to fixed emerging markets, protectionist tendencies or geopolitical crises, limits. Creditworthiness is continuously monitored and the limits are Risks from pension obligations the expected growth rates could prove too ambitious. adjusted accordingly. We reduce the risk of default on receivables Most employees are granted company pension benefits from either For more information on the corporate strategy, see page 26 onward by continuously monitoring the creditworthiness and payment defined contribution or defined benefit plans. We predominantly behavior of our customers and by setting appropriate credit limits. finance company pension obligations externally through separate Development of competitive and customer landscape Risks are also limited through the use of credit insurance and indi- plan assets. This particularly includes BASF Pensionskasse VVaG We expect competitors from Asia and the Middle East in particular vidual hedging strategies, such as guarantees. Due to the global and BASF Pensionstreuhand e.V. in Germany, in addition to the to gain increasing significance in the years ahead. Furthermore, we activities and diversified customer structure of the BASF Group, large pension plans of our Group companies in North America, the predict that many producers in countries rich in raw materials will there are no major concentrations of credit default risk. United Kingdom and Switzerland. To address the risk of underfund- expand their value chains in consumer-oriented sectors. In addition, ing due to market-related fluctuations in plan assets, we have the proliferation of large-scale digital marketplaces for chemicals Impairment risks investment strategies that align return and risk optimization to the could impact existing customer and supplier relationships. Asset impairment risk arises if the assumed interest rate in an impair- structure of the pension obligations. Stress scenarios are also simu- ment test increases, the predicted cash flows decline, or investment lated regularly by means of portfolio analyses. An adjustment to the
BASF Report 2021 Management’s Report – Opportunities and Risks 158 We expect a continuous rise in customer demand for sustainable We counter these risks as part of our corporate strategy. We explain We expect that the digital disruption of established processes will solutions, for example, products with a low carbon footprint, made our strategy in meetings with political decision-makers and social lead to a sharp increase in efficiency and effectiveness in some from recycled, circular, or bio-based raw materials that are bio- stakeholders. In doing so, we also inform ourselves of the changes fields. BASF is therefore committed to taking a leading role in the degradable, or products with other measurable sustainability we must undergo and advocate for a favorable and stable regu- digital transformation of the chemical industry. Possible applications benefits. We are therefore addressing these topics in research and latory framework at both the national and international level. We of digital technologies and solutions are evaluated along the entire investment programs for the sustainable transformation of BASF. consider BASF to be in a strong position to contribute solutions value chain and implemented throughout the company, for exam- Companies with a proven track record of providing more sustainable toward achieving U.N. development goals, particularly regarding ple, in production, logistics, research and development, business solutions will be able to achieve higher growth and profitability as a climate neutrality, through new technologies, innovative products models and corporate governance. result. The expansion of sharing economy business models could and processes and our broad product portfolio. For more information on innovation, see page 49 onward have a long-term impact on demand in individual customer indus- tries. At the same time, higher demands on product features can Innovation Procurement, supply chain and infrastructure also create opportunities for innovation. We expect the trend toward increased sustainability requirements in Supply security for raw materials, energy and services is increas- our customer industries to continue. Our aim is to leverage the ingly affected by trade disputes, protectionism and geopolitical To maintain our competitiveness, we are continuously improving our resulting opportunities in a growing market with even more sustain- conflict. In addition, supply chains are increasingly threatened by production processes, streamlining our administration and simplify- able innovations. The key areas are products with a lower or even disruptions such as suppliers’ production bottlenecks, interrupted ing workflows and processes as part of our excellence programs. net zero carbon footprint, circular economy solutions, and safe and logistics chains, extreme weather events, and longer-lasting Our research and business focus is on highly innovative businesses sustainable products. To be successful in these fields, we have effects from the coronavirus pandemic. Climate change and extreme and differentiation through sustainability advantages to make our launched specific research and investment programs for the weather events are impacting the availability of renewable customers and BASF more successful. sustainable transformation of BASF. Furthermore, we began apply- resources. For more information on the Excellence Program, see page 21 ing the Sustainable Solution Steering method to the evaluation of innovation projects and integrated it at an early stage of our research These risks, as well as the introduction of new environmental regu- Regulation/policy and development processes. In this way, we are steering our inno- lations (for example, carbon fees), can have an impact on purchas- We expect to achieve continued regulatory and societal pressure, vation portfolio toward increased sustainability, which leads to ing prices. Transportation costs are significantly affected by capacity climate-neutral energy production, climate-neutral energy consump- higher profitability while reducing reputational and financial risks as constraints (for example, a lack of truck drivers, traffic jams due to tion, and a climate-neutral resource and raw material base. The well. inadequate logistics infrastructure). political approaches to address these issues will vary greatly from region to region. However, based on Europe in particular, we expect There are technical and commercial risks of failure associated We are seeing an ongoing expansion of the regulatory framework measures with a high level of regulation and detail that will have with every single research and development project. We also affecting us and our suppliers. Potential non-compliance by our the potential to significantly impact the competitiveness of BASF’s address this by maintaining a balanced and comprehensive project suppliers may lead to a reduced supplier base. Moreover, the avail- opera tions and product portfolio. portfolio as well as through professional, milestone-based project ability of renewable energies depends largely on favorable prices management. and framework conditions. Furthermore, we see the risk of the current geopolitical shift in bal- ance of power leading to the establishment of uncoordinated or Further risks may arise from increasing state protectionism and the These risks are continuously analyzed and appropriate strategies divergent global legislative standards and regulatory systems, not demand for localization of intellectual property in order to achieve and measures developed to minimize the impact on BASF. just in relation to chemicals, but also to environmental, social and technological independence. Through our Know-how Verbund in corporate governance criteria and the regulatory framework for research and development, we ensure that critical intellectual prop- To assess the changing risks for our sites from climate change, digitalization. erty is generated and protected in countries with high intellectual- climate data based on the latest scenarios of the Intergovernmental property standards. Panel on Climate Change (IPCC) were compiled for our sites in cooperation with an external partner. This enables the sites to
BASF Report 2021 Management’s Report – Opportunities and Risks 159 assess the potential impact of climate change in the coming Acquisitions, divestitures and cooperations Sustainability decades. Here, we focus on a climate protection scenario, supple- In the future, we will continue to expand and refine our portfolio Opportunities and risks that could arise from material sustainability mented by two scenarios with medium and high levels of global through acquisitions that promise above-average profitable growth, topics can only rarely be measured in specific financial terms and 1 warming. The most common potential impact is an increase in heat are innovation-driven or offer a technological differentiation and help have an impact on business activities, especially in the medium to and drought. The findings can be considered in the development of achieve a relevant market position, and make new, sustainable busi- long term. site strategies. ness models possible. We reduce potential risks in the areas of environmental protection, The availability of our infrastructure, production plants and supply The evaluation of opportunities and risks plays a significant role safety and security, health protection, product stewardship, com- chains can be negatively affected by system downtime, confiden - during the assessment of acquisition targets. A detailed analysis pliance, supplier relationships and labor and social standards by tiality breaches, or manipulation of data in critical IT systems and and quantification is conducted as part of due diligence. Examples setting ourselves globally uniform requirements. These sometimes applications. The threat environment has changed in recent years, of risks include increased staff turnover, delayed realization of syner- go beyond local legal requirements. Our globally applicable Code of as attackers have become better organized, use more sophisticated gies, or the assumption of obligations that were not precisely Conduct defines a binding framework for the activities of all BASF technology, and have far more resources available. quantifiable in advance. If our expectations in this regard are not employees, leaders and members of the Board of Executive Direc- met, risks could arise, such as the need to impair intangible assets; tors. To ensure compliance with our internal standards, we have Portfolio development through investments however, there could also be opportunities, for example, from global management systems in place and monitor their implementa- We expect growth in chemical production in emerging markets additional synergies. tion internally by means such as global surveys and audits. Expec- to remain above the global average in the years to come. This will tations of suppliers are laid down in our global Supplier Code of create opportunities that we want to exploit by expanding our local Divestitures also play a key role in the development of our portfolio. Conduct. We have suppliers with a high potential sustainability risk presence. In addition, regional value chains help mitigate risks from Risks could arise from divestitures as a result of potential warranty evaluated by third parties, either through sustainability evaluations trade conflicts and barriers that pose a challenge to global markets claims or other contractual obligations, such as long-term supply or on-site audits. The monitoring systems are complemented by and supply chains. agreements. grievance mechanisms such as our compliance hotlines. For more information on our acquisitions and divestitures, see page 41 Decisions on the type, scope and location of our investment Furthermore, ongoing climate change poses both opportunities and projects are made on the basis of established comprehensive Recruitment and long-term retention of qualified employees risks for BASF. As an energy-intensive company, climate-related assessment processes. They take into account long-term forecasts BASF anticipates growing challenges in attracting qualified employ- risks arise particularly from regulatory changes, such as in carbon for market, margin and cost development, raw material availability ees in the medium and long term due to demographic change, prices through emissions trading systems, taxes or energy legisla- as well as country, currency, sustainability and technology risks. especially in North America and Europe. As a result, there is an tion. In addition, BASF’s emissions footprint and intensity could lead Opportunities and risks arise from potential deviations in actual increased risk that job vacancies may not be filled, or only after a to a negative perception and reduced appeal among external stake- developments from our assumptions. delay. We address these risks with measures to integrate diversity, holders such as customers or investors. We counter these risks with employee and leadership development, and intensified employer our carbon management measures and by transparently disclosing Investments in more sustainable technologies represent a long-term branding. At local level, demographic management includes succes- our positions on and contributions to climate protection (such as opportunity, even though they may not be competitive or profitable sion planning, knowledge management and offerings to improve the political demands, progress in the implementation of our climate in the short term, depending on the market and the prevailing regu- balance between personal and professional life, and promote healthy strategy and how our products help to protect the environment) in latory framework. living. This increases BASF’s appeal as an employer and retains our publicly accessible sources (such as this annual report or on the For more information on our investment projects, see page 150 onward employees in the long term. BASF website) and in direct dialog with external stakeholders. For more information on individual initiatives and our targets, see page 97 onward 1 The assessment model was based on the IPCC climate change scenario SSP1-2.6, supplemented by SSP2-4.5 (medium global warming scenario) and SSP5-8.5 (high global warming scenario).
BASF Report 2021 Management’s Report – Opportunities and Risks 160 In addition to climate-related risks, there are also opportunities. Our broad product portfolio includes, among other things, solutions for the circular economy and climate protection (such as insulation foams for buildings, materials for electromobility and bio-based products). Increased social awareness offers additional market opportunities for these products. We are working with numerous scientific and public organizations and initiatives on solutions for sustainable agriculture that meet economic, environmental, and social demands over the long term. Our decentralized specialists use a central decision tree to docu- ment reportable sustainability risks within the meaning of sec- tion 289b et seq. of the German Commercial Code. No reportable residual net risks within the meaning of section 289b et seq. of the German Commercial Code were identified for 2021. For more information on sustainability management, see page 45 onward For more information on energy and climate protection, see page 126 onward For more information on opportunities and risks from energy policies, see page 155 For more information on our positions on and contributions to climate protection, see basf.com/en/sustainable-solution-steering
BASF Report 2021 161 Contents Corporate To Our Shareholders Management’s Report Corporate Governance Consolidated Financial Statements Governance Overviews 3 Corporate Governance Report 162 Compliance 171 Management and Supervisory Boards 174 Board of Executive Directors 174 Supervisory Board 175 Report of the Supervisory Board 177 Declaration of Conformity Pursuant to Section 161 AktG 184 Declaration of Corporate Governance 185
BASF Report 2021 Corporate Governance – Corporate Governance Report 162 Corporate Governance Report Corporate governance refers to the entire system for managing and supervising a company. This includes its organization, values, corporate principles and guidelines as well as internal and external control and monitoring mechanisms. Effective and transparent corporate governance ensures that BASF is managed and supervised responsibly with a focus on value creation. It fosters the confidence of our investors, the financial markets, our customers and other business partners, employees, and the public in BASF. The fundamental elements of BASF SE’s corporate governance of company management, the Board of Executive Directors agrees be made via a simple majority. In the case of a tied vote, the casting system are: its two-tier system, with a transparent and effective on the corporate goals and strategic direction of the BASF Group as vote is given by the chair of the Board. However, the chair of the separation of company management and supervision between well as its individual business areas; determines the company’s Board does not have the right to veto the decisions of the Board of BASF’s Board of Executive Directors and the Supervisory Board; the internal organization; and decides on the composition of manage- Executive Directors. Members of the Board of Executive Directors equal representation of shareholders and employees on the Super- ment on the levels below the Board. It also manages and monitors are authorized to make decisions individually in their assigned areas visory Board; and the shareholders’ rights of co-administration and BASF Group business by planning and setting the corporate of responsibility. supervision at the Annual Shareholders’ Meeting. budget, allocating resources and management capacities, monitor- ing and making decisions on significant individual measures, and The Board can set up Board committees to consult and decide on Board of Executive Directors supervising operational management. individual issues such as proposed material acquisitions or dives- titures; these must include at least three members of the Board of At a glance The Board’s actions and decisions are geared toward the com- Executive Directors. For the preparation of important decisions, pany’s best interests. It is committed to the goal of sustainably such as those on acquisitions, divestitures, investments and ▪ Responsible for company management and represents BASF SE increasing the company’s value. Among the Board’s responsibilities personnel, the Board has various commissions at the level below in business with third parties is the preparation of the Consolidated and Separate Financial State- the Board. Independently of the affected business area, these com- ▪ Sets goals and strategic direction ments of BASF SE and reporting on the company’s financial and missions carefully assess the planned measures and evaluate the ▪ Strictly separate from the Supervisory Board nonfinancial performance. Furthermore, it must ensure that the associated opportunities and risks. Based on this information, they company’s activities comply with the applicable legislation and report and make recommendations to the Board. regulatory requirements, as well as internal corporate directives. This includes the establishment of appropriate systems for control, com- The Board of Executive Directors informs the Supervisory Board Direction and management by the Board of Executive pliance and risk management as well as establishing a company-wide regularly, without delay and comprehensively, of all issues important Directors compliance culture with undisputed standards. to the company with regard to planning, business development, risk situation, risk management and compliance. Furthermore, the Board The Board of Executive Directors is responsible for the management Decisions that are reserved for the Board as a whole by law, through of Executive Directors coordinates the company’s strategic orienta- of the company, and represents BASF SE in business undertakings the Board of Executive Directors’ Rules of Procedure or through tion with the Supervisory Board. with third parties. BASF’s Board of Executive Directors is strictly resolutions adopted by the Board, are made at regularly held Board separated from the Supervisory Board, which monitors the Board of meetings called by the chair of the Board of Executive Directors. The Statutes of BASF SE and the Supervisory Board have defined Executive Directors’ activities and decides on its composition. Board decisions are based on detailed information and analyses certain transactions that require the Board of Executive Directors to A member of the Board of Executive Directors cannot simulta- provided by the business areas and specialist units, and, if deemed obtain the Supervisory Board’s approval prior to their conclusion. neously be a member of the Supervisory Board. As the central duty necessary, by external consultants. Board decisions can generally Such cases include the acquisition and disposal of enterprises and
BASF Report 2021 Corporate Governance – Corporate Governance Report 163 parts of enterprises, as well as the issue of bonds or comparable Two-tier management system of BASF SE financial instruments. However, this is only necessary if the acquisi- tion or disposal price or the amount of the issue in an individual case Board of Executive Directors Supervisory Board exceeds 3% of the equity reported in the last approved Consoli- dated Financial Statements of the BASF Group. For more information on risk management, see the Forecast from page 151 onward appoints the Board of Executive Directors The members of the Board of Executive Directors, including their areas of responsibility and memberships on the supervisory bodies of other companies, are listed from page 174 onward monitors the Board of Executive Directors Compensation of the Board of Executive Directors is described in the Compensation Report at basf.com/compensationreport advises the Board of Executive Directors Competence profile, diversity concept and succession reports to Supervisory Board planning for the Board of Executive Directors 6 members 12 members appointed by the Supervisory Board 6 shareholder representatives elected by the The Supervisory Board works hand in hand with the Board of Chair Annual Shareholders’ Meeting and appointed by the Supervisory Board 6 employee representatives Executive Directors to ensure long-term succession planning for the Chair composition of the Board of Executive Directors. BASF aims to fill elected by the Supervisory Board most Board positions with leaders from within the company. It is the task of the Board of Executive Directors to propose a sufficient number of suitable individuals to the Supervisory Board. Irrespective of these individual criteria, a holistic approach will ulti- The number of members on the Board of Executive Directors is mately determine a person’s suitability for appointment to the Board determined by the Supervisory Board. It is guided by insights gained BASF’s long-term succession planning is guided by the corporate of Executive Directors of BASF SE. Both systematic succession by BASF as a company with an integrated leadership culture and is strategy. It is based on systematic management development planning and the selection process aim to ensure that the Board of determined by the needs arising from cooperation within the Board characterized by the following: Executive Directors as a whole has the following profile, which of Executive Directors. The Supervisory Board considers six to be serves as a diversity concept: an appropriate number of Board members given the current busi- – Early identification of suitable leaders of different professional ness composition, future responsibilities associated with develop- backgrounds, nationalities and genders – Many years of management experience in scientific, technical and ment and the fundamental organizational structure of the – Systematic development of leaders through the successful commercial fields BASF Group. assumption of tasks with increasing responsibility, where possible – International experience based on background and/or profes- in different business areas, regions and functions sional experience The current composition of the Board of Executive Directors meets – Desire to shape strategic and operational decisions, and proven – At least one female Board member the competence profile and the requirements of the diversity success in doing so, as well as leadership skills, especially under – A balanced age distribution to ensure the continuity of the Board’s concept in full. challenging business conditions work and enable seamless succession planning – Role model function in putting corporate values into practice The first appointment of members of the Board of Executive Direc- The aim is to enable the Supervisory Board to ensure a reasonable tors is for a term of no more than three years. The standard age level of diversity with respect to education and professional experi- limit for members of the Board of Executive Directors is 63. ence, cultural background, international representation, gender and age when appointing members of the Board of Executive Directors.
BASF Report 2021 Corporate Governance – Corporate Governance Report 164 Supervisory Board resolution of the Annual Shareholders’ Meeting on June 18, 2020, Supervisory Board is in regular contact with the Board of Executive the period of appointment for newly elected members of the Super- Directors, especially with its chair, outside of meetings as well. At a glance visory Board was reduced from five to four years; and the Statutes A list of the members of the Supervisory Board of BASF SE indicating which members are shareholder were amended accordingly. This ensures that the maximum mem- or employee representatives and their appointments to the supervisory bodies of other companies can be found from page 175 onward ▪ Appoints, monitors and advises Board of Executive Directors bership duration of 12 years up to which a Supervisory Board Compensation of the Supervisory Board is described in the Compensation Report at ▪ Four Supervisory Board committees member can be classified as independent corresponds to a total of basf.com/compensationreport three election terms. In accordance with the German Corporate The Statutes of BASF SE and the Employee Participation Agreement can be found at ▪ Composition criteria: professional and personal qualifications, Governance Code (Code 2020), the Supervisory Board reduced the basf.com/statutes and basf.com/en/corporategovernance diversity, and independence membership duration used as a basis for its independence rating from 15 to 12 years in December 2019. Personnel Committee Supervision of company management by the Supervisory The meetings of the Supervisory Board and its four committees are Board called by their respective chairs and, independently, at the request Members of one of their members or the Board of Executive Directors. The Dr. Kurt Bock* (chair) The Supervisory Board appoints the members of the Board of shareholder and employee representatives of the Supervisory Board Franz Fehrenbach Executive Directors and supervises and advises the Board of Execu- prepare for Supervisory Board meetings in separate preliminary Sinischa Horvat* tive Directors on management issues. As members of the Supervi- discussions in each case. Resolutions of the Supervisory Board are Michael Vassiliadis sory Board may not simultaneously be on the Board of Executive passed by a simple majority vote of the participating members. In Directors, a high level of autonomy is already structurally ensured the event of a tie, the vote of the chair of the Supervisory Board, who Duties with regard to the supervision of the Board of Executive Directors. must always be a shareholder representative, shall be the casting – Prepares the appointment of members to the Board of Executive vote. This resolution process is also applicable for the appointment Directors by the Supervisory Board as well as the service con- In addition to the SE Council Regulation, the relevant legal basis for and dismissal of members of the Board of Executive Directors by the tracts to be entered into with members of the Board of Executive the size and composition of the Supervisory Board is provided by Supervisory Board. Resolutions can, as needed, also be made in Directors the Statutes of BASF SE and the Agreement Concerning the writing or through communication outside of the meetings, as long – When making recommendations for appointments to the Board of Involvement of Employees in BASF SE (Employee Participation as no Supervisory Board member objects to this form of passing a Executive Directors, considers professional qualifications, interna- Agreement), which also includes the regulations applicable to resolution. tional experience and leadership skills as well as long-term BASF for implementing the statutory gender quota for the Super- succession planning, diversity, and especially the appropriate visory Board. The German Codetermination Act does not apply to The Board of Executive Directors regularly informs the Supervisory consideration of women BASF SE as a European stock corporation (Societas Europaea, SE). Board about matters such as the course of business and expected – Prepares the resolutions made by the Supervisory Board with developments, the financial position and results of operations, regard to the system and amount of compensation paid to mem- The Supervisory Board of BASF SE comprises 12 members. Six corporate planning, the implementation of the corporate strategy, bers of the Board of Executive Directors members are elected by the shareholders at the Annual Share- business opportunities and risks, as well as risk compliance holders’ Meeting. Six members are elected by the BASF Europa management. The Supervisory Board has embedded the main Betriebs rat (BASF Works Council Europe), the European employee reporting requirements in an information policy. The chair of the representation body of the BASF Group. In accordance with the * Classified by the Supervisory Board as an “independent” member of the Supervisory Board (see page 166 for the criteria used to determine independence)
BASF Report 2021 Corporate Governance – Corporate Governance Report 165 Audit Committee such as Corporate Audit or Compliance; can also view all of Strategy Committee BASF’s business documents and examine these and all other Members assets belonging to BASF. The Audit Committee can also engage Members Dame Alison Carnwath DBE* (chair) experts such as auditors or lawyers to carry out these inspections Dr. Kurt Bock* (chair) Tatjana Diether* Dame Alison Carnwath DBE* Anke Schäferkordt* Financial experts Franz Fehrenbach Michael Vassiliadis Pursuant to the German Corporate Governance Code, Dame Alison Waldemar Helber* Carnwath DBE, chair of the Audit Committee, has special knowl- Sinischa Horvat* Duties edge of, and experience in, applying accounting and reporting stan- Michael Vassiliadis – Prepares the negotiations and resolutions of the Supervisory dards and internal control methods and is familiar with the annual Board for the approval of the Financial Statements, the Consoli- audit. A further financial expert on the Supervisory Board is the vice Duties dated Financial Statements and the Management’s Reports chair of the Supervisory Board, Franz Fehrenbach. – Handles the further development of the company’s strategy including the Nonfinancial Statements and discusses the quar- – Prepares resolutions of the Supervisory Board on the company’s terly statements and the half-year financial report with the Board major acquisitions and divestitures of Executive Directors prior to their publication Nomination Committee – Deals with monitoring the financial reporting process, the annual audit, the effectiveness of the internal control system, the risk Members Meetings and meeting attendance management system, and the internal auditing system as well as Dr. Kurt Bock* (chair) compliance issues Prof. Dr. Thomas Carell* In the 2021 business year, meetings were held as follows: – Is responsible for business relations with the company’s external Dame Alison Carnwath DBE* – The Supervisory Board met five times. auditor: prepares the Supervisory Board’s proposal to the Annual Liming Chen* – The Personnel Committee met three times. Shareholders’ Meeting regarding the selection of an auditor, Franz Fehrenbach – The Audit Committee met five times. monitors the auditor’s independence, defines the focus areas of Anke Schäferkordt* – The Nomination Committee met twice. the audit together with the auditor, negotiates auditing fees, evalu- – The Strategy Committee did not meet. ates the quality of the audit, and establishes the conditions for the Duties provision of the auditor’s nonaudit services; the chair of the Audit – Identifies suitable individuals for the Supervisory Board based on All members attended all meetings of the Supervisory Board. The Committee regularly discusses this with the auditor outside of objectives for the composition decided on by the Supervisory meetings of the Supervisory Board committees were also attended meetings as well Board by all relevant committee members. – Deals with follow-up assessments of key acquisition and invest- – Prepares the recommendations made by the Supervisory Board ment projects for the election of Supervisory Board members for the Annual Due to the coronavirus pandemic, the meetings of the Supervisory – Is responsible for monitoring the internal process of identifying Shareholders’ Meeting Board and its committees in the 2021 business year were held in related party transactions and ensuring adherence to statutory accordance with appropriate safety measures and in compliance approval and disclosure requirements; grants approval of related with restrictions on assembly and travel as per the applicable party transactions infection prevention laws. They took place as in-person meetings – Is authorized to request any information that it deems necessary from the auditor or from the Board of Executive Directors and has a direct right to information from the heads of central departments * Classified by the Supervisory Board as an “independent” member of the Supervisory Board (see page 166 for the criteria used to determine independence)
BASF Report 2021 Corporate Governance – Corporate Governance Report 166 with the additional option of virtual attendance via electronic – Members’ collective knowledge of the chemical sector and the – Availability: Each member of the Supervisory Board ensures that communication. related value chains they invest the time needed to properly perform their role as a For more information on the Supervisory Board’s activities and resolutions in the 2021 business year, – Appropriate knowledge within the body as a whole of finance, member of the Supervisory Board of BASF SE. The statutory see the Report of the Supervisory Board from page 177 onward accounting, financial reporting, law and compliance as well as limits on appointments to governing bodies and the recommen- For an overview of meeting attendance, see basf.com/supervisoryboard/meetings one independent member with accounting and auditing expertise dations of the German Corporate Governance Code must be The Rules of Procedure for the Supervisory Board and its committees can be found at (“financial expert”) within the meaning of section 100(5) of the complied with when accepting further appointments. basf.com/supervisoryboard German Stock Corporation Act (AktG) – At least one member with in-depth experience in innovation, – Age limit and period of membership: Persons who have Competence profile, diversity concept and objectives for the research & development and technology reached the age of 72 on the day of election by the Annual Share- composition of the Supervisory Board – At least one member with in-depth experience in digitalization, holders’ Meeting should generally not be nominated for election. information technology, business models and start-ups Membership on the Supervisory Board should generally not exceed One important concern of good corporate governance is to ensure – At least one member with in-depth experience in human resources, three regular statutory periods in office, which will correspond to that seats on the responsible corporate bodies, the Board of society, communications and the media 12 years in the future. Executive Directors and the Supervisory Board, are appropriately – Specialist knowledge and experience in sectors outside of the filled. On December 21, 2017, the Supervisory Board therefore chemical industry – Independence: To ensure the independent monitoring and con- agreed on objectives for the composition, the competence profile For more information on the Supervisory Board’s competence profile, see sultation of the Board of Executive Directors, the Supervisory and the diversity concept of the Supervisory Board in accordance basf.com/competence-profile/supervisoryboard Board should have an appropriate number of independent mem- with section 5.4.1 of the German Corporate Governance Code in bers on the board as a whole, and an appropriate number of the version dated February 7, 2017, and section 289f(2) no. 6 of the Diversity concept independent shareholder representatives. The Supervisory Board German Commercial Code (HGB). These were expanded on The Supervisory Board strives to achieve a reasonable level of diver- deems this to be the case if more than half of the shareholder December 19, 2019, in particular with respect to the criteria for sity with respect to character, gender, international representation, representatives and at least eight members of the Supervisory assessing independence, based on the new recommendations of professional background, specialist knowledge and experience as Board as a whole can be considered independent. The Supervi- the German Corporate Governance Code, which was revised and well as age distribution, and takes the following composition criteria sory Board’s assessment of independence is based on the criteria amended in 2019 (2020 Code). The guiding principle for the compo- into account: in the current version of the German Corporate Governance Code sition of the Supervisory Board is to ensure qualified supervision and (2020 Code). Among other things, this means that members of guidance for the Board of Executive Directors of BASF SE. For the – At least 30% women and 30% men the Supervisory Board are no longer considered independent if election of shareholder representatives to the Supervisory Board, – At least 30% of members have international experience based on they have been a member of the board for 12 years or longer. The individuals shall be nominated to the Annual Shareholders’ Meeting their background or professional experience Supervisory Board has additionally defined the following principles who can, based on their professional expertise and experience, – At least 50% of members have different educational backgrounds to clarify the meaning of independence: The independence of integrity, commitment, independence and character, successfully and professional experience employee representatives is not compromised by their role as an perform the work of a supervisory board member at an international – At least 30% under the age of 60 employee representative or employment by BASF SE or a Group chemical company. company. Prior membership of the Board of Executive Directors Further composition objectives of BASF SE does not preclude independence following the expiry Competence profile of the statutory cooling-off period of two years. Material trans- The following requirements and objectives are considered essential – Character and integrity: All members of the Supervisory Board actions between a Supervisory Board member or a related party to the composition of the Supervisory Board as a collective body: must be personally reliable and have the knowledge and experi- or undertaking of the Supervisory Board member on the one ence required to diligently and independently perform the work of hand, and BASF SE or a BASF Group company on the other, – Leadership experience in managing companies, associations and a supervisory board member. exclude a member of the Supervisory Board from being qualified networks as independent. A material transaction is defined as one or more
BASF Report 2021 Corporate Governance – Corporate Governance Report 167 transactions in a single calendar year with a total volume of 1% or Compensation of the Board of Executive Directors of the management board (section 76(3a) AktG). There have been more of the sales of the companies involved in each case. In the and the Supervisory Board two female Board members since the appointment of Dr. Melanie same way, if a Supervisory Board member or a related party of a Maas-Brunner to the Board of Executive Directors, effective as of Supervisory Board member has a personal service or consulting The Compensation Report in accordance with section 162 of the February 1, 2021. Since Wayne T. Smith’s departure from the Board agreement with BASF SE or one of its Group companies with an German Stock Corporation Act (AktG) and the assurance statement of Executive Directors on May 31, 2021, the proportion of women annual compensation of over 50% of the Supervisory Board of the substantive and formal audit issued by the auditor, the effec- has been 33.3%. compensation, they do not qualify as independent. Furthermore, tive compensation system for the Board of Executive Directors in if a Supervisory Board member or a related party of a Supervisory accordance with section 87a AktG, as well as the most recent reso- The Board of Executive Directors also decided on new target figures Board member holds more than 20% of the shares in a company lution of the Annual Shareholders’ Meeting on the compensation of for the proportion of women in the two management levels below in which BASF SE is indirectly or directly the majority shareholder, the Supervisory Board in accordance with section 113(3) AktG the Board of Executive Directors of BASF SE: For the second the necessary independence is also not met. have been made publicly available on the BASF website at target-attainment period that ended on December 31, 2021, these basf.com/compensationreport. targets were 12.1% for the proportion of women in the management Status of implementation level directly below the Board, and 7.3% for the level below that. According to the Supervisory Board’s own assessment, its current Commitments to promote the participation of This corresponded to the status at the time these target figures were composition meets all of the requirements of the competence women in leadership positions at BASF SE determined. At the end of the concluded target-attainment period, profile: Nine (five shareholder representatives and four employee women made up 20.0% of the management level directly below representatives) of the 12 current members are considered indepen- The supervisory board of a publicly listed European stock corpora- the Board and 23.2% of the level below that. Both targets were dent based on the above criteria. As of January 2020, shareholder tion (SE) that is composed of the same number of shareholder and therefore significantly exceeded. For the next target-attainment representative Franz Fehrenbach is no longer classified as indepen- employee representatives must, according to section 17(2) of the period from January 1, 2022, to December 31, 2026, the Board of dent, because he has been a member of the Supervisory Board SE Implementation Act, consist of at least 30% women and 30% Executive Directors resolved as targets the quotas achieved as of since January 2008 and no longer meets the criterion of a member- men. Since the 2018 Annual Shareholders’ Meeting, the Super- December 31, 2021: 20.0% for the proportion of women in the ship duration of less than 12 years. Franz Fehrenbach will retire from visory Board of BASF SE comprises four women, of whom two are management level directly below the Board and 23.2% for the level the Supervisory Board on conclusion of the Annual Shareholders’ shareholder representatives and two are employee representatives, below that. Meeting on April 29, 2022. Employee representative Denise and eight men. The Supervisory Board’s composition meets the Schellemans, who has also been a member of the Supervisory statutory requirements. BASF views the further development and promotion of women as a Board since January 2008, and employee representative Michael global duty independent of individual Group companies. It has com- Vassiliadis, who has been a member of the Supervisory Board since As a target figure for the Board of Executive Directors according to mitted to ambitious targets that were further raised in 2020. The August 2004, are likewise no longer considered independent. section 111(5) AktG, the Supervisory Board determined that for the new target is to increase the proportion of women in leadership For more information on the statutory minimum quotas for the number of women and men on the target-attainment period under the German Act on Equal Participa- worldwide to 30% by 2030. BASF will continue to work system- Supervisory Board, see the section after next on this page tion of Men and Women in Management Positions (FüPoG I&II) from atically on expanding the percentage of women in its leadership The independent Supervisory Board members are named under Management and Supervisory Boards January 1, 2017, to December 31, 2021, the Board of Executive team. To achieve this, global measures will be implemented and from page 175 onward An overview of the fulfillment of the competence profile is available at basf.com/supervisoryboard Directors of BASF SE should continue to have at least one female enhanced continuously. member. This represented 12.5% on the date the target was set For more information on women in leadership positions in the BASF Group worldwide, see page 99 (based on eight members of the Board of Executive Directors). For more information on the inclusion of diversity, including promotion of women, see the chapter on Following the entry into force of the German Second Act on Equal Employees in the Management’s Report on page 99 Participation of Men and Women in Management Positions (FüPoG II), The November 2015 Employee Participation Agreement relevant to the composition of the Supervisory Board is available at basf.com/en/corporategovernance if the management board of a listed company consists of more than three persons, at least one woman and one man must be members
BASF Report 2021 Corporate Governance – Corporate Governance Report 168 Shareholders’ rights cerning any item on the agenda and to request information about the same manner, BASF follows all of the nonobligatory suggestions company issues insofar as this is necessary to make an informed of the German Corporate Governance Code. At a glance judgment about the item on the agenda under discussion. Regis- The joint Declaration of Conformity 2021 by the Board of Executive Directors and Supervisory Board of tered shareholders are also entitled to file motions pertaining to BASF SE is rendered on page 184 ▪ Shareholders exercise rights of co-administration and proposals for resolutions made by the Board of Executive Directors For more information on the Declaration of Conformity 2021, the implementation of the Code’s suggestions and the German Corporate Governance Code, see basf.com/en/corporategovernance supervision at Annual Shareholders’ Meeting and Supervisory Board at the Annual Shareholders’ Meeting and to ▪ One share, one vote contest resolutions of the Meeting and have them evaluated for their lawfulness in court. Shareholders who hold at least €500,000 of the Disclosures according to section 315a of the company’s share capital, a quota corresponding to 390,625 shares, German Commercial Code (HGB) and explanatory Shareholders exercise their rights of co-administration and super- are furthermore entitled to request that additional items be added to report of the Board of Executive Directors vision at the Annual Shareholders’ Meeting, which usually takes the agenda of the Annual Shareholders’ Meeting. according to section 176(1) sentence 1 of place within the first five months of the business year. The Annual the German Stock Corporation Act (AktG) Shareholders’ Meeting elects half of the members of the Super- Due to assembly restrictions resulting from the coronavirus pan- visory Board and, in particular, resolves on the formal discharge of demic, the 2021 Annual Shareholders’ Meeting again took place As of December 31, 2021, the subscribed capital of BASF SE was the Board of Executive Directors and the Supervisory Board, the virtually without the physical presence of shareholders in accordance €1,175,652,728.32, divided into 918,478,694 registered shares distribution of profits, capital measures, the authorization of share with special regulations prescribed by the German Act on Measures with no par value. Each share entitles the holder to one vote at the buybacks, changes to the Statutes and the selection of the auditor. in Corporate Law, the Law of Cooperatives, Associations and Foun- Annual Shareholders’ Meeting. Restrictions on the right to vote or dations and Residential Property Law to Combat the Effects of the transfer shares do not exist. The same rights and duties apply to all Each BASF SE share represents one vote. All of BASF SE’s shares COVID-19 Pandemic (GesRuaCOVBekG), which was passed by the shares. According to the Statutes, shareholders are not entitled to are registered shares. Shareholders are obliged to have themselves lower house of the German parliament (Bundestag) in March 2020 receive share certificates. There are neither different classes of entered with their shares into the company share register and to and extended until the end of 2021 with few amendments. To shares nor shares with preferential voting rights (golden shares). provide the information necessary for registration in the share regis- ensure legally compliant execution of this special Annual Share- ter according to the German Stock Corporation Act. There are no holders’ Meeting format, whereby shareholders participated solely The appointment and dismissal of members of the Board of Execu- registration restrictions and there is no limit to the number of shares via electronic communication, some of the aforementioned share- tive Directors is legally governed by the regulations in Article 39 of that can be registered to one shareholder. Only the persons listed in holder rights and options for action were limited or handled in an the SE Council Regulation, section 16 of the SE Implementation Act the share register are entitled to vote as shareholders. Listed share- exceptional manner at this virtual meeting. After again being extended and sections 84 and 85 AktG as well as Article 7 of the Statutes of holders may exercise their voting rights at the Annual Shareholders’ by the Bundestag, these special provisions are valid for Annual BASF SE. Accordingly, the Supervisory Board determines the num- Meeting either personally, through a representative of their choice or Shareholders’ Meetings until August 31, 2022, as well. ber of members of the Board of Executive Directors (at least two), through a company-appointed proxy authorized by the share- appoints the members of the Board of Executive Directors, and can holders to vote according to their instructions. Individual instructions Implementation of the German Corporate nominate a chair, as well as one or more vice chairs. The members are only forwarded to the company on the morning of the day of the Governance Code (GCGC) of the Board of Executive Directors are appointed for a maximum of Annual Shareholders’ Meeting. Voting rights can be exercised five years. The maximum initial term of appointment is three years. according to shareholders’ instructions by company-appointed BASF advocates responsible corporate governance that focuses on Reappointments are permissible. The Supervisory Board can dis- proxies until the beginning of the voting process during the Annual sustainably increasing the value of the company. BASF SE follows miss a member of the Board of Executive Directors if there is serious Shareholders’ Meeting. There are neither voting caps to limit the all of the recommendations of the German Corporate Governance cause to do so. Serious cause includes, in particular, a gross breach number of votes a shareholder may cast nor special voting rights. Code in the version dated December 16, 2019 (Code 2020), the of the duties pertaining to the Board of Executive Directors and a BASF has fully implemented the principle of “one share, one vote.” version in force on submission of the Declaration of Conformity. In vote of no confidence by the Annual Shareholders’ Meeting. All shareholders entered in the share register are entitled to partici- The Supervisory Board decides on appointments and dismissals pate in the Annual Shareholders’ Meetings, to have their say con- according to its own best judgment.
BASF Report 2021 Corporate Governance – Corporate Governance Report 169 According to Article 59(1) of the SE Council Regulation, amend- contingent capital increase serves to grant shares to the holders of An exceptional change of control compensation awarded to out- ments to the Statutes of BASF SE require a resolution of the Annual convertible bonds or warrants attached to bonds with warrants of going members of the Board of Executive Directors has not existed Shareholders’ Meeting adopted with at least a two-thirds majority of BASF SE or a subsidiary, which the Board of Executive Directors is since January 1, 2020, as of the introduction of the amended com- the votes cast, provided that the legal provisions applicable to Ger- authorized to issue up to May 11, 2022, by way of a resolution of the pensation system for the Board of Executive Directors, which was man stock corporations under the German Stock Corporation Act Annual Shareholders’ Meeting on May 12, 2017. A right to subscribe approved by the Annual Shareholders’ Meeting on June 18, 2020. do not stipulate or allow for larger majority requirements. In the case to the bonds shall be granted to shareholders. The Board of Execu- The general rule for severance payments granted for premature of amendments to the Statutes, section 179(2) of the German Stock tive Directors is authorized to exclude the shareholders’ subscription terminations of appointments to the Board of Executive Directors Corporation Act requires a majority of at least three-quarters of the right in certain exceptional cases – as defined in Article 5(9) of the applies, which states that the maximum severance payment may subscribed capital represented. Pursuant to Article 12(6) of the BASF SE Statutes. not exceed the amount of two years’ compensation; however, this Statutes of BASF SE, the Supervisory Board is authorized to resolve may not exceed the compensation for the remaining period of the on amendments to the Statutes that merely concern their wording. At the Annual Shareholders’ Meeting on May 12, 2017, the Board of contract. This applies in particular to the adjustment of the share capital and Executive Directors was authorized to purchase up to 10% of the the number of shares after the redemption of repurchased BASF shares in issue at the time of the resolution (10% of the company’s By contrast, employees of BASF SE and its subsidiaries who are shares and after an issue of shares from authorized capital. share capital) until May 11, 2022. At the discretion of the Board of classed as senior executives will still receive a severance payment if Executive Directors, the purchase can take place on the stock their contract of employment is terminated by BASF within By way of a resolution of the Annual Shareholders’ Meeting on exchange or by way of a public purchase offer directed to all share- 18 months of a change of control event, provided the employee has May 3, 2019, the Board of Executive Directors is authorized, with holders. The Board of Executive Directors is authorized to sell the not given cause for the termination. The employee whose service the consent of the Supervisory Board, to increase, until May 2, repurchased company shares (a) through a stock exchange, contract has been terminated in such a case will receive a maximum 2024, on a one-off basis or in portions on a number of occasions, (b) through a public offer directed to all shareholders and – with the severance payment of 1.5 times the annual salary (fixed component) the company’s share capital by a total of up to €470 million by issu- approval of the Supervisory Board – to third parties, (c) for a cash depending on the number of months that have passed since the ing new shares against contributions in cash or in kind (authorized payment that is not significantly lower than the stock exchange price change of control event. A change of control is assumed when a capital). A right to subscribe to the new shares shall be granted to at the time of sale and (d) for contributions in kind, particularly in shareholder informs BASF of a shareholding of at least 25% or the shareholders. This can also be achieved by a credit institution connection with the acquisition of companies, parts of companies increase of such a holding. The remaining specifications stipulated acquiring the new shares with the obligation to offer these to share- or shares in companies or in connection with mergers. In the cases in section 315a HGB refer to situations that are not applicable to holders (indirect subscription right). The Board of Executive Directors specified under (c) and (d), the shareholders’ subscription right is BASF SE. is authorized to exclude the statutory subscription right of share- excluded. The Board of Executive Directors is furthermore autho- For more information on bonds issued by BASF SE, see basf.com/bonds holders to a maximum amount of a total of 10% of share capital in rized to retire the shares bought back and to reduce the share capital certain exceptional cases that are defined in Article 5(8) of the by the proportion of the share capital accounted for by the retired BASF SE Statutes. This applies in particular if, for capital increases shares. Directors’ and officers’ liability insurance in return for cash contributions, the issue price of the new shares is not substantially lower than the stock market price of BASF shares Bonds issued by BASF SE and its subsidiaries grant the bearer the BASF SE has taken out liability insurance that covers the activities of and the total number of shares issued under this authorization does right to request early repayment of the bonds at nominal value if, members of the Board of Executive Directors and the Supervisory not exceed 10% of the shares currently in issue or, in eligible indi- after the date of issue of the bond, one person – or several persons Board (directors’ and officers’ liability insurance). This policy pro- vidual cases, to acquire companies or shares in companies in acting together – hold or acquire a volume of BASF SE shares that vides for the level of deductibles for the Board of Executive Directors exchange for surrendering BASF shares. corresponds to more than 50% of the voting rights (change of con- as prescribed by section 93(2) sentence 3 AktG (10% of damages trol), and one of the rating agencies named in the bond’s terms and up to 1.5 times the fixed annual compensation). By way of a resolution of the Annual Shareholders’ Meeting on conditions withdraws its rating of BASF SE or the bond, or reduces May 12, 2017, the share capital was increased conditionally by up it to a noninvestment grade rating within 120 days of the change of to €117,565,184 by issuing up to 91,847,800 new shares. The control event.
BASF Report 2021 Corporate Governance – Corporate Governance Report 170 Share ownership by members of the Board of Information on the auditor Executive Directors and the Supervisory Board The Annual Shareholders’ Meeting of April 29, 2021, once again No member of the Board of Executive Directors or the Supervisory elected KPMG AG Wirtschaftsprüfungsgesellschaft as the auditor of Board owns shares in BASF SE and related options or other deriva- the BASF Group Consolidated Financial Statements and Separate tives that account for 1% or more of the share capital. Furthermore, Financial Statements of BASF SE for the 2021 business year, as well the total volume of BASF SE shares and related financial instruments as the corresponding management’s reports. KPMG member firms held by members of the Board of Executive Directors and the also audit the majority of BASF Group companies included in the Super visory Board accounts for less than 1% of the shares issued Consolidated Financial Statements. KPMG has been the continuous by the company. auditor of BASF SE since the 2006 Financial Statements. A public call to tender was issued in 2015 to all auditors for the audit of the Share dealings of the Board of Executive Directors 2016 Consolidated and Separate Financial Statements, in line with and Supervisory Board the E.U. Regulation 537/2014 of April 16, 2014. Based on the (Obligatory reportable and publishable directors’ dealings results of the tendering process, the Audit Committee recom- under Article 19(1) of the E.U. Market Abuse Regulation mended to the Supervisory Board that it once again propose KPMG 596/2014 (MAR)) for election. Owing to the German Financial Market Integrity Strengthening Act (FISG), KPMG can only be proposed for election As legally stipulated by Article 19(1) MAR, all members of the Board by the Annual Shareholders’ Meeting as BASF’s auditor without of Executive Directors and the Supervisory Board as well as certain further tendering processes up to and including the 2023 business members of their families are required to disclose the purchase or year. Dr. Stephanie Dietz has been the auditor responsible for the sale of financial instruments of BASF SE (for example, shares, Consolidated Financial Statements since auditing the 2020 Financial bonds, options, forward contracts, swaps) to the German Federal Statements. Since the 2020 Financial Statements, the auditor Financial Supervisory Authority (Bundesanstalt für Finanzdienst- responsible for the Separate Financial Statements has been leistungsaufsicht) and to the company if transactions within the Dr. Stephan Kaiser. The total fee paid to KPMG and auditing firms calendar year exceed the threshold of €20,000. In 2021, a total of of the KPMG group by BASF SE and other BASF Group com- 26 purchases by members of the Board of Executive Directors and panies for non-audit services, in addition to the auditing fee, was the Supervisory Board and members of their families subject to €0.9 million in 2021. This represents around 4.7% of the fees for disclosure were reported as directors’ dealings, involving between auditing the financial statements. 18 and 2,500 BASF shares or BASF ADRs (American Depositary For more information, see Note 32 to the Consolidated Financial Statements on page 285 Receipts). The price per share was between €61.08 and €72.00. The volume of the individual trades was between €1,217.41 and €171,694.75. The disclosed share transactions are published on BASF SE’s website. For more information on securities transactions reported in 2021, see basf.com/en/directorsdealings
BASF Report 2021 Corporate Governance – Compliance 171 Compliance GRI 102, 103, 205, 206, 406, 407, 408, 409, 412, 413, 418, 419 Our Group-wide Compliance Program aims to ensure adherence to legal regulations, the company’s internal guidelines and ethical business practices. Our Code of Conduct firmly embeds these mandatory standards into our employees’ day-to-day business. Members of the Board of Executive Directors are also expressly obligated to follow these principles. Compliance Program and Code of Conduct We care We Earn Trust We Play Fair We Respect We Protect At a glance – Our Code of Conduct – Anti-Corruption – Antitrust Laws – Human Rights, Labor – Sensitive Company >53,000 77 – How We Make – Trade Control – Gifts and Entertainment and Social Standards Information participants in internal audits on adherence to Decisions – Anti-Money Laundering – Conflicts of Interest – Environmental – Personal Data compliance training our compliance standards – We Always Speak Up Protection, Health and – Digital Responsibility – We Lead Integrity Safety – Company Property ▪ Code of Conduct as the core of our Compliance Program ▪ Systematic further development of our compliance management – Accurate Books and system Records BASF’s Compliance Program is based on our corporate values A new platform for publishing binding Group-wide governance docu- focus on Group companies in 2021. The regular compliance audits and voluntary commitments, as well as international standards. It ments (policies, corporate requirements) provides a more effective performed by the Corporate Audit department are another source of describes our commitment to responsible conduct and expectations search function to make it easier for employees to find relevant regu- information for the systematic identification of risks. These risks are around how all BASF employees interact with business partners, lations. In addition, the managing directors of BASF Group compa- documented in the relevant risk or audit report. The same applies to officials, coworkers and the community. At the core of our Compli- nies can now find important information and assistance on ensuring specific risk minimization measures as well as the time frame for ance Program is the global, standardized Code of Conduct. All compliance in their Group companies on an internal website set up their implementation. employees and managers are obligated to adhere to its guidelines, especially for them. which cover topics ranging from corruption and antitrust laws to One key element in the prevention of compliance violations is human rights, labor and social standards, conflicts of interest and Abiding by compliance standards is the foundation of responsible compulsory training and workshops held as classroom or online trade control, and protection of data privacy. leadership. This has also been embedded in our values. We are courses. All employees are required within a prescribed time frame convinced that compliance with these standards will play a key role to take part in basic compliance training, refresher courses and The revised 2020 version also offers our employees user-friendly in securing our company’s long-term success. Our efforts are princi- special tutorials dealing with, for example, antitrust legislation, taxes features such as case studies, FAQs and additional references. The pally aimed at preventing violations from the outset. or trade control regulations. Newly appointed senior executives also corresponding internal online platform and app are available to receive special training on leading with integrity. Course materials employees worldwide, providing them continuously with up-to-date We perform a systematic risk assessment to identify the risk of and formats are constantly updated, taking into account the spe- content such as videos and links to other specialist units and guide- compliance violations, including corruption risks. These are con- cific risks of individual target groups and business areas. In total, lines as well as direct contact to subject specialists. ducted at divisional, regional and country levels, with an additional
BASF Report 2021 Corporate Governance – Compliance 172 more than 53,000 participants worldwide received over 79,000 hours compliance officers. The internal platform and the corresponding and make sure that the established processes, procedures and of compliance training in 2021. app also help employees to access advice by enabling direct con- monitoring tools are appropriate and sufficient to minimize potential For more information on the BASF Code of Conduct, see basf.com/code_of_conduct tact. In addition, we have set up more than 50 external hotlines risks or preclude violations in the first place. In 2021, 77 audits of worldwide that our employees can use – including anonymously – to this kind were performed Group-wide (2020: 61). Our compliance report potential violations of laws or company guidelines. We management system itself is also regularly audited by the internal Compliance culture at BASF enhanced and standardized these hotlines in 2021. An independent Corporate Audit department, most recently in November 2018. external company was engaged to manage all hotlines. In the future, Overall, the audits confirmed the effectiveness of the compliance We firmly believe that for corporate responsibility to be a success, the cases reported will be recorded and processed in one global management system. In cooperation with an external consulting there must be an active culture of living these guidelines within the system. In addition to local phone numbers, a new website now also firm, we developed a comprehensive action plan in 2021 to ensure company. Our compliance standards were consolidated in the makes it possible to get in contact online using a computer or the systematic, continuous optimization of the compliance manage- global Code of Conduct in 2013 and republished in June 2020 in smartphone. All hotlines and the website are also open to the public. ment system. our currently applicable global Code of Conduct. They are firmly Each concern is documented according to specific criteria, properly established and recognized. We expect all employees to act in line investigated in line with standard internal procedures and answered We monitor our business partners in sales for potential compliance with these compliance principles. Managers play a key role here – as quickly as possible. The outcome of the investigation as well as risks based on the global Guideline on Business Partner Due they serve as an example of and communicate our values and cul- any measures taken are documented accordingly and included in Diligence using a checklist, a questionnaire and an internet-based ture both internally and externally. To specifically address compli- internal reports. analysis. The results are then documented. If business partners are ance and integrity as a leadership task, a workshop series was held not prepared to answer the questionnaire, we do not enter into a in 2021 with more than 130 senior executives. In 2021, 277 reports were received by our external hotlines (2020: business relationship with them. A dedicated global Supplier Code 387). The information received related to all categories of our Code of Conduct applies to our suppliers, which covers compliance with of Conduct, including environmental and human rights issues, cor- environmental, social and corporate governance standards, among Monitoring adherence to our compliance principles ruption and handling of company property. We carefully investigated other requirements. As part of our trade control processes, we also all cases of suspected misconduct that came to our attention and, check whether persons, companies or organizations appear on BASF’s Chief Compliance Officer (CCO) reports directly to the Chair- when necessary, took countermeasures on a case-by-case basis. sanction lists due to suspicious or illegal activities, and whether man of the Board of Executive Directors and manages the further These included, for example, improved control mechanisms, addi- there are business processes with business partners from or in development of our global compliance organization and our Compli- tional informational and training measures, clarification and expan- countries under embargo. ance Management System. The CCO is supported in this task by sion of the relevant internal regulations, as well as disciplinary the Compliance unit and more than 100 compliance officers world- measures as appropriate. Most of the justified cases related to We support the United Nations’ Guiding Principles on Business and wide in the regions and countries as well as in the divisions, service personal misconduct in connection with the protection of company Human Rights and are constantly working to enhance our internal units and in the Corporate Center. Material compliance topics are property, inappropriate handling of conflicts of interests or gifts and guidelines and processes in keeping with these principles. For regularly discussed in the compliance committees established at invitations. In such isolated cases, we took disciplinary measures in example, there is an internal guideline to respect international global and regional level. The CCO reports to the Supervisory accordance with uniform internal standards and also pursued claims labor and social standards that is applicable throughout the Board’s Audit Committee in at least one of its meetings each year on for damages where there were sufficient prospects of success. Group. Outside of our company, too, we support respect for human the status of the Compliance Program as well as any major develop- In 2021, violations of our Code of Conduct led to termination of rights and the fight against corruption. We are a founding member ments. In the event of significant incidents, the Audit Committee is employment in a total of 32 cases (2020: 31). This relates to diverse of the United Nations Global Compact. As a member of Transparency immediately informed by the Board of Executive Directors. employee groups, including executives. International Deutschland and the Partnering Against Corruption Initiative (PACI) of the World Economic Forum, we assist in the We particularly encourage our employees to actively and promptly BASF’s Corporate Audit department monitors adherence to implementation of these organizations’ objectives. seek guidance if in doubt. They can consult their supervisors, spe- compliance principles, covering all areas in which compliance viola- cialist departments, such as the Legal department, and company tions could occur. They check that employees uphold regulations
BASF Report 2021 Corporate Governance – Compliance 173 As prescribed by BASF’s Code of Conduct and corporate values, we adhere to uniformly high standards and integrity regarding tax-related issues. To aid in the achievement of the U.N. SDGs and to meet our own standards for the creation of economic and social value, we contribute to public finances in accordance with legal requirements and our corporate values. BASF’s Value to Society method considers taxes paid by BASF to be a social advantage. In 2020, we developed and published the BASF tax principles, which are binding for all Group entities. For more information on the Supplier Code of Conduct and supplier assessments, see page 109 onward For more information on the Code of Conduct, see basf.com/code_of_conduct For more information on human rights and labor and social standards, see basf.com/human_rights For more information on on tax principles, see basf.com/en/corporategovernance
BASF Report 2021 Corporate Governance – Board of Executive Directors 174 Management and Supervisory Boards Board of Executive Directors There were six members on the Board of Executive Directors of BASF SE as of December 31, 2021. As part of its long-term succession planning and in line with its diversity concept, the Supervisory Board appointed Dr. Melanie Maas-Brunner as a member of the Board of Executive Directors on December 17, 2020. The Board of Executive Directors therefore temporarily comprised seven members from February 1, 2021, until the departure of Wayne T. Smith as of May 31, 2021. Some of the responsibilities within the Board of Executive Directors were reallocated effective June 1, 2021, as a result of this change. The composition of the Board of Executive Directors and the responsibilities of individual members are as follows: First Term Supervisory board mandates within the meaning of Comparable German and Responsibilities (as of February 21, 2022) appointed expires section 100(2) of the German Stock Corporation Act non-German supervisory bodies Dr. Martin Brudermüller Corporate Legal, Compliance & Insurance; 2006 2023 Mercedes-Benz Group AG ª (until March 31, 2022: Daimler AG) – Chairman of the Board of Executive Directors Corporate Development; (member of the Supervisory Board since March 31, 2021) Degree: Chemistry, 60 years old Corporate Communications & Government Relations; 34 years at BASF Corporate Human Resources; Mercedes-Benz AG (Mercedes-Benz Group AG group company) Corporate Investor Relations (member of the Supervisory Board since April 22, 2021) Dr. Hans-Ulrich Engel Corporate Finance; 2008 2023 Wintershall Dea AG Nord Stream AG (member of the Vice Chairman of the Board of Executive Directors Corporate Audit; (Chairman of the Supervisory Board since November 2, 2021; Shareholders’ Committee) Degree: Law, 62 years old Corporate Taxes & Duties; Deputy Chairman of the Supervisory Board until b 34 years at BASF Global Business Services; November 1, 2021) Global Digital Services; Wintershall AG b Global Procurement (Chairman of the Supervisory Board) Saori Dubourg Agricultural Solutions; Care Chemicals; Nutrition & Health; 2017 2025 Wintershall Dea AG _ b Degree: Business, 50 years old Europe (member of the Supervisory Board) 25 years at BASF Michael Heinz Monomers; Performance Materials; Petrochemicals; Intermediates; 2011 2024 Wintershall Dea AG BASF Antwerpen N.V. b Degree: MBA, 57 years old North America; South America (member of the Supervisory Board) (Chairman of the Administrative 38 years at BASF Council until May 31, 2021) Dr. Markus Kamieth Catalysts; Coatings; Dispersions & Resins; Performance Chemicals; 2017 2025 – Solenis UK International Ltd. Degree: Chemistry, 51 years old Greater China; South & East Asia, ASEAN & Australia/New Zealand; (member of the Board of Directors 23 years at BASF Mega Projects Asia until December 31, 2021) Dr. Melanie Maas-Brunner Corporate Environmental Protection, Health & Safety; 2021 2024 – BASF Antwerpen N.V. (since February 1, 2021) European Site & Verbund Management; Global Engineering Services; (Chairwoman of the Administrative Degree: Chemistry, 53 years old Advanced Materials & Systems Research; Bioscience Research; Council since June 1, 2021) 25 years at BASF Process Research & Chemical Engineering; BASF New Business Wayne T. Smith 2012 2021 – Inter Pipeline Ltd. (until May 31, 2021) (member of the Board of Directors) Degrees: Chemical Engineering, MBA, 61 years old 17 years at BASF a Publicly listed b Internal membership within the meaning of section 100(2) sentence 2 of the German Stock Corporation Act
BASF Report 2021 Corporate Governance – Supervisory Board 175 Supervisory Board In accordance with the Statutes, the Supervisory Board of BASF SE comprises 12 members. The term of office of the Supervisory Board commenced following the Annual Shareholders’ Meeting on May 3, 2019, in which the shareholder representatives on the Supervisory Board were elected. In accordance with the applicable article of the Statutes as of the date of election, it terminates upon conclusion of the Annual Shareholders’ Meeting that resolves on the discharge of members of the Supervisory Board for the fourth complete business year after the term of office commenced; this is the Annual Shareholders’ Meeting on April 25, 2024. The Supervisory Board comprises the following members (as of February 21, 2022): Member of the Super- Memberships of statutory supervisory boards Memberships of comparable domestic and foreign supervisory bodies visory Board since in Germany of commercial enterprises 1 3 Dr. Kurt Bock, Heidelberg, Germany* June 18, 2020 Fuchs Petrolub SE (chair) – 3 Chairman of the Supervisory Board of BASF SE Bayerische Motoren Werke Aktiengesellschaft (member) Former Chairman of the Board of Executive Directors of BASF SE (until May 2018) Franz Fehrenbach, Stuttgart, Germany1 4 4 January 14, 2008 Robert Bosch GmbH (chair until December 31, 2021) Stihl Holding AG & Co. KG (member of the Advisory Board) 3 3 Vice Chairman of the Supervisory Board of BASF SE Stihl AG (Stihl Holding AG & Co. KG group company) Linde plc (member of the Board of Directors) Former Chairman of the Supervisory Board of Robert Bosch GmbH (vice chair) (until December 31, 2021) 2 Sinischa Horvat, Limburgerhof, Germany* May 12, 2017 – – Vice Chairman of the Supervisory Board of BASF SE Chairman of the Works Council of BASF SE, Ludwigshafen Site; Chairman of BASF’s Joint Works Council and of the BASF Works Council Europe 1 Prof. Dr. Thomas Carell, Munich, Germany* May 3, 2019 – – Professor of Organic Chemistry at Ludwig Maximilians University Munich 1 3 Dame Alison Carnwath DBE, Exeter, England* May 2, 2014 – Zurich Insurance Group AG (independent, non-executive member of the Board of Directors) 4 Senior Advisor Evercore Partners Zürich Versicherungs-Gesellschaft AG (Zurich Insurance Group AG group company) (independent, non-executive member of the Board of Directors) 3 PACCAR Inc. (independent member of the Board of Directors) 4 Coller Capital Ltd. (non-executive member of the Board of Directors) 4 Broadwell Capital Limited (non-executive member of the Board of Directors) 4 Asda Group Limited (non-executive member of the Board of Directors since December 1, 2021) EG Group Holdings Limited4 (non-executive member of the Board of Directors and chair of the audit committee since March 1, 2021) * Classified by the Supervisory Board as an “independent” member of the Supervisory Board (see page 166 for the criteria used to determine independence) 1 Shareholder representative 2 Employee representative 3 Publicly listed 4 Not publicly listed
BASF Report 2021 Corporate Governance – Supervisory Board 176 Continued from previous page Member of the Super- Memberships of statutory supervisory boards Memberships of comparable domestic and foreign supervisory bodies visory Board since in Germany of commercial enterprises 1 4 Liming Chen, Beijing, China* October 8, 2020 – IBM China Investment Company Ltd. (chair, intragroup membership) 4 Chairman IBM Greater China Group IBM (China) Company Ltd. (chair, intragroup membership) 4 IBM Global Services (DaLian) Company Limited (chair, intragroup membership) 4 IBM Solution and Services (ShenZhen) Company Ltd. (chair, intragroup membership) 4 IBM Financing and Leasing Company Ltd. (chair, intragroup membership) 4 IBM Factoring (China) Company Ltd. (chair, intragroup membership) Inspur Power Commercial Systems Company Ltd.4 (chair, intragroup membership) Tatjana Diether, Limburgerhof, Germany*2 May 4, 2018 – – Deputy Chairwoman of the Works Council of BASF SE, Ludwigshafen Site, and member of the BASF Works Council Europe 2 Waldemar Helber, Otterbach, Germany* April 29, 2016 – – Member of the Works Council of BASF SE, Ludwigshafen Site 1 4 3 Anke Schäferkordt, Cologne, Germany* December 17, 2010 Serviceplan Group Management SE Wayfair Inc. (non-executive director) Member of the Supervisory Board (partner with unlimited liability of Serviceplan Group SE & Co. KG) (member) 3 Bayerische Motoren Werke Aktiengesellschaft (member) 2 Denise Schellemans, Brecht, Belgium January 14, 2008 – – Full-time trade union delegate 2 4 Roland Strasser, Riedstadt, Germany* May 4, 2018 AbbVie Komplementär GmbH (member) – 4 Regional Manager of the Rhineland-Palatinate/Saarland branch of IG BCE V & B Fliesen GmbH (member) 3 Villeroy & Boch AG (member) 2 4 Michael Vassiliadis, Hannover, Germany August 1, 2004 Steag GmbH (member) – 3 Chairman of the Mining, Chemical and Energy Industries Union RAG Aktiengesellschaft (vice chair) 3 Henkel AG & Co. KGaA (member) 4 Vivawest GmbH (member) * Classified by the Supervisory Board as an “independent” member of the Supervisory Board (see page 166 for the criteria used to determine independence) 1 Shareholder representative 2 Employee representative 3 Publicly listed 4 Not publicly listed
Report of the Supervisory Board BASF Report 2021 Corporate Governance – Report of the Supervisory Board 177 Report of the conditions vital to this, such as the European Green Deal and upcoming regulation of the chemical industry in the E.U., are currently difficult to assess and were the subject Supervisory Board of in-depth discussion. The Supervisory Board expressly supports this approach and is following it closely, both in an advisory capacity and through regular and critical monitoring. It would like to thank the Board of Executive Directors and all employees worldwide for their dedi- cation, extraordinary work and outstanding results in the 2021 business year. We will drive forward change in the Supervisory Board, too. Anke Schäferkordt, Franz Fehrenbach, Denise Schellemans, Waldemar Helber and Roland Strasser will resign from the Supervisory Boar d on conclusion of the Annual Shareholders’ Meeting on April 29, 2022. As a result, its composition will once again change quite significantly compared with the start of the current term of office in 2019. Unfortunately, the new shareholder representatives will again not be able to be elected at a physical Annual Shareholders’ Meeting in 2022. The Supervisory Board deeply regrets this, as it believes that it is the ideal place to discuss BASF’s development with you. However, after intensive consultation, the Supervisory Board concurred with the Board of Executive Directors’ assessment that, from today’s perspective, it will not be possible to hold a physical Annual Shareholders’ Meeting in a responsible manner at the end of April this year given the current situation. BASF’s business developed extremely well in 2021. Growth and earnings were Monitoring and consultation in an ongoing dialog with the Board of considerably higher than expected at the beginning of the year. The Board of Execu- Executive Directors tive Directors decisively seized the opportunities that arose, strengthened BASF’s overall competitiveness and laid important groundwork for the future. They did so in In 2021, the Supervisory Board of BASF SE exercised its duties as required by law and an exceptionally challenging environment, including a sharp rise in raw materials and the Statutes with the utmost care. It regularly monitored the management of the Board energy prices, strained conditions in many international supply chains, and problems of Executive Directors and provided advice on the company’s strategic development with production and volumes in the automotive industry, which is particularly impor- and important individual measures, about which the Supervisory Board was regularly tant for BASF. In addition, political tensions have increased and global economic and thoroughly informed by the Board of Executive Directors. This occurred both activity has become even more demanding overall. Most of these factors will continue during and outside of the meetings of the Supervisory Board and its committees in the to challenge us in 2022. form of written and oral reports on, for example, all of the major financial key perfor- mance indicators (KPIs) of the BASF Group and its segments, the economic situation The Board of Executive Directors has enhanced and refined the portfolio and driven in the main sales and procurement markets, and on deviations in business develop- forward important investments for profitable growth. Above all, it defined ambitious ments from original plans. Furthermore, the Supervisory Board tackled fundamental targets to further reduce CO emissions at an early stage and presented a package questions of corporate planning, including financial, investment, sales volumes and 2 of measures aimed at increasing sustainability in the BASF Group. The underlying personnel planning, as well as measures for designing the future of research and
BASF Report 2021 Corporate Governance – Report of the Supervisory Board 178 development. Regular topics of discussion were occupational and process safety and A significant component of all Supervisory Board meetings was the Board of Executive matters relating to sustainability, the environmental and social impact of the com- Directors’ reports on the current business situation with detailed information on sales pany’s activities and the challenges of climate change for the future development of and earnings development, as well as on opportunities and risks for business develop- BASF’s business. The Supervisory Board discussed in detail the reports from the ment, the status of important investment projects (current and planned), operational Board of Executive Directors, and also deliberated on prospects for the company and excellence, important aspects of economic, environmental and social sustainability, its individual business areas with the Board of Executive Directors. It was convinced developments on the capital markets, significant managerial measures taken by the of the lawfulness, expediency and propriety of the Board of Executive Director’s Board of Executive Directors, and innovation projects. com pany leadership. In all meetings held in 2021, the Supervisory Board also discussed the progress of The Chairman of the Supervisory Board and the Chairman of the Board of Executive major investments and ongoing portfolio projects. Discussions focused on: Directors were also in regular contact outside of Supervisory Board meetings. The Chairman of the Supervisory Board was always promptly and comprehensively – The development of the joint venture Wintershall Dea created by the merger of the informed of current developments and significant individual issues. The Supervisory oil and gas businesses of BASF and LetterOne Board was involved at an early stage in decisions of major importance. The Super- – The investment in a joint venture with Shanshan to produce battery materials in visory Board passed resolutions on all of those individual measures taken by the China Board of Executive Directors which by law or the Statutes required the approval of the – The progress and opportunities and risks of the investment project to establish a Supervisory Board. new Verbund site in southern China – The progress and completion of the sale of the pigments business Supervisory Board meetings Important topics addressed by the Supervisory Board, which were discussed with the Board of Executive Directors at all meetings, were the effects, challenges and oppor- The Supervisory Board held five meetings in the 2021 business year, each of which tunities of climate change and, in particular, the European Green Deal and the resulting was attended by all members. The meetings were held in person with most Super- changes in the regulatory environment. The Supervisory Board is convinced that the esent. Only at the meeting prior to the virtual visory Board members physically pr successful management of the necessary, fundamental transformation process, Annual Shareholders’ Meeting did the majority of members also participate virtually. which affects all stages of the value chain, is key to BASF’s future and long-term The members of the Supervisory Board elected by shareholders and those elected by success, not least with regard to society’s and investors’ likely expectations. These the employees prepared for the meetings in separate preliminary discussions in each topics were also the main focus of the Supervisory Board’s strategy meeting in case, which were also attended by members of the Board of Executive Directors. October 2021. All members of the Board of Executive Directors attended the Supervisory Board At its meeting on February 24, 2021, the Supervisory Board reviewed and approved meetings unless it was deemed appropriate that the Supervisory Board discuss the Consolidated Financial Statements, Management’s Report and the proposal for individual topics – such as personnel matters relating to the Board of Executive the appropriation of profit for the 2020 business year as presented by the Board Directors – without them being present. In addition, each Supervisory Board meeting of Executive Directors. It also discussed the agenda for the Annual Shareholders’ includes an agenda item that provides an opportunity for discussion without the Meeting on April 29, 2021, and adopted its proposals for resolutions. Since, due to Board of Executive Directors (executive session). the continuing effects of the coronavirus pandemic, the Supervisory Board considered An individual overview of attendance at meetings of the Supervisory Board and its committees will be made available on the it impossible to hold a physical meeting, it agreed to again hold the Annual Share- company website at basf.com/supervisoryboard/meetings holders’ Meeting as a virtual event without the physical presence of shareholders. Other topics discussed at the meeting were business conditions and development as well as opportunities and risks for BASF’s business in China, the world’s largest
BASF Report 2021 Corporate Governance – Report of the Supervisory Board 179 chemical market, the project to construct a new Verbund site in southern China, and Compensation and composition of the Board of Executive Directors current business developments, opportunities and challenges in the Petrochemicals division. In several meetings over the 2021 business year, the Supervisory Board discussed and passed resolutions on the compensation of the Board of Executive Directors. The Supervisory Board met on April 28, 2021, one day before the virtual Annual Matters relating to the composition of the Board of Executive Directors did not arise Shareholders’ Meeting, primarily to prepare for the Annual Shareholders’ Meeting. in 2021. Another topic was the shareholding in the Wintershall Dea joint venture. At its meeting on February 24, 2021, the Supervisory Board deliberated and agreed The main agenda items at the meeting on July 22, 2021, were BASF’s leadership on the 2021 targets for the Board of Executive Directors based on the preparations of development and personnel concept, the development and management of pension the Personnel Committee. It also discussed and resolved on the final performance obligations, the development of the Global Business Services unit, and market oppor- factors for the Board of Executive Directors’ short-term and long-term incentives tunities and risks in connection with the European Green Deal. for 2020. At its meeting on December 16, 2021, the Supervisory Board evaluated, based on the discussions and the corresponding recommendation of the Personnel At the strategy meeting on October 21/22, 2021, the Board of Executive Directors Committee, the Board of Executive Directors’ performance in 2021 and set the and the Supervisory Board discussed at length the status of implementation of the performance factor for the short-term incentive 2021 and the strategic performance corporate strategy with a particular focus on growth, strengthening profitability and factors for the deferral compensation components for 2018–2021 and 2019–2022. portfolio development, as well as key aspects of BASF’s strategic development. These The Chairman of the Supervisory Board abstained from the resolution on the factor for included: the performance bonus for 2018–2021 as this affected him personally. For more information on the compensation of the Board of Executive Directors and the Supervisory Board, see the Compensation – The development of research and development activities Report, which has been made publicly available on the company’s website at basf.com/compensationreport – E-mobility and the transformation of the automotive industry as factors influencing the development of the BASF Group – Market prospects and growth opportunities in China as the largest regional market Committees for chemical products; growth projects such as the Verbund site in southern China and the further expansion of the battery materials business The Supervisory Board of BASF SE has four committees: 1. the committee for – Climate change and the European Green Deal and their effects on BASF, as well as personnel matters of the Board of Executive Directors and the granting of loans in the resulting development paths, opportunities and risks accordance with section 89(4) of the German Stock Corporation Act (Personnel – The status, development and prospects of selected BASF business areas Committee); 2. the Audit Committee; 3. the Nomination Committee; and 4. the Strategy Committee. Following each Committee meeting, the chairs of the Commit- At its meeting on December 16, 2021, the Supervisory Board discussed and approved tees reported in detail about the meetings and the activities of the Committees at the the Board of Executive Directors’ operational and financial planning, including the subsequent meeting of the Supervisory Board. investment budget for 2022, and, as in previous years, authorized the Board of Execu- For information on the composition of the committees and the tasks assigned to them by the Supervisory Board, see the tive Directors to procure the necessary financing in 2022 within a set limit. In addition, Corporate Governance Report from page 164 onward the Supervisory Board discussed the Board of Executive Directors’ recommendation that, given the uncertainty surrounding the further development of the coronavirus pandemic and potential restrictions, the Annual Shareholders’ Meeting on April 29, 2022, is also held as a virtual event. The Supervisory Board agreed to this following extensive deliberation and consideration of the resulting, unavoidable restrictions of shareholder rights compared with a physical meeting.
BASF Report 2021 Corporate Governance – Report of the Supervisory Board 180 The Personnel Committee met three times during the reporting period. All commit- KPMG for such services to a very limited extent, or granted approval in individual tee members attended all meetings. At its meeting on February 24, 2021, the Person- cases. At the meeting on December 15, 2021, the auditors responsible reported nel Committee discussed the targets for the Board of Executive Directors for the 2021 on the status of the annual audit, as well as the focus areas of the audit and the business year and the 2020 Compensation Report. At its meeting on July 21, 2021, most important individual items. The Audit Committee also addressed the effects of the Personnel Committee addressed the status of leadership development at the top the German Financial Market Integrity Strengthening Act on appointing KPMG as levels of management below the Board of Executive Directors and long-term succes- an auditor in the future. Due to the change in the rules on auditor rotation, it is now sion planning for the Board of Executive Directors. At its meeting on December 16, possible to last appoint KPMG for the 2023 business year. 2021, the Personnel Committee discussed the appropriateness of the compensation of the Board of Executive Directors, the assessment of the Board’s performance in Other important agenda items included providing guidance to the Board of Executive 2021 and a proposal for the performance-related variable compensation of the Board Directors on accounting issues, the control system established by the Board of of Executive Directors. Execu tive Directors, and follow-up assessments of acquisition and investment projects. At its meeting on April 27, 2021, the Audit Committee addressed risk man- The Audit Committee met five times during the reporting period. All committee age ment in the BASF Group and the organization of internal environmental, health and members attended all meetings. The Audit Committee is responsible for all the tasks safety audits. Its meetings on July 21, 2021, and December 15, 2021, focused on listed in section 107(3) sentence 2 of the German Stock Corporation Act (AktG) and internal auditing and compliance, respectively. In these meetings, the head of the the recommendations of the German Corporate Governance Code. The Audit Com- Corporate Audit department and the head of the Corporate Compliance unit reported mittee is also responsible for monitoring the internal process for identifying related to the Audit Committee and answered its questions. In all meetings, the Audit Com- party transactions and adopting resolutions to approve related party transactions. mittee also received information on the development of risks from litigation. At the meeting on February 22, 2022, the auditor reported in detail on its audits of The Nomination Committee is responsible for preparing candidate proposals for the BASF SE’s Separate and Consolidated Financial Statements for the 2021 business Supervisory Board members to be elected by the Annual Shareholders’ Meeting. The year, including the corresponding management’s reports, and discussed the results of Nomination Committee is guided by the objectives for the composition of the Super- its audit with the Audit Committee. The committee’s audit also included the Non- visory Board adopted by the Supervisory Board as well as the competence profile and financial Statements of BASF SE and the BASF Group, as well as the Compensation diversity concept for the Supervisory Board resolved at the meeting on December 21, Report of BASF SE in accordance with section 162 AktG, which had been audited by 2017. The Nomination Committee met twice in 2021. Both meetings were attended the external auditor. In preparation for the audit of the Nonfinancial Statements, the by all committee members. Items discussed at the meetings were the current compe- Audit Committee had, following a corresponding resolution by the Supervisory Board, tence profile and diversity concept for the Supervisory Board, the selection of candi- additionally engaged KPMG to perform a limited assurance and issue an assurance dates to succeed Franz Fehrenbach and Anke Schäferkordt, who had announced at report on it. KPMG also reported in detail on the focus, the procedure and the key an early stage that they would resign from the Supervisory Board on conclusion of the findings of this audit. Annual Shareholders’ Meeting 2022. In 2022, they will have been members of BASF’s Supervisory Board for 14 and 12 years, respectively, meaning that both will no longer At the meeting on July 21, 2021, the Audit Committee engaged KPMG AG Wirtschafts- be independent within the meaning of the criteria of the German Corporate Gover- prüfungsgesellschaft – the auditor elected by the Annual Shareholders’ Meeting on nance Code and the criteria for the independence of Supervisory Board members set April 29, 2021 – with the audit for the 2021 reporting year and auditing fees were by the Supervisory Board. The committee identified successor candidates in a struc- agreed upon. The focus areas and scope of the annual audit were discussed and tured process and with external support, and evaluated them according to set criteria. defined together with the auditor. The Audit Committee excluded in principle the Based on the recommendation of the Nomination Committee, the Supervisory Board engage ment of the auditor to perform any services outside of the audit of the annual resolved on December 16, 2021, to propose Alessandra Genco, Chief Financial financial statements, including beyond prevailing legal limitations. For certain nonaudit Officer of Leonardo SpA, and Prof. Dr. Stefan Asenkerschbaumer, Deputy Chairman services, the Audit Committee authorized the Board of Executive Directors to engage of the Board of Management and Chief Financial Officer of Robert Bosch GmbH until
BASF Report 2021 Corporate Governance – Report of the Supervisory Board 181 December 31, 2021, for election to the Supervisory Board at the Annual Shareholders’ Independence and efficiency review Meeting on April 29, 2022. An important aspect of good corporate governance is the independence of Super- The Strategy Committee, which was established to discuss strategic options for the visory Board members and their freedom from conflicts of interest. The Supervisory further development of the BASF Group, did not meet in 2021. Board based the assessment of the independence of its members on the recommen- dations of the German Corporate Governance Code and the additional criteria for assessing the independence of Supervisory Board members contained in the Rules of Corporate governance and Declaration of Conformity Procedure of the Supervisory Board, which were revised in the Supervisory Board meeting on December 19, 2019. The criteria used to assess independence are pres- The Supervisory Board places great value on ensuring good corporate governance: In ented in the Corporate Governance Report on page 166. According to the Super- 2021, it was therefore once again intensely occupied with the corporate governance visory Board’s assessment, on the basis of these criteria, five of the six shareholder standards practiced in the company and the implementation of the recommendations representatives and four of the six employee representatives – 9 of the 12 members and suggestions of the German Corporate Governance Code in the current version of the Supervisory Board in total – are considered to be independent as of the end dated December 16, 2019. of 2021. All three non-independent Supervisory Board members were classified as such due to the length of their membership on the Supervisory Board, which exceeds In accordance with the recommendations of the German Corporate Governance 12 years in each case. Franz Fehrenbach and Denise Schellemans, two of the mem- Code and the Guiding principles for the dialog between investors and German super- bers to be classified as non-independent, will leave the Supervisory Board on conclu- visory boards, the Chairman of the Supervisory Board again sought dialog with invest- sion of the Annual Shareholders’ Meeting on April 29, 2022; this increases the number ors where appropriate in 2021. of independent members to 11 of 12 members. Above and beyond this, however , the Supervisory Board does not see any indications that the Supervisory Board role is not Special onboarding events are held for new members of the Supervisory Board to performed completely independently. In cases where Supervisory Board members familiarize them with the basics of corporate governance at BASF, the organization hold supervisory or management positions at companies with which BASF has busi- and internal structures of the BASF Group, and the composition of its businesses. ness relations, we see no impairment of their independence. The scope of these Above and beyond this, the company also supports the members of the Supervisory businesses is marginal and furthermore takes place under conditions similar to those Board with training for their activities on the Supervisory Board, whether through of a third party. external offerings such as topic-specific seminars or internal information offerings such as site and plant visits. The Supervisory Board reviews the efficiency of its activities every year in the form of a self-assessment. To this end, the Chairman of the Supervisory Board conducted a At its meeting of December 16, 2021, the Supervisory Board approved the joint written survey of all Supervisory Board members in the fourth quarter of 2021 on the Declaration of Conformity by the Supervisory Board and the Board of Executive Direc- basis of a detailed questionnaire covering the entire range of relevant Supervisory tors in accordance with section 161 of the German Stock Corporation Act (AktG). Board topics. These included, in particular, the preparation and conduct of Super- BASF complies with all recommendations of the German Corporate Governance visory Board meetings, the content and topics of the meetings, cooperation within the Code in the version dated December 16, 2019. The Corporate Governance Report Supervisory Board, and cooperation with the Board of Executive Directors and the provides extensive information on the BASF Group’s corporate governance. auditor. The results of these dialogs, including suggestions to further improve the The full Declaration of Conformity is rendered on page 184 and is available to shareholders on the company website at Supervisory Board’s work, were presented by the Chairman of the Supervisory Board basf.com/en/corporategovernance at the Supervisory Board meeting on December 16, 2021, and thoroughly discussed by the members of the Supervisory Board. Overall, its members again rated the Supervisory Board’s activity as efficient.
BASF Report 2021 Corporate Governance – Report of the Supervisory Board 182 Independent of the efficiency review of the Supervisory Board, the Audit Committee of the Compensation Report that is to be prepared by the Board of Executive Directors also conducted a self-assessment of its activities in 2021 based on individual discus- and Supervisory Board in accordance with section 162 AktG. sions between the chair of the Audit Committee and all members of the Audit The assurance report issued by KPMG on the substantive audit of the NFS can be found at basf.com/nfs-audit-2021 Committee. Material subjects were the organization and content of meetings, meeting The assurance report issued by KPMG on the audit of the Compensation Report can be found at basf.com/compensationreport documents and reports, participants and quality of discussion at meetings, and the implementation of the recommendations of the 2020 efficiency review. The Audit The auditor’s reports were sent in a timely manner to every member of the Supervisory Committee discussed the results of the questionnaire and detailed suggestions at its Board. The auditor attended the accounts review meeting of the Audit Committee on meeting on December 15, 2021. On this basis, the members judged the Audit February 22, 2022, as well as the accounts meeting of the Supervisory Board on Committee’s work to be efficient and appropriate. February 23, 2022, and reported on the procedure and material findings of its audit, including the key audit matters described in the Auditor’s Report. The auditor also provided the Supervisory Board with detailed explanations of the reports on the day Separate and Consolidated Financial Statements; Compensation Report before the accounts meeting. KPMG AG Wirtschaftsprüfungsgesellschaft, the auditor elected by the Annual Share- The Audit Committee reviewed the Financial Statements, the Management’s Report holders’ Meeting for the 2021 reporting year, has audited the Financial Statements of and the Compensation Report at its meeting on February 22, 2022, including the BASF SE and the BASF Group Consolidated Financial Statements, which were reports prepared by the auditor and the key audit matters specified in the Auditor’s prepared in accordance with the International Financial Reporting Standards (IFRS) as Report, and discussed them in detail with the auditor. The chair of the Audit adopted by the European Union, and the additional requirements that must be applied Committee gave a detailed account of the preliminary review at the Supervisory Board in accordance with section 315e(1) of the German Commercial Code (HGB), including meeting on February 23, 2022. On this basis, the Supervisory Board examined the the Management’s Report and the accounting records from which they were pr epared, Financial Statements and Management’s Report of BASF SE for 2021, the proposal and have approved them free of qualification. Furthermore, the auditor certified that by the Board of Execu tive Directors for the appropriation of profit, and the Con soli- the Board of Executive Directors had taken the measures incumbent on it under dated Financial Statements and Management’s Report for 2021. The results of the section 91(2) of the German Stock Corporation Act (AktG) in an appropriate manner. preliminary review by the Audit Committee and the results of the Supervisory Board’s In particular, it had instituted an appropriate early risk detection system that fulfilled the own examination fully concur with those of the audit. The Supervisory Board sees no requirements of the company and is applicable for the early identification of develop- grounds for objection to the management or the reports submitted. ments that could pose a risk to the continued existence of the BASF Group. The results of the audit as well as the procedure and material findings of the audit of the At its accounts meeting on February 23, 2022, the Supervisory Board approved the financial statements are presented in the Auditor’s Report. Financial Statements of BASF SE and the Consolidated Financial Statements of the The Auditor’s Report is rendered from page 188 onward BASF Group prepared by the Board of Executive Directors, making the 2021 Financial For more information on the auditor, see the Corporate Governance Report on page 170 Statements final. The Supervisory Board concurred with the proposal of the Board of Executive Directors regarding the appropriation of profit and the payment of a dividend Beyond the statutory audit of the Financial Statements, KPMG also conducted, on of €3.40 per share. behalf of the Supervisory Board, a limited assurance of the Nonfinancial Statements (NFSs) for BASF SE and the BASF Group, which are integral parts of the respective Also at the meeting on February 23, 2022, the Supervisory Board discussed with the management’s reports. On the basis of its audit, KPMG did not raise any objections Board of Executive Directors the joint Compensation Report of the Board of Executive to reporting and the satisfaction of the relevant statutory r equirements. Above and Directors and the Supervisory Board in accordance with section 162 AktG and beyond the statutory requirements, the auditor also c onducted a limited assurance approved it. The Compensation Report is publicly available on the company’s website at basf.com/compensationreport
BASF Report 2021 Corporate Governance – Report of the Supervisory Board 183 Composition of the Supervisory Board Liming Chen, the Supervisory Board member appointed by the Ludwigshafen am Rhein local court (Amtsgericht) effective October 8, 2020, was elected to the Super- visory Board as a shareholder representative by the Annual Shareholders’ Meeting on April 29, 2021, and was thus confirmed as a member of the Supervisory Board with a term of office until the end of the current Supervisory Board period in 2024. In addition, the Supervisory Board members Anke Schäferkordt and Franz Fehr enbach announced in 2021 that they will resign from the Supervisory Board on conclusion of the Annual Shareholders’ Meeting on April 29, 2022. In light of this, the Supervisory Board selected Alessandra Genco and Prof. Dr. Stefan Asenkerschbaumer as candi- dates to succeed them on the Supervisory Board based on a selection process managed by the Nomination Committee. Details of the two candidates proposed for election will be published in the invitation to the Annual Shareholders’ Meeting and made available on the company’s website at basf.com/annualmeeting. According to the Supervisory Board’s assessment, the current and proposed future composition of the Supervisory Board meet in full the objectives with respect to its competence profile and diversity concept. Ludwigshafen, February 23, 2022 The Supervisory Board Dr. Kurt Bock Chairman of the Supervisory Board
BASF Report 2021 Corporate Governance – Declaration of Conformity Pursuant to Section 161 AktG 184 Declaration of Conformity Pursuant to Section 161 AktG Declaration of Conformity 2021 of the Board of Executive Directors and the Supervisory Board of BASF SE The Board of Executive Directors and the Supervisory Board of BASF SE hereby declare pursuant to section 161 AktG (German Stock Corporation Act) The recommendations of the Government Commission on the German Corporate Governance Code as amended on Decem- ber 16, 2019, published by the Federal Ministry of Justice on March 20, 2020, in the official section of the Federal Gazette are complied with and have been complied with since the submission of the last Declaration of Conformity of December 2020. Ludwigshafen, December 2021 The Supervisory Board The Board of Executive Directors of BASF SE of BASF SE
BASF Report 2021 Corporate Governance – Declaration of Corporate Governance 185 Declaration of Corporate Governance Declaration of Corporate Governance in accordance with section 315d HGB in connection with section 289f HGB The Declaration of Corporate Governance, pursuant to section 315d HGB in connection with section 289f HGB, comprises the subchapters Corporate Governance Report including the descrip- tion of the diversity concept for the composition of the Board of Executive Directors and the Supervisory Board (except for the dis clo sures pursuant to section 315a HGB), Compliance and Declaration of Conformity as per section 161 of the German Stock Corporation Act (AktG) in the Corporate Governance chapter. It is a component of the Management’s Report. Pursuant to section 317(2) sentence 6 HGB, the auditor checked that the disclosures according to section 315d HGB were made.
BASF Report 2021 186 Contents Consoli dated To Our Shareholders Management’s Report Corporate Governance Consolidated Financial Statements Financial Overviews 4Statements Statement by the Board of Executive Directors 187 7 Sales revenue 221 24 Risks from litigation and claims 262 Independent Auditor’s Report 188 8 Functional costs 222 25 Other financial obligations 263 Statement of Income 194 9 Other operating income and expenses 223 26 Supplementary information on financial instruments 263 10 Investments accounted for using the equity method 27 Statement of cash flows and capital Statement of Income and Expense Recognized and other financial assets 225 structure management 277 in Equity 195 11 Financial result 230 28 Personnel expenses and employees 279 Balance Sheet 196 12 Income taxes 231 29 Share price-based compensation programs and BASF Statement of Cash Flows 198 13 Noncontrolling interests 235 incentive share program 280 Statement of Changes in Equity 199 14 Intangible assets 236 30 Compensation of the Board of Executive Directors and 15 Property, plant and equipment 240 Supervisory Board 283 Notes 200 16 Leases 244 31 Related party transactions 283 1 Summary of accounting policies 200 17 Inventories 246 32 Services provided by the external auditor 285 2 Scope of consolidation 205 18 Receivables and miscellaneous assets 247 33 Declaration of Conformity with the German Corporate 3 Acquisitions and divestitures 207 19 Capital, reserves and retained earnings 249 Governance Code 285 4 BASF Group list of shares held pursuant to 20 Other comprehensive income 250 34 Non-adjusting events after the balance sheet date 285 section 313(2) of the German Commercial Code (HGB) 213 21 Liabilities 251 5 Reporting by segment and region 213 22 Provisions for pensions and similar obligations 254 6 Earnings per share 220 23 Other provisions 260
BASF Report 2021 Consoli dated Financial Statements – Statement by the Board of Executive Directors 187 Statement by the Board of Ludwigshafen am Rhein, February 23, 2022 Executive Directors and assurance pursuant to sections 297(2) and 315(1) of the German Commercial Code Dr. Martin Brudermüller (HGB) Chairman of the Board of Executive Directors The Board of Executive Directors of BASF SE is responsible for preparing the Consoli- dated Financial Statements and Management’s Report of the BASF Group. Dr. Hans-Ulrich Engel The BASF Group Consolidated Financial Statements for 2021 were prepared accord- Vice Chairman and Chief Financial Officer ing to the International Financial Reporting Standards (IFRS), which are published by the International Accounting Standards Board (IASB), London, and have been endorsed by the European Union. Saori Dubourg We have established effective internal control and steering systems in order to ensure that the BASF Group’s Management’s Report and Consolidated Financial Statements comply with applicable accounting rules and to ensure proper corporate reporting. Michael Heinz The risk management system we have set up is designed such that the Board of Executive Directors can identify material risks early on and take appropriate defensive measures as necessary. The reliability and effectiveness of the internal control and risk management system are continually audited throughout the Group by our internal Dr. Markus Kamieth audit department. To the best of our knowledge, and in accordance with the applicable reporting rules, the Consolidated Financial Statements of the BASF Group give a true and fair view Dr. Melanie Maas-Brunner of the net assets, financial position and results of operations of the Group, and the Manage ment’s Report of the BASF Group includes a fair review of the development and performance of the business as well as position of the BASF Group, together with a description of the principal opportunities and risks associated with the expected development of the BASF Group.
Independent Auditor’s Report BASF Report 2021 Consoli dated Financial Statements – Independent Auditor’s Report 188 Independent Auditor’s In our opinion, on the basis of the knowledge obtained in the audit, Basis for the Opinions 1 – the accompanying Consolidated Financial Statements comply, in We conducted our audit of the Consolidated Financial Statements Report all material respects, with the IFRSs as adopted by the EU, and and of the Group Management Report in accordance with Section the additional requirements of German commercial law pursuant 317 HGB and the EU Audit Regulation No. 537/2014 (referred to to Section 315e (1) of the German Commercial Code (HGB) and subsequently as “EU Audit Regulation”) and in compliance with To BASF SE, Ludwigshafen am Rhein full IFRS and, in compliance with these requirements, give a true German Generally Accepted Standards for Financial Statement and fair view of the assets, liabilities, and financial position of the Audits promulgated by the Institute of Public Auditors in Germany Report on the Audit of the Consolidated Financial Group as at December 31, 2021, and of its financial performance (Institut der Wirtschaftsprüfer, IDW). Our responsibilities under those Statements and of the Group Management Report for the financial year from January 1, 2021 to December 31, 2021, requirements and principles are further described in the “Auditor’s and Responsibilities for the Audit of the Consolidated Financial State- Opinions – the accompanying Group Management Report as a whole pro- ments and of the Group Management Report” section of our audi- We have audited the Consolidated Financial Statements of BASF SE vides an appropriate view of the Group’s position. In all material tor’s report. We are independent of the group entities in accordance and its subsidiaries (the Group), which comprise the balance sheet respects, this Group Management Report is consistent with the with the requirements of European law and German commercial and as at December 31, 2021, statement of income, statement of Consolidated Financial Statements, complies with German legal professional law, and we have fulfilled our other German pr ofessional income and expense recognized in equity, statement of cash flows, requirements and appropriately presents the opportunities and responsibilities in accordance with these requirements. In addition, statement of equity for the financial year from January 1, 2021 to risks of future development. Our opinion on the Group Manage- in accordance with Article 10 (2) point (f) of the EU Audit Regulation, December 31, 2021 and Notes to the Consolidated Financial ment Report does not cover the content of those parts of the we declare that we have not provided non-audit services prohibited Statements, including a summary of significant accounting policies. Group Management Report specified in the “Other Information” under Article 5 (1) of the EU Audit Regulation. We believe that the In addition, we have audited the Group Management Report of section of our auditor´s report. The Group Management Report evidence we have obtained is sufficient and appropriate to provide a BASF SE for the financial year from January 1, 2021 to Decem- contains cross-references which are not legally required and are basis for our opinions on the Consolidated Financial Statements and ber 31, 2021. identified as unaudited. Our opinion does not cover those on the Group Management Report. cross-references and the referenced information. In accordance with German legal requirements we have not audited Key Audit Matters in the Audit of the Consolidated Financial the content of those components of the Group Management Pursuant to Section 322 (3) sentence 1 HGB, we declare that our Statements Report specified in the “Other Information” section of our auditor’s audit has not led to any reservations relating to the legal compliance Key audit matters are those matters that, in our professional judg- report. of the Consolidated Financial Statements and of the Group Manage- ment, were of most significance in our audit of the Consolidated ment Report. Financial Statements for the financial year from January 1, 2021 to The Group Management Report contains cross-references which December 31, 2021. These matters were addressed in the context are not intended to use by law and are identified as unaudited. In of our audit of the Consolidated Financial Statements as a whole, accordance with the German legal requirements we have not and in forming our opinion thereon, we do not provide a separate audited the content of those cross-references and the related refer- opinion on these matters. enced information. 1 This is a translation of the German original. Solely the original text in German language is authoritative.
BASF Report 2021 Consoli dated Financial Statements – Independent Auditor’s Report 189 Recoverability of goodwill Our audit approach Finally, we assessed whether the disclosures in the Notes on the key We consulted our valuation specialists in order to assess, among assumptions are appropriate and complete. For information on the accounting principles applied, please refer to other things, the appropriateness of the key assumptions as well as Note 1.4 to the Consolidated Financial Statements on page 204. the Group’s methods of calculation. Our observations The underlying assumptions used in the calculation and the disclo- The assumptions and data underlying the calculations of the Board sures on the impairment tests performed are included in Note 14 to We examined the forecast for the expected business and earnings of Executive Directors are acceptable. The disclosures in the Notes the Consolidated Financial Statements from page 236 onward. development and the resulting cash flows in the detailed planning on the key assumptions are appropriate and complete. period, in particular with respect to whether the expected develop- Financial statement risk ment of the relevant sales markets were given appropriate consider- Intangible assets in the Consolidated Financial Statements of ation and are consistent with the current budgets adopted by the Recoverability of the shareholding in Wintershall Dea BASF SE include goodwill in the amount of €7,520 million. Good- Board of Executive Directors and the Supervisory Board. We will accounts for 8.6% of total assets and thus has a material impact compared internal growth forecasts with industry expectations and For information on the accounting principles applied and the under- on the company’s net assets. Goodwill must be tested for impairment those of significant competitors and we assessed whether assump- lying assumptions used in the calculation, please refer to Note 10.2 annually and whenever there is an indication that goodwill may be tions contained in the planning regarding the future development of to the Consolidated Financial Statements on page 227. impaired. margins and the amount of investments are appropriate. Our review of the appropriateness of the budgets adopted by the Board of Financial statement risk Goodwill impairment testing is complex and is based on a range of Execu tive Directors and the Supervisory Board also included a In the Consolidated Financial Statements of BASF SE, shares in discretionary assumptions. These include the forecasts for future comparison of planning in past business years with the results Wintershall Dea in the amount of €9,583 million are reported under cash inflows in the detailed planning period, the assumed growth actually achieved. For selected units, we examined whether non-integral shareholdings accounted for using the equity method. rate for subsequent periods and the cost of capital. These assump- reasons for not reaching planned values in the past were given The shareholding in Wintershall Dea accounts for 11% of total tions have a material impact on the recoverability of goodwill. The appropriate consideration in current planning, to the extent that this assets and thus has a material influence on the company’s net growth forecasts of the Board of Executive Directors are associated was relevant. assets. with risks and can be revised in light of volatile raw materials prices e are indicators for an impairment of an equity-accounted and an instable macroeconomic environment. We assessed the appropriateness of the assumed growth rate for If ther the period following the detailed planning period on the basis of shareholding the company determines the recoverable amount as of There is the risk for the financial statements that an impairment as of industry-specific and macroeconomic studies. We evaluated the the reporting date and compares this with the carrying amount. The the balance sheet date is not identified or that an impairment as of methodological appropriateness of the calculation and the appro- recoverable amount is the higher of fair value less costs to sell and the balance sheet date is not recognized with an appropriate priateness of the weighted cost of capital rates. To this end, we the value in use of the shareholding. The higher value in use deter- amount. In addition, there is also a risk that the disclosures in the calculated our own expected values for the assumptions and data mined for the shareholding as the recoverable amount is determined Notes on the key assumptions are not appropriate and complete. underlying the weighted cost of capital rates and compared these using the discounted cash flow method. If the carrying amount is with the assumptions and data used. higher than the recoverable amount, this results in an impairment.
BASF Report 2021 Consoli dated Financial Statements – Independent Auditor’s Report 190 The determination of the recoverable amount of the shareholding in by BASF with the published forecasts of competitors, analysts, Other Information the Wintershall Dea is complex and based on discretionary assump- inter national institutions and other market participants. Due to the tions. These include, in particular, the estimates made by BASF’s increased estimation uncertainties regarding future oil and gas price The Board of Executive Directors and the Supervisory Board are Board of Executive Directors on the long-term development of oil and developments, we evaluated the impact of alternative price sce- responsible for the other information. The other information com- gas prices, the forecast production volumes of Wintershall Dea’s oil narios on the carrying amount of the shareholding and assessed the prises the following components of the Group Management Report, and gas fields based on expected license terms and production appropriateness of the valuation. whose content was not audited: profiles, and the cost of capital. The development of future oil and – the information of the integrated non-financial statement which is gas prices is subject to increased uncertainty, particularly in view of In consultation with our valuation specialists, we furthermore identified as unaudited the timing of the implementation of international climate targets. satisfied ourselves of the methodological appropriateness of the – the corporate governance statement in the section Corporate calculation and the appropriateness of the weighted cost of capital Governance of the Group Management Report, and In addition to the impairments and reversals of impairments of rates. We compared the assumptions and data underlying the cost – the disclosures which are not normally part of the Group Manage- €161 million after tax recognized by Wintershall Dea, as a result of the of capital, in particular the risk-free rate, the market risk premium ment Report and which are identified as unaudited. impairment test performed, the company recognized impairments of and the beta factor, with our own assumptions and publicly available €420 million on fair value adjustments of assets of Wintershall Dea data. Additionally, the other Information comprises the remaining parts of that are carried forward in income from non-integral companies the BASF Report 2021. accounted for using the equity method. In order to assess the accuracy of the measurement of the interest in Wintershall Dea, we reproduced selected calculations taking into The other information does not comprise the Consolidated Financial There is the risk for the financial statements that a decline in the value account risk-based considerations. Statements, the audited parts of the Group Management Report of the shareholding as of the balance sheet date was not identified. In and our auditor’s report. addition, there is also the risk that the associated disclosures in the Finally, we assessed whether the disclosures in the Notes on the Notes are not appropriate and complete. recoverability of the shareholding in Wintershall Dea are appropriate Our opinions on the Consolidated Financial Statements and on the and complete. Group Management Report do not cover the other information, and Our audit approach consequently we do not express an opinion or any other form of From explanations provided by employees in accounting, we gained Our observations assurance conclusion thereon. an understanding of the company’s process to identify indicators for The underlying calculation method for the impairment test of the impairment and to determine the recoverable amount. In doing so, shareholding in Wintershall Dea is appropriate and consistent with In connection with our audit, our responsibility is to read the we assessed, among other things, whether the calculation of the the applicable accounting principles. other information and, in so doing, to consider whether the other recoverable amount of the shareholding in W inters hall Dea is con- information sistent with the relevant accounting principles and whether the key The company’s assumptions and data underlying the measurement – is materially inconsistent with the Consolidated Financial State- assumptions made in this calculation are appropriate. are appropriate. The associated disclosures in the notes are appro- ments, with the Group Management Report information audited priate and complete. for content or our knowledge obtained in the audit, or We discussed the projected development of production volumes – otherwise appears to be materially misstated. and oil and gas prices with the persons responsible for planning. We evaluated the production profiles used in the measurement of the If we conclude, based on the work we have conducted, that there is exploration and production business’s assets, taking into account a material misstatement of this other information, we are obligated assessments by experts contracted by Wintershall Dea. In order to to report on this fact. We do not have anything to report in this assess its suitability as a basis for calculation, we had the oil and gas regard. price scenario used by the company explained to us. To assess its appropriateness, we compared the oil and gas price scenario used
BASF Report 2021 Consoli dated Financial Statements – Independent Auditor’s Report 191 Responsibilities of the Board of Executive Directors and The Supervisory Board is responsible for overseeing the Group’s fraud may involve collusion, forgery, intentional omissions, the Supervisory Board for the Consolidated Financial financial reporting process for the preparation of the Consolidated misrepresentations, or the override of internal control. Statements and the Group Management Report Financial Statements and of the Group Management Report. – Obtain an understanding of internal control relevant to the audit of The Board of Executive Directors is responsible for the prepa ra - the Consolidated Financial Statements and of arrangements and tion of the Consolidated Financial Statements that comply, in all Auditor’s Responsibilities for the Audit of the Consolidated measures (systems) relevant to the audit of the Group Manage- material respects, with IFRSs as adopted by the EU and the Financial Statements and of the Group Management Report ment Report in order to design audit procedures that are appro- additional require ments of German commercial law pursuant to Our objectives are to obtain reasonable assurance about whether priate in the circumstances, but not for the purpose of expressing Section 315e (1) HGB and full IFRS and that the Consolidated the Consolidated Financial Statements as a whole are free from an opinion on the effectiveness of these systems. Financial Statements, in compliance with these requirements, give a material misstatement, whether due to fraud or error, and whether – Evaluate the appropriateness of accounting policies used by the true and fair view of the assets, liabilities, financial position, and the Group Management Report as a whole provides an appropriate Board of Executive Directors and the reasonableness of estimates financial performance of the Group. In addition, the Board of Execu- view of the Group’s position and, in all material respects, is consis- made by the Board of Executive Directors and related disclosures. tive Directors is responsible for such internal control as they have tent with the Consolidated Financial Statements and the knowledge – Conclude on the appropriateness of the Board of Executive determined necessary to enable the preparation of Consolidated obtained in the audit, complies with the German legal requirements Directors’ use of the going concern basis of accounting and, Financial Statements that are free from material misstatement, and appropriately presents the opportunities and risks of future based on the audit evidence obtained, whether a material whether due to fraud or error. development, as well as to issue an auditor’s report that includes our uncertainty exists related to events or conditions that may cast opinions on the Consolidated Financial Statements and on the significant doubt on the Group’s ability to continue as a going In preparing the Consolidated Financial Statements, the Board of Group Management Report. concern. If we conclude that a material uncertainty exists, we are Executive Directors is responsible for assessing the Group’s ability required to draw attention in the auditor’s report to the related to continue as a going concern. They also have the responsibility for Reasonable assurance is a high level of assurance, but is not a disclosures in the Consolidated Financial Statements and in the disclosing, as applicable, matters related to going concern. In guarantee that an audit conducted in accordance with Sec- Group Management Report or, if such disclosures are inade- addition, they are responsible for financial reporting based on the tion 317 HGB and the EU Audit Regulation and in compliance with quate, to modify our respective opinions. Our conclusions are going concern basis of accounting unless there is an intention to German Generally Accepted Standards for Financial Statement based on the audit evidence obtained up to the date of our liquidate the Group or to cease operations, or there is no realistic Audits promulgated by the Institut der Wirtschaftsprüfer (IDW) will auditor’s report. However, future events or conditions may cause alternative but to do so. always detect a material misstatement. Misstatements can arise the Group to cease to be able to continue as a going concern. from fraud or error and are considered material if, individually or in – Evaluate the overall presentation, structure and content of the Furthermore, the Board of Executive Directors is responsible for the the aggregate, they could reasonably be expected to influence Consolidated Financial Statements, including the disclosures, and preparation of the Group Management Report that, as a whole, the economic decisions of users taken on the basis of these whether the Consolidated Financial Statements present the provides an appropriate view of the Group’s position and is, in all Consolidated Financial Statements and this Group Management underlying transactions and events in a manner that the material respects, consistent with the Consolidated Financial Report. Consolidated Financial Statements give a true and fair view of the Statements complies with German legal requirements, and appro- assets, liabilities, financial position and financial performance of priately presents the opportunities and risks of future development. We exercise professional judgment and maintain professional the Group in compliance with IFRSs as adopted by the EU and In addition, the Board of Executive Directors is responsible for skepticism throughout the audit. We also: the additional requirements of German commercial law pursuant such arrangements and measures (systems) as they have consid- – Identify and assess the risks of material misstatement of the to Section 315e (1) HGB and full IFRS. ered necessary to enable the preparation of a Group Management Consolidated Financial Statements and of the Group Manage- – Obtain sufficient appropriate audit evidence regarding the financial Report that is in accordance with the applicable German legal ment Report, whether due to fraud or error, design and perform information of the entities or business activities within the Group requirements, and to be able to provide sufficient appropriate audit procedures responsive to those risks, and obtain audit to express opinions on the Consolidated Financial Statements evidence for the assertions in the Group Management Report. evidence that is sufficient and appropriate to provide a basis for and on the Group Management Report. We are responsible for our opinions. The risk of not detecting a material misstatement the direction, supervision and performance of the group audit. We resulting from fraud is higher than for one resulting from error, as remain solely responsible for our opinions.
BASF Report 2021 Consoli dated Financial Statements – Independent Auditor’s Report 192 – Evaluate the consistency of the Group Management Report with Other Legal and Regulatory Requirements We conducted our assurance work on the reproduction of the the Consolidated Financial Statements, its conformity with law, Consolidated Financial Statements and the Group Management and the view of the Group’s position it provides. Report on the Assurance in accordance with Section 317 (3a) Report contained in the above-mentioned electronic file provided in – Perform audit procedures on the prospective information HGB on the Electronic Reproduction of the Consolidated accordance with Section 317 (3a) HGB and the IDW Assurance presented by the Board of Executive Directors in the Group Financial Statements and the Group Management Report Standard: Assurance in accordance with Section 317 (3a) HGB on Management Report. On the basis of sufficient appropriate audit Prepared for Publication Purposes the Electronic Reproduction of Financial Statements and Manage- evidence we evaluate, in particular, the significant assumptions ment Reports Prepared for Publication Purposes (ED IDW AsS 410) used by the Board of Executive Directors as a basis for the pro- We have performed assurance work in accordance with Sec- (Octo ber 2021). Accordingly, our respon sibilities are further spective information, and evaluate the proper derivation of the tion 317 (3a) HGB to obtain reasonable assurance about whether described below. Our audit firm has applied the IDW Standard on prospective information from these assumptions. We do not the reproduction of the Consolidated Financial Statements and the Quality Management 1: Requirements for Quality Management in express a separate opinion on the prospective information and on Group Management Report (hereinafter the “ESEF documents”) Audit Firms (IDW QS 1). the assumptions used as a basis. There is a substantial contained in the file provided that can be downloaded by the issuer unavoidable risk that future events will differ materially from the from the electronic client portal with access protection, The company’s Board of Executive Directors is responsible for the prospective information. “basf-gruppe- 2021- 12- 31.zip” (SHA256 hash value: 9cb0551f9c637 preparation of the ESEF documents including the electronic repro- 4988409b15ddd 8d688c5ff4b423a4708d1d2768a220841d4d3a) duction of the Consolidated Financial Statements and the Group We communicate with the audit committee regarding, among other and prepared for publication purposes complies in all material Management Report in accordance with Section 328 (1) sentence 4 matters, the planned scope and timing of the audit and significant respects with the requirements of Section 328 (1) HGB for the elec- item 1 HGB and for the tagging of the Consolidated Financial State- audit findings, including any significant deficiencies in internal control tronic reporting format (“ESEF format”). In accordance with German ments in accordance with Section 328 (1) sentence 4 item 2 HGB. that we identify during our audit. legal requirements, this assurance only extends to the conversion of the information contained in the Consolidated Financial Statements In addition, the company’s Board of Executive Directors is responsi- We also provide the audit committee with a statement that we have and the Group Management Report into the ESEF format and ble for the internal controls they consider necessary to enable the complied with the relevant independence requirements, and com- therefore relates neither to the information contained in this repro- preparation of ESEF documents that are free from material intentional municate with them all relationships and other matters that may duction nor any other information contained in the above-mentioned or unintentional non-compliance with the requirements of Section reasonably be thought to bear on our independence, and where electronic file. 328 (1) HGB for the electronic reporting format. applicable, the related safeguards. In our opinion, the reproduction of the Consolidated Financial The supervisory board is responsible for overseeing the preparation From the matters communicated with those charged with gover- Statements and the Group Management Report contained in the process for the ESEF documents as part of the financial reporting nance, we determine those matters that were of most significance in above-mentioned electronic file provided and prepared for process. the audit of the Consolidated Financial Statements of the current publication purposes complies in all material respects with the period and are therefore the key audit matters. We describe these requirements of Section 328 (1) HGB for the electronic reporting Our objective is to obtain reasonable assurance about whether the matters in our auditor’s report unless law or regulation precludes format. We do not express any opinion on the information contained ESEF documents are free from material intentional or unintentional public disclosure about the matter. in this reproduction nor on any other information contained in the non-compliance with the requirements of Section 328 (1) HGB. above-mentioned file beyond this reasonable assurance opinion and our audit opinion on the accompanying Consolidated Financial Statements and the accompanying Group Management Report for the financial year from January 1, 2021 to December 31, 2021 contained in the “Report on the Audit of the Consolidated Financial Statements and the Group Management Report” above.
BASF Report 2021 Consoli dated Financial Statements – Independent Auditor’s Report 193 We exercise professional judgement and maintain professional Further Information pursuant to Article 10 of the EU Audit German Public Auditor Responsible for the Engagement skepticism throughout the assurance work. We also: Regulation – Identify and assess the risks of material intentional or unintentional We were elected as group auditor by the annual general meeting on The German Public Auditor responsible for the engagement is non-compliance with the requirements of Section 328 (1) HGB, April 29, 2021. We were engaged by the chair of the audit commit- Dr. Stephanie Dietz. design and perform assurance procedures responsive to those tee on July 21, 2021. We have been the group auditor of BASF SE risks, and obtain assurance evidence that is sufficient and appro- without interruption since the financial year 2006. priate to provide a basis for our assurance opinion. – Obtain an understanding of internal control relevant to the We declare that the opinions expressed in this auditor’s report are Frankfurt am Main, February 22, 2022 assurance of the ESEF documents in order to design assurance consistent with the additional report to the audit committee pursuant procedures that are appropriate in the circumstances, but not for to Article 11 of the EU Audit Regulation (long-form audit report). KPMG AG the purpose of expressing an assurance opinion on the effective- Wirtschaftsprüfungsgesellschaft ness of these controls. [Original German version signed by:] – Evaluate the technical validity of the ESEF documents, i.e. whether Other matters – use of the auditor’s report the electronic file containing the ESEF documents provided meets the requirements of Commission Delegated Regulation Our auditor’s report should always be read in conjunction with the (EU) 2019/815 on the technical specification for this electronic file. audited Consolidated Financial Statements and the audited Group Sailer – Evaluate whether the ESEF documents enable an XHTML repro- Management Report as well as the audited ESEF documents. The Wirtschaftsprüfer duction with content equivalent to the audited Consolidated Consolidated Financial Statements and the Group Management [German Public Auditor] Financial Statements and the audited Group Management Report. Report converted to ESEF format – including the versions to be – Evaluate whether the tagging of the ESEF documents with Inline published in the Federal Gazette (Bundesanzeiger) – are merely XBRL technology (iXBRL) in accordance with Articles 4 and 6 of electronic reproductions of the audited Consolidated Financial Commission Delegated Regulation (EU) 2019/815 in the version Statements and the audited Group Management Report and do not in force on the balance sheet date enables an appropriate replace them. In particular, the ESEF report and our assurance Dr. Dietz and complete machine-readable XBRL copy of the XHTML opinion contained therein can only be used in conjunction with the Wirtschaftsprüferin reproduction. audited ESEF documentation provided in electronic form. [German Public Auditor]
BASF Report 2021 Consoli dated Financial Statements – Statement of Income 194 Statement of Income BASF Group Statement of income Million € Explanations in Note 2021 2020 Sales revenue [7] 78,598 59,149 Cost of sales [8] −58,801 −44,040 Gross profit on sales 19,797 15,109 Selling expenses [8] −8,414 −7,497 General administrative expenses [8] −1,408 −1,228 Research and development expenses [8] −2,216 −2,086 Other operating income [9] 1,894 1,399 Other operating expenses [9] −2,650 −6,108 Income from integral companies accounted for using the equity method [10] 675 220 Income from operations [5] 7,677 −191 Income from non-integral companies accounted for using the equity method [10] 285 −925 Income from other shareholdings [10] 47 157 Expenses from other shareholdings [10] −125 −141 Net income from shareholdings 207 −909 Interest income 168 164 Interest expenses −482 −537 Interest result −314 −373 Other financial income 94 118 Other financial expenses −215 −207 Other financial result −122 −89 Financial result [11] −436 −462 Income before income taxes 7,448 −1,562 Income taxes [12] −1,430 91 Income after taxes from continuing operations 6,018 −1,471 Income after taxes from discontinued operations [3] −36 396 Income after taxes 5,982 −1,075 of which attributable to shareholders of BASF SE (net income) 5,523 −1,060 of which attributable to noncontrolling interests [13] 459 −15 Earnings per share from continuing operations (€) [6] 6.05 –1.58 Earnings per share from discontinued operations (€) [6] –0.04 0.43 Earnings per share (€) [6] 6.01 –1.15 Dilution effect (€) [6] –0.01 − Diluted earnings per share (€) [6] 6.00 –1.15
BASF Report 2021 Consoli dated Financial Statements – Statement of Income and Expense Recognized in Equity 195 Statement of Income and Expense Recognized in Equity BASF Group a Statement of comprehensive income Million € BASF Group 2021 2020 Income after taxes 5,982 –1,075 Remeasurement of defined benefit plansb 3,476 –1,376 Deferred taxes on the remeasurement of defined benefit plans –811 422 Investments accounted for using the equity method – share of nonreclassifiable gains/losses (after taxes) 44 –19 Nonreclassifiable gains/losses 2,709 –973 Unrealized gains/losses in connection with cash flow hedges 284 14 Reclassification of realized gains/losses recognized in the statement of income in connection with cash flow hedges –222 65 Unrealized gains/losses from currency translation 1,566 –1,612 Reclassification of realized gains/losses from currency translation recognized in the statement of income 52 71 Deferred taxes on reclassifiable gains/losses –29 –5 Investments accounted for using the equity method – share of reclassifiable gains/losses (after taxes) 313 –1,286 Reclassifiable gains/losses 1,964 –2,753 Other comprehensive income after taxes 4,673 –3,726 of which attributable to shareholders of BASF SE 4,583 –3,677 attributable to noncontrolling interests 90 –49 Comprehensive income 10,655 –4,801 of which attributable to shareholders of BASF SE 10,106 –4,737 attributable to noncontrolling interests 549 –64 a For more information on other comprehensive income, see Note 20 on page 250 of the Notes b For more information on the remeasurement of defined benefit plans, see Note 22 from page 254 onward
BASF Report 2021 Consoli dated Financial Statements – Balance Sheet 196 Balance Sheet BASF Group Assets Million € Explanations in Note December 31, 2021 December 31, 2020 Intangible assets [14] 13,499 13,145 Property, plant and equipment [15] 21,553 19,647 Integral investments accounted for using the equity method [10] 2,540 1,878 Non-integral investments accounted for using the equity method [10] 9,843 10,874 Other financial assets [10] 575 582 Deferred tax assets [12] 2,600 3,386 Other receivables and miscellaneous assets [18] 1,722 912 Noncurrent assets 52,332 50,424 Inventories [17] 13,868 10,010 Accounts receivable, trade [18] 11,942 9,466 Other receivables and miscellaneous assets [18] 5,568 4,673 Marketable securities 208 207 Cash and cash equivalentsa [1] 2,624 4,330 Assets of disposal groups [3] 840 1,182 Current assets 35,051 29,868 Total assets 87,383 80,292 a For a reconciliation of the amounts in the statement of cash flows with the balance sheet item cash and cash equivalents, see page 198
BASF Report 2021 Consoli dated Financial Statements – Balance Sheet 197 Equity and liabilities Million € Explanations in Note December 31, 2021 December 31, 2020 Subscribed capital [19] 1,176 1,176 Capital reserves [19] 3,106 3,115 Retained earnings [19] 40,365 37,911 Other comprehensive income [20] –3,855 –8,474 Equity attributable to shareholders of BASF SE 40,792 33,728 Noncontrolling interests [13] 1,289 670 Equity 42,081 34,398 Provisions for pensions and similar obligations [22] 6,160 8,566 Deferred tax liabilities [12] 1,499 1,447 Tax provisions 415 587 Other provisions [23] 1,782 1,484 Financial indebtedness [21] 13,764 15,819 Other liabilities [21] 1,600 1,711 Noncurrent liabilities 25,220 29,614 Accounts payable, trade [21] 7,826 5,291 Provisions [23] 3,935 2,825 Tax liabilities [12] 1,161 988 Financial indebtedness [21] 3,420 3,395 Other liabilities [21] 3,679 3,440 Liabilities of disposal groups [3] 61 341 Current liabilities 20,081 16,280 Total equity and liabilities 87,383 80,292
BASF Report 2021 Consoli dated Financial Statements – Statement of Cash Flows 198 Statement of Cash Flows BASF Group Statement of cash flowsa Million € 2021 2020 Net income 5,523 –1,060 Depreciation and amortization of property, plant and equipment and intangible assets 3,687 6,751 Changes in inventories –3,304 849 Changes in receivables –1,272 –2,176 Changes in operating liabilities and other provisions 3,010 927 Changes in pension provisions, defined benefit assets and other items 213 137 Gains (–) / losses (+) from the disposal of noncurrent assets and securities –611 –15 Cash flows from operating activities 7,245 5,413 Payments made for property, plant and equipment and intangible assets –3,532 –3,129 Payments made for financial assets and securities –994 –877 Payments made for acquisitions –600 –1,240 Payments received for divestitures 1,030 2,520 Payments received from the disposal of noncurrent assets and securities 1,474 822 Cash flows from investing activities –2,622 –1,904 Capital increases/repayments and other equity transactions − 3 Additions to financial and similar liabilities 7,627 15,135 Repayment of financial and similar liabilities –10,772 –13,555 Dividends paid To shareholders of BASF SE –3,031 –3,031 noncontrolling interests –281 –108 Cash flows from financing activities –6,457 –1,556 Cash-effective changes in cash and cash equivalents –1,834 1,953 Changes in cash and cash equivalents From foreign exchange rates 131 –81 changes in the scope of consolidation –7 8 Cash and cash equivalents at the beginning of the yearb 4,335 2,455 Cash and cash equivalents at the end of the yearb 2,624 4,335 a The statement of cash flows is explained in the Management’s Report (Financial Position) on page 65. b In 2021 and 2020, cash and cash equivalents presented in the statement of cash flows deviate from the figures in the balance sheet. For explanations and other disclosures on the statement of cash flows, see Note 27 from page 277 onward.
BASF Report 2021 Consoli dated Financial Statements – Statement of Changes in Equity 199 Statement of Changes in Equity BASF Group Statement of changes in equitya Million € Remeasure- ment of Equity defined Measurement Other com- attributable to Non- Subscribed Capital Retained benefit Currency of securities Cash flow prehensive shareholders controlling b capital reserves earnings plans translation at fair value hedges income of BASF SE interests Equity As of January 1, 2021 1,176 3,115 37,911 –6,538 –1,800 7 –143 –8,474 33,728 670 34,398 c Dividends paid – – –3,031 – – – – – –3,031 –281 –3,312 Income after taxes – – 5,523 – – – – – 5,523 459 5,982 Other comprehensive income after taxes – – – 2,709 2,205 –2 –329 4,583 4,583 90 4,673 d Changes in scope of consolidation and other changes – –10 –37 36 – – – 36 –11 351 340 As of December 31, 2021 1,176 3,106 40,365 –3,793 406 5 –472 –3,855 40,792 1,289 42,081 Statement of changes in equitya Million € Remeasure- ment of Equity defined Measurement Other com- attributable to Non- Subscribed Capital Retained benefit Currency of securities Cash flow prehensive shareholders controlling b capital reserves earnings plans translation at fair value hedges income of BASF SE interests Equity As of January 1, 2020 1,176 3,115 42,056 –5,618 798 5 –35 –4,850 41,497 853 42,350 c Dividends paid – – –3,031 – – – – – –3,031 –108 –3,139 Income after taxes – – –1,060 – – – – – –1,060 –15 –1,075 Other comprehensive income after taxes – – – –973 –2,598 2 –108 –3,677 –3,677 –49 –3,726 Changes in scope of consolidation and other changes – – –54 53 – – – 53 –1 –11 –12 As of December 31, 2020 1,176 3,115 37,911 –6,538 –1,800 7 –143 –8,474 33,728 670 34,398 a For more information on the items relating to equity, see Notes 19 and 20 from page 249 onward b Details are provided in the Statement of Income and Expense Recognized in Equity on page 195 c Including profit and loss transfers d Valuation adjustment BASF “plus” share program
BASF Report 2021 Consoli dated Financial Statements – Notes 200 Notes The Consolidated Financial Statements of BASF SE as of Decem- The individual financial statements of the consolidated companies ber 31, 2021, have been prepared in accordance with the Inter- are prepared as of the balance sheet date of the Consolidated national Financial Reporting Standards (IFRS) of the International Financial Statements. Business continuity is assumed. The company 1 Summary of accounting policies Accounting Standards Board (IASB), and section 315e (1) of the is equipping itself for the challenges posed by the economic impact German Commercial Code (HGB). IFRSs are generally only applied of the coronavirus pandemic and of climate change. The accounting after they have been endorsed by the European Union. For the 2021 policies applied are largely the same as those used in 2020. fiscal year, all of the binding IFRSs and pronouncements of the For more information, see Note 1.3 from page 202 onward and Note 10 from page 225 onward 1.1 General information International Financial Reporting Interpretations Committee (IFRIC) were applied. The Consolidated Financial Statements are for the On February 22, 2022, the Board of Executive Directors prepared BASF SE (registered at the district trade register, or Amtsgericht, for period from January 1, 2021 to December 31, 2021, and are the Consolidated Financial Statements, submitted them to the Ludwigshafen am Rhein, number HRB 6000) is a publicly listed presented in euros. They are written in German and translated into Supervisory Board for review and approval, and released them for corporation headquartered in Ludwigshafen am Rhein, Germany. Its English. All amounts, including the figures for previous years, are publication. official address is Carl-Bosch-Str. 38, 67056 Ludwigshafen am given in million euros unless otherwise indicated. Due to rounding, Rhein, Germany. individual figures in this report may not add up to the totals shown and percentages may not correspond exactly to the figures shown. 1.2 Changes in accounting principles Accounting policies applied for the first time in 2021 Accounting policies applied for the first time in 2021 The amendments shown in the table had no material effect on Name of standard/interpretation Date of endorsement by Standard/interpretation or amendments Date of publication the E.U. BASF SE’s Consolidated Financial Statements. Amendments to IFRS 4 Insurance Contracts (Extension of Temporary Exemption from June 25, 2020 December 15, 2020 Application of IFRS 9) Amendments to August 27, 2020 January 13, 2021 IFRS 9 Financial Instruments IAS 39 Financial Instruments: Recognition and Measurement IFRS 7 Financial Instruments: Disclosures IFRS 4 Insurance Contracts IFRS 16 Leases (Interest Rate Benchmark Reform – Phase 2) Amendments to IFRS 16 Leases: Covid-19-Related Rent Concessions beyond June 30, 2021 March 31, 2021 August 30, 2021
BASF Report 2021 Consoli dated Financial Statements – Notes 201 IFRSs and IFRICs not yet to be considered but already IFRSs and IFRICs not yet to be considered but already endorsed by the E.U. endorsed by the E.U. Date of endorsement Mandatory date of Standard/interpretation Name of standard/interpretation or amendments Date of publication by the E.U. initial application The effects on the BASF Group financial statements of the IFRSs Amendments to IFRS 3 Business Combinations (Amendment to References to May 14, 2020 June 28, 2021 January 1, 2022 and IFRICs not yet in force in 2021 but already endorsed by the the Conceptual Framework) European Union were reviewed. The amendments to IAS 16, Amendments to IAS 16 Property, Plant and Equipment (Proceeds before May 14, 2020 June 28, 2021 January 1, 2022 whereby specific income is to be recognized with the associated Intended Use) costs in profit or loss, as well as the amendments to IAS 37 regarding Amendments to IAS 37 Provisions, Contingent Liabilities and Contingent Assets May 14, 2020 June 28, 2021 January 1, 2022 cost calculation for onerous contracts are already being taken into (Onerous Contracts, Settlement Costs from Contracts) account. BASF currently assumes that all other amendments will Annual improvements to Amendments to May 14, 2020 June 28, 2021 January 1, 2022 have no material effect. It does not plan on early adoption. IFRS 2018–2020 IFRS 1 (Subsidiary as a First-Time Adopter) IFRS 9 (Fees in the “10% Test” Regarding Derecognition of Financial Liabilities) IFRS 16 (Lease Incentives) IAS 41 (Taxation in Fair Value Measurements) Amendments to IFRS 17 Insurance Contracts (including amendments to the June 25, 2020 November 19, 2021 January 1, 2023 standard) IFRSs and IFRICs not yet to be considered and not yet IFRSs and IFRICs not yet to be considered and not yet endorsed by the E.U. endorsed by the E.U. Expected date of initial Standard/interpretation Name of standard/interpretation or amendments Date of publication application The IASB issued further amendments to standards and Amendments to IAS 1 Presentation of Financial Statements (Classification of Liabilities as January 23, 2020 January 1, 2023 inter pretations which are still subject to E.U. endorsement and Current or Noncurrent) whose application is not yet mandatory. The amendments to IAS 12, (including Deferral of Effective Date) (July 15, 2020) which serve to clarify how companies account for deferred taxes on Amendments to IAS 1 and Presentation of Financial Statements and February 12, 2021 January 1, 2023 transactions such as leases and decommissioning obligations, are IFRS Practice Statement 2 Making Materiality Judgements (Presentation of Key Accounting Policies) already being applied in BASF’s financial statements. All other Amendments to IAS 8 Accounting Policies, Changes in Accounting Estimates and Errors February 12, 2021 January 1, 2023 (Definition of Changes in Accounting Policies and Accounting Estimates) amendments are unlikely to have a material impact on the reporting Amendments to IAS 12 Income Taxes (Deferred Tax Related to Assets and Liabilities Arising from May 7, 2021 January 1, 2023 of BASF. BASF does not plan on early adoption of these a Single Transaction) amendments. Amendments to IFRS 17 Insurance Contracts (Initial Application of IFRS 17 and IFRS 9 – December 9, 2021 January 1, 2023 Comparative Information)
BASF Report 2021 Consoli dated Financial Statements – Notes 202 1.3 Group accounting principles In addition to BASF SE, the Consolidated Financial Statements Transactions between consolidated companies as well as include all material subsidiaries on a fully consolidated and all intercompany profits resulting from trade between consolidated Scope of consolidation: The scope of consolidation is based on material joint operations on a proportionally consolidated basis. companies are eliminated in full. Sales and material other balances the application of the standards IFRS 10 and 11. Companies whose business is dormant or of low volume, and are of and transactions between joint operations and fully consolidated minor importance for the presentation of a true and fair view of the Group companies are also eliminated. Material intercompany profits According to IFRS 10, a group consists of a parent entity and the net assets, financial position and results of operations, are not related to companies accounted for using the equity method are subsidiaries controlled by the parent. “Control” of an investee consolidated, but rather are reported under other shareholdings. eliminated. assumes the simultaneous fulfillment of the following three criteria: These companies are carried at amortized cost and are written – The parent company holds decision-making power over the down in the case of an impairment. The aggregate assets and equity Capital consolidation is conducted at the acquisition date according relevant activities of the investee of these companies amount to less than 1% of the corresponding to the purchase method. Initially, all assets, liabilities and additional – The parent company has rights to variable returns from the value at Group level. intangible assets that are to be capitalized are measured at fair value investee regardless of the scope of any noncontrolling interests. Subse- – The parent company can use its decision-making power to affect Joint ventures and associated companies are accounted for using quently, the cost of acquiring the company is compared with the the variable returns the equity method in the Consolidated Financial Statements. proportional share of the fair value of the net assets acquired. The Associated companies are entities that are not subsidiaries, joint resulting positive differences are capitalized as goodwill. Negative Based on corporate governance structures and any additional ventures or joint operations, and over whose operating and financial differences are reviewed once more, then recognized directly in the agreements, companies are analyzed for their relevant activities and policies significant influence can be exercised. In general, this income statement. variable returns, and the link between the variable returns and the applies to companies in which BASF has an investment of between extent to which their relevant activities could be influenced. 20% and 50%. Associated companies and joint ventures that are Noncontrolling interests are measured at fair value at the date of fully or predominantly allocated to operating divisions are classified acquisition proportional to the assets acquired and liabilities According to IFRS 11, which regulates the accounting of joint as integral because they are integrated into the value chain of the assumed (partial goodwill method). arrangements, a distinction must be made between joint ventures respective division; are controlled by the divisions; and they generate and joint operations. In the case of a joint venture, the parties that their income in close cooperation with the other assets of the BASF The incidental acquisition costs of a business combination are have joint control of a legally independent company have rights to Group and/or of these divisions. Equity-accounted income from recognized in the income statement under other operating the net assets of that arrangement. In joint operations, the parties integral joint ventures or associated companies is reported as part of expenses. that have joint control have direct rights to the assets and obligations income from operations (EBIT). For more information, see Note 13 on page 235 for the liabilities relating to the arrangement. This requirement is particularly fulfilled if the production output of the joint arrangement Equity-accounted income from non-integral joint ventures or is almost entirely transferred to the partners, through which the associated companies is reported in net income from shareholdings. partners guarantee the joint arrangements’ ongoing financing. For more information, see Note 10 from page 225 onward Companies whose corporate governance structures classify them Consolidation methods: Assets and liabilities of consolidated as joint arrangements are analyzed to determine if they meet the companies are uniformly recognized and measured in accordance criteria for joint ventures or joint operations in accordance with with the principles described herein. For companies accounted for IFRS 11. Should the arrangement be structured through a separate using the equity method, material deviations in measurement vehicle, its legal form, contractual arrangements and all other facts resulting from the application of other accounting principles are and circumstances are reviewed. adjusted.
BASF Report 2021 Consoli dated Financial Statements – Notes 203 Foreign currency translation: The cost of assets acquired in Selected exchange rates contracts. The assets and liabilities of disposal groups are recog- foreign currencies and revenue from sales in foreign currencies are EUR 1 equals nized at the lower of the sum of their carrying amounts or fair value determined by the exchange rate on the date the transaction is Closing rates Average rates less costs to sell; this does not apply to assets that do not fall under recognized. Foreign currency receivables and liabilities are valued at Dec. 31, Dec. 31, the valuation principles of IFRS 5. Depreciation of noncurrent assets 2021 2020 2021 2020 the exchange rates on the balance sheet date. Changes in assets Brazil (BRL) 6.31 6.37 6.38 5.89 and the use of the equity method are suspended. and liabilities arising from foreign currency translation are recognized China (CNY) 7.19 8.02 7.63 7.87 in the income statement and reported under other operating income United Kingdom (GBP) 0.84 0.90 0.86 0.89 Discontinued operations: These are classified as held for sale and or expenses, other financial result, and in the case of financial assets Japan (JPY) 130.38 126.49 129.88 121.85 are presented as discontinued operations in BASF’s Consolidated measured at fair value through other comprehensive income, in Malaysia (MYR) 4.72 4.93 4.90 4.80 Financial Statements in accordance with IFRS 5. Until closing, the other comprehensive income. Mexico (MXN) 23.14 24.42 23.99 24.52 income after taxes of discontinued operations is shown in income Norway (NOK) 9.99 10.47 10.16 10.72 after taxes of the BASF Group as a separate item (income after Russia (RUB) 85.30 91.47 87.15 82.72 Translation of foreign currency financial statements: The Switzerland (CHF) 1.03 1.08 1.08 1.07 taxes from discontinued operations). In addition, the assets and translation of foreign currency financial statements depends on the South Korea (KRW) 1,346.38 1,336.00 1,354.06 1,345.58 liabilities of the discontinued operations are reclassified to a disposal functional currency of the consolidated companies. For companies United States (USD) 1.13 1.23 1.18 1.14 group (assets or liabilities of disposal groups). The statement of cash whose functional currency is not the euro, translation into the flows is not adjusted. The activities of discontinued operations are reporting currency is based on the closing rate method: Balance not allocated to any reportable segment in financial reporting. sheet items are translated into euros using closing rates on the 1.4 Accounting policies For more information, see Note 3 from page 207 onward and Note 5 from page 213 onward balance sheet date; expenses and income are translated into euros at monthly average rates and accumulated for the year. The The accounting policies for the individual items in the Balance Sheet difference between a company’s translated equity at historical rates and the Statement of Income are presented in the respective at the time of acquisition or retention and its equity at closing rates sections of the Notes. on the balance sheet date is reported under other comprehensive income (translation adjustments) and is recognized in the income Business combinations: In business combinations, the acquired statement only upon the company’s disposal. assets and liabilities are recognized at fair value on the date the acquirer effectively obtains control. The fair value of acquired assets For certain companies outside the eurozone or U.S. dollar zone, the and assumed liabilities at the date of acquisition, as well as the euro or U.S. dollar is the functional currency. In such cases, financial useful lives of the acquired assets, are largely based on projected statements prepared in the local currency are translated into the cash flows. Actual cash flows can deviate significantly from those. functional currency using the temporal method: All nonmonetary Independent external appraisals are typically used for the purchase assets and related depreciation and amortization as well as equity price allocation of material business combinations. Valuations in the are translated at the exchange rate applying to the respective trans- course of business combinations are based on existing information actions. All other balance sheet items are translated using closing as of the acquisition date. rates on the balance sheet date; other expenses and income are translated at monthly average rates. The resulting translation differ- Groups of assets and liabilities held for sale (disposal groups): ences are recognized in the income statement under other operating These comprise those assets and directly associated liabilities income or expenses. If necessary, financial statements in the func- shown separately on the balance sheet whose sale in the context of tional currency are translated into the presentation currency accord- a single transaction is highly probable. A transaction is assumed to ing to the closing rate method. be highly probable if there are no significant risks of completion of the transaction, which usually requires the conclusion of binding
BASF Report 2021 Consoli dated Financial Statements – Notes 204 Use of estimates and assumptions in preparing the testing. It comprises a risk-free interest rate, the market risk premium Climate policies are also causing fundamental changes in the Consolidated Financial Statements and an industry-specific spread for the credit risk. Additional automotive industry, one of BASF’s key customer industries. The important assumptions are the forecasts for the detailed planning transition to electromobility will have a long-term negative impact The carrying amount of assets, liabilities and provisions, contingent period and the terminal growth rates used. Fair value less costs to on the emissions catalyst business. This development was liabilities and other financial obligations reported in the Consolidated sell must be determined for the impairment test of disposal groups; accounted for in the adjustment of the growth rate for the goodwill Financial Statements depends on the use of estimates, assumptions specific assumptions relating to the respective transaction must be impairment test and did not lead to an impairment. Other BASF and discretionary scope. Specific estimates or assumptions used in made for this determination. businesses will benefit from this transformation; for example, individual accounting or valuation methods are disclosed in their For more information, see Note 3 from page 207 onward and Note 14 from page 236 onward demand for innovative lightweight materials and battery materials respective sections of the Notes to the Consolidated Financial will grow. Furthermore, climate policies can influence the business Statements. They are based on the circumstances and estimates on An impairment is recognized if the recoverable amount of the asset of oil and gas producers such as Wintershall Dea, which BASF the balance sheet date and thus affect the amounts of income and is lower than the carrying amount. The impaired asset (excluding accounts for using the equity method. Nevertheless, given the large expenses shown for the reporting periods presented. These goodwill) is written down by the amount of the difference between share of gas in Wintershall Dea’s production and reserves as well as assumptions primarily relate to the determination of discounted these amounts. the acceptance of gas as a bridge technology, it can be assumed cash flows in the context of impairment tests and purchase price that these assets are fundamentally recoverable. The price allocations; the useful lives of depreciable property, plant and The goodwill impairment test is based on cash-generating units. At assumptions applied for the impairment test reflected current equipment and intangible assets; the carrying amount of BASF, these largely correspond to the business units, or in individual developments regarding climate neutrality as well as a possible oil shareholdings; and the measurement of provisions for items such as cases the divisions. If there is a need for impairment, the existing and gas shortage due to lack of investment in this industry. employee benefits, warranties, trade discounts, environmental goodwill is, if necessary, completely written off as a first step. If there For more information on climate and sustainability, see Wintershall Dea’s annual report at protection and taxes. Although uncertainty is appropriately is further need for impairment, this is allocated to the remaining wintershalldea.com/en/investor-relations incorporated in the valuation factors, actual results can differ from assets of the cash-generating unit. Goodwill impairments are these estimates. reported under other operating expenses. Impairment tests on assets are carried out whenever certain Climate and sustainability-related developments: The chemical triggering events indicate potential impairment. External triggering industry is resource-intensive. BASF is committed to the Paris events include, for example, changes in customer industries, Climate Agreement: Using resources as efficiently and responsibly technologies used and economic downturns. Internal triggering as possible and the concept of a circular economy are firmly events for an impairment test include lower product profitability, embedded in BASF’s strategy and its actions, supported by the planned restructuring measures or physical damage to assets. Verbund structure, clearly defined ambitious targets for reducing Impairment tests entail a comparison of the carrying amount and the CO, and the use of renewable and recycled feedstocks. BASF 2 recoverable amount. The recoverable amount is the higher of fair always strives to employ raw materials more efficiently and improve value less costs to sell and the value in use. As a rule, value in use is production processes as well as to continuously seek ways to use determined using the discounted cash flow method. The estimation non-fossil, renewable or recycled feedstocks. For this reason, of cash flows and the assumptions used consider all information current developments and measures relating to climate change and available on the respective balance sheet date on the future sustainability do not lead to fundamentally changed expectations development of the operating business. Actual future developments with regard to useful lives or recoverability of the majority of may vary. Impairment testing relies upon the cash-generating unit’s noncurrent assets. There is also no material need for adjustments to long-term earnings forecasts, which are based on macroeconomic provisions for environmental and restoration obligations. In individual trends. The weighted average cost of capital (WACC) based on the cases, however, plants may be shut down if necessary for reasons capital asset pricing model plays an important role in impairment of environmental protection.
BASF Report 2021 Consoli dated Financial Statements – Notes 205 2 Scope of consolidation First-time consolidations in 2020 comprised: Three of the nine first-time consolidations in 2021 were companies – Four acquired companies with headquarters in Europe (one of added as part of the formation of BASF Shanshan Battery As of December 31, 2021, a total of 267 companies were included, those in Germany), one in North America, one in South America, Materials Co., Ltd. Five companies were added to the scope of either proportionally or fully, in the scope of consolidation of the Africa, Middle East, and three in Asia Pacific consolidation as acquired or newly formed companies as part of the Consolidated Financial Statements (December 31, 2020: 282). Of – One newly established company with headquarters in Europe, purchase of 49.5% of the Hollandse Kust Zuid offshore wind park these, nine companies were first-time consolidations (2020: 43). two newly established companies in Asia Pacific, and one newly from Vattenfall. Since the beginning of 2021, a total of 24 companies (2020: 63) established company with headquarters in South America, Africa, were deconsolidated due to divestiture, merger, liquidation or Middle East Eleven companies were deconsolidated as a result of the divestiture immateriality. – Eleven companies that had not been consolidated at the time of of the global pigments business in 2021. Additionally, seven initial inclusion in the Consolidated Financial Statements in companies merged with BASF companies due to the integration of First-time consolidations in 2021 comprised: Europe, six in North America, 11 in Asia Pacific and two in South the polyamide business (PA 6.6) which had been acquired in 2020. – Four acquired companies with headquarters in Europe and three America, Africa, Middle East in Asia Pacific – Two newly established companies with headquarters in Europe (one of those in Germany) Scope of consolidation Number of companies South America, Of which Africa, Europe Germany North America Asia Pacific Middle East 2021 2020 As of January 1 143 45 39 76 24 282 302 of which proportionally consolidated 7 – – 2 – 9 7 First-time consolidations 6 1 – 3 – 9 43 of which proportionally consolidated – – – – – – 2 Deconsolidations 9 3 4 8 3 24 63 of which proportionally consolidated – – – – – – – As of December 31 140 43 35 71 21 267 282 of which proportionally consolidated 7 – – 2 – 9 9
BASF Report 2021 Consoli dated Financial Statements – Notes 206 Overview of impact of changes to the scope of consolidation (excluding acquisitions and divestitures) 2021 2020 Million € %a Million € %a Sales –1 0.0 –3 0.0 Noncurrent assets 21 0.0 12 0.0 of which property, plant and equipment –1 0.0 39 0.2 Current assets –28 0.0 –23 0.1 of which cash and cash equivalents –8 0.3 7 0.2 Assets –7 0.0 –11 0.0 Equity 1 0.0 –5 0.0 Noncurrent liabilities 0 0.0 1 0.0 of which financial indebtedness – – – – Current liabilities –8 0.0 –7 0.0 of which financial indebtedness – – 1 0.0 Total equity and liabilities –7 0.0 –11 0.0 Other financial obligations – – – – a Proportional share in relation to the BASF Group The proportionally consolidated joint operations include, in In addition to the fully and proportionally consolidated companies, particular: 27 joint ventures and/or associated companies (2020: 25) were – Ellba C.V., Rotterdam, Netherlands, which is jointly operated with consolidated using the equity method. Shell for the production of propylene oxide and styrene monomer – BASF DOW HPPO Production BVBA, Antwerp, Belgium, which is A list of the companies included in the Consolidated Financial jointly operated with Dow for the production of propylene oxide Statements and of all companies in which BASF SE has a – Butachimie SNC, Chalampé, France, which is jointly operated shareholding as required by section 313(2) of the German with Invista for the production of adiponitrile (ADN) and Commercial Code (HGB) is provided in the list of shares held. hexamethylenediamine (HMD) For more information, see Note 4 on page 213 – Alsachimie S.A.S., Chalampé, France, which is jointly operated For more information, see basf.com/en/corporategovernance with Domo Chemicals for the production of adipic acid
BASF Report 2021 Consoli dated Financial Statements – Notes 207 3 Acquisitions and divestitures suitable for forecasting future developments or events. The Preliminary purchase price allocation for the acquisition of assets and goodwill is not tax deductible. liabilities of the BASF Shanshan companies Acquisitions Million € Fair value as of The following table shows the fair values for the assets and liabilities date of In 2021, BASF acquired the following activity: of the BASF Shanshan companies, which were used on a pr eliminary acquisition – Since August 31, 2021, BASF and Shanshan, a lithium-ion battery basis until a complete independent valuation is carried out. The Goodwill 254 materials provider in China, have held shares in BASF Shanshan purchase price allocation considers all the facts and circumstances Other intangible assets 139 Battery Materials Co., Ltd. The company is majority-owned by prevailing as of the date of acquisition that were known prior to the Property, plant and equipment 332 BASF (BASF 51%; Shanshan 49%). It already occupies a very preparation of these financial statements. If further facts and Integral investments accounted for using the equity method – strong position in the value chain for battery materials including circumstances become known within the 12-month valuation period Non-integral investments accounted for using the equity method – Other financial assets 8 raw materials, precursors for cathode active materials, cathode pursuant to IFRS 3, the purchase price allocation will be recalculated Deferred tax assets 11 active materials and battery recycling. It focuses primarily on the accordingly. Other receivables and miscellaneous assets – electric vehicle market as well as the consumer electronics and Noncurrent assets 744 energy storage segments. Through this investment, BASF is The gross amounts of contractual trade accounts receivable were Inventories 207 further strengthening its position in Asia to create an integrated €290 million, of which €52 million is expected to be uncollectible. Accounts receivable, trade 238 global supply chain for battery materials for customers in China The gross amounts of Other receivables were €160 million. Other receivables and miscellaneous assets 160 and worldwide. The investment strengthens the Catalysts division. Marketable securities – The transaction includes four companies and approximately Cash and cash equivalents 52 1,600 employees. One of the companies is classified as an Current assets 657 investment accounted for using the equity method, but for Total assets 1,401 reasons of materiality, was consolidated in BASF’s financial statements at amortized cost. The purchase price was €616 mil- Provisions for pensions and similar obligations – lion and was cash-effective in full. A separate transaction valued Deferred tax liabilities 32 at €36 million was connected to the purchase in accordance with Tax provisions 2 IFRS 3.51 and was reported under other receivables. It contains a Other provisions 18 compensation component which is coupled with employees Financial indebtedness 5 remaining at BASF Shanshan Battery Materials Co., Ltd. It affects Other liabilities 8 a period of one to two years and will be disbursed in two tranches. Noncurrent liabilities 65 Goodwill of €254 million resulted in particular from sales and cost Accounts payable, trade 262 synergies. The businesses acquired accounted for €354 million in Provisions 2 sales revenue and –€36 million in income from operations in the Tax liabilities 1 2021 fiscal year. Including the businesses and assets of the BASF Financial indebtedness 91 Shanshan companies in BASF’s Consolidated Financial State- Other liabilities 15 ments since January 1, 2021, would have resulted in a sales Current liabilities 371 revenue contribution of €821 million and income from operations Total liabilities 436 of €13 million. These pro forma data are for comparison purposes. Noncontrolling interests 348 They are not necessarily values that would have resulted had the Total purchase price 616 transaction taken place as of January 1, 2021, and are not
BASF Report 2021 Consoli dated Financial Statements – Notes 208 – Furthermore, BASF completed the purchase of 49.5% of The following overview shows the effects of acquisitions in 2021 and Vattenfall’s Hollandse Kust Zuid wind farm on September 1, 2021. 2020 on the Consolidated Financial Statements. When acquisitions The transaction is not being reported as an acquisition because resulted in the transfer of assets or the assumption of additional the acquired assets do not constitute a business in accordance liabilities, the effects were shown as net amounts. with IFRS 3.2b, so it is not within the IFRS 3 scope of application. The transaction is therefore not included in the table to the right. In 2020, BASF acquired the following activity: Effects of acquisitions – BASF closed the acquisition of Solvay’s polyamide business (PA 6.6) on January 31, 2020. Domo Chemicals, Leuna, Germany, 2021 2020 was approved by the E.U. Commission as the buyer of the Million € %a Million € %a European polyamide business, which could not be acquired by Goodwill 254 3.4 21 0.3 BASF under the conditions imposed by the authorities. The trans- Other intangible assets 139 2.3 670 10.8 action broadened BASF’s polyamide capabilities with innovative products. It also enhanced the company’s access to growth Property, plant and equipment 332 1.5 559 2.8 markets in Asia as well as in North and South America. Through Financial assets 8 0.1 – – backward integration into the key raw material adiponi trile (ADN), Other noncurrent assets 11 0.3 108 2.5 BASF was integrated along the entire polyamide 6.6 value chain Noncurrent assets 744 1.4 1,358 2.7 and was able to improve supply reliability. The purchase price of Current assets 692 2.0 548 1.8 the business acquired by BASF was €1,319 million on a cash and of which cash and cash equivalents 52 2.0 68 1.6 debt-free basis. Of that amount, €1,308 million was already cash effective in 2020. The remaining purchase price should be paid in Assets 1,436 1.6 1,906 2.4 2022. The business was integrated into the Performance Materials and Monomers divisions. The transaction between Solvay and Equity 348 0.8 − − BASF included eight production sites in Germany, France, China, of which noncontrolling interests 348 27.0 – – India, South Korea, Brazil and Mexico, as well as research and Noncurrent liabilities 65 0.3 264 0.9 development and technical consultation centers in Asia and the Americas. It also included two share holdings in France, which are of which financial indebtedness 5 – – – accounted for as joint operations: The 50% interest in Current liabilities 371 1.8 334 2.1 Butachimie SNC, Chalampé, France, to pr oduce ADN and of which financial indebtedness 91 2.7 8 0.0 hexamethylenediamine, and the 51% interest in the newly Total equity and liabilities 436 0.5 598 0.7 established Alsachimie S.A.S., Chalampé, France, to produce Payments made for acquisitions 652 1,308 adipic acid. With the acquisition, around 700 Solvay employees Additions of cash and cash equivalents –52 – –68 – were transferred to BASF. Furthermore, some 1,000 employees of the Alsachimie S.A.S. and Butachimie SNC joint operations are to Payments made for acquisitions according to statement of 600 1,240 cash flows be included on a pro rata basis by BASF. Goodwill of €20 million resulted in particular from sales synergies. The majority of total a Proportional share in relation to the BASF Group goodwill was not tax deductible.
BASF Report 2021 Consoli dated Financial Statements – Notes 209 Divestitures Calculation of disposal loss on the global pigments business – On November 30, 2021, BASF completed the sale of the pr ecision Million € microchemicals business to Entegris, Billerica, Massachusetts. In 2021, BASF sold the following activities: June 30, 2021 The transaction included fixed assets and inventories; the – On May 31, 2021, BASF completed the sale of its production site Purchase price on a cash and debt-free basis 1,150 purchase price was €78 million. The precision microchemicals a in Kankakee, Illinois, to a subsidiary of One Rock Capital Purchase price adjustments –140 business was part of the Surface Treatment business unit of Partners, LLC. The transaction also included the vegetable- oil- Purchase price 1,010 BASF’s Coatings division, operating under the Chemetall brand. based sterols and natural vitamin E business as well as the Disposed net assets –938 anionic surfactants and esters produced at the Kankakee site. Assets of the disposal group –1,281 In 2020, BASF sold the following activity: The purchase price was €177 million. The transaction affected the – On September 30, 2020, and on November 30, 2020, BASF Nutrition & Health and Care Chemicals divisions. Reinstated receivables 30 closed the divestiture of its construction chemicals business to an – Following the fulfillment of clearance conditions, BASF closed the Liabilities of the disposal group 338 affiliate of Lone Star, Dallas, Texas, a global private equity firm. divestiture of its global pigments business to DIC, Tokyo, Japan, Reinstated liabilities –25 The purchase price on a cash and debt-free basis was €3.17 bil- on June 30, 2021. The business’ assets and liabilities have been Other –89 lion. The sale covered approximately 7,500 employees as well as reported as a disposal group since the business transfer Disposal loss before taxes –17 production sites and sales offices in more than 60 countries of the agreement was signed in August 2019. The purchase price on a Tax expense –63 former Construction Chemicals division. From the signing of the cash and debt-free basis was €1.15 billion. The transaction agreement on December 21, 2019, until the closing of the affected approximately 2,500 employees in the Dispersions & Disposal loss after taxes –80 transaction, BASF’s construction chemicals business was Pigments division. The division was renamed Dispersions & a Purchase price adjustments take into account, among other things, cash, financial indebtedness and pension reported as a discontinued operation. Purchase price adjustments Resins following the transaction closing. The disposal group of obligations. were reported in income from discontinued operations in the the pigments business was derecognized when BASF’s global amount of €36 million after taxes in 2021. pigments business was sold to DIC, Tokyo, Japan, on – On November 9, 2021, BASF and Clayton, Dubilier & Rice sold June 30, 2021. The calculation of the disposal loss on the global their shares in Solenis to Platinum Equity, Beverly Hills, California. pigments business is presented in the following table: With over 5,200 employees, Solenis serves customers in water-intensive industries by helping them solve complex water treatment and process improvement challenges. BASF held a 49% share in Solenis after having transferred its wet-end paper and water chemicals business to the company in February 2019. This was accounted for using the equity method. The remaining 51% of the shares were held by funds managed by Clayton, Dubilier & Rice, and by Solenis management. The purchase price allocated to BASF was €1.1 billion. The investment was classified as non-integral. Its earnings and the gain on the disposal in the amount of €589 million were reported under net income from shareholdings.
BASF Report 2021 Consoli dated Financial Statements – Notes 210 The following overview shows the effects of the divestitures in 2021 Effects of divestitures and 2020 on the Consolidated Financial Statements. The sales line 2021 2020 item showed the year-on-year decline resulting from divestitures. The impact on equity related mainly to gains and losses from Million € %a Million € %a divestitures. Sales –495 –0.8 –91 –0.2 Noncurrent assets –31 –0.1 − − of which property, plant and equipment –50 –0.2 – – Current assets –1,730 –4.9 –3,035 –10.2 b of which cash and cash equivalents –33 – –89 – Assets –1,761 –2.0 –3,035 –3.8 Equity 794 1.9 607 1.8 Noncurrent liabilities 8 − − − of which financial indebtedness – – – – Current liabilities –338 –1.7 –883 –5.4 of which financial indebtedness – – – – Total equity and liabilities 464 0.5 –276 –0.3 Payments received from divestitures 2,225 2,759 c Further effects in connection with divestitures –1,195 – –239 – Payments received from divestitures according to statement of 1,030 2,520 cash flows a Proportional share in relation to the BASF Group b Includes €33 million from the divested disposal group of the pigments business in 2021, and €89 million from the discontinued construction chemicals business in 2020. c Includes project-related tax payments and derecognition of cash and cash equivalents. The divestiture of the investment accounted for using the equity method to Solenis in 2021, is not shown under divestitures in the statement of cash flows, but as a disposal of financial assets.
BASF Report 2021 Consoli dated Financial Statements – Notes 211 Agreed transactions and groups of assets and liabilities held – On December 28, 2021, BASF reached an agreement with for sale (disposal groups) Clariant Corporation, Louisville, Kentucky, to sell its production site in Quincy, Florida, and the associated attapulgite business in – On November 18, 2021, BASF and KaMin LLC./CADAM S.A. the Dispersion & Resins division. The Quincy site employs around (KaMin) signed an agreement to sell BASF’s kaolin minerals 75 employees and manufactures clay-based mineral products business to KaMin, a global performance minerals company used in a variety of industrial applications. The purchase price headquartered in Macon, Georgia. Currently, the kaolin minerals amounts to $60 million. The transaction is expected to close in business is part of BASF’s Performance Chemicals division. the summer of 2022, subject to the approval of the relevant Pending approval by the relevant antitrust authorities, the antitrust authorities. transaction is expected to close in the second half of 2022. The kaolin minerals business has approximately 440 employees in North America, Europe and Asia. The divestiture comprises the production hub with sites in Daveyville, Toddville, Edgar, Gordon and related mines, reserves and mills in Toomsboro and Sandersville, Georgia. The refinery catalysts operations located at the same site are not part of the divestiture. With the agreement on the sale of the kaolin minerals business to KaMin, the affected assets and liabilities were reclassified to a disposal group, and an impairment test was performed as of December 31, 2021. In accordance with IFRS 5, the fair value less expected disposal costs was used as the recoverable amount and compared with the carrying amount. This resulted in the need for impairment in the amount of €9 million as of December 31, 2021, which was allocated to the goodwill of the disposal group for the kaolin minerals business. – On December 6, 2021, BASF and Allianz Capital Partners, acting as party to the contract on behalf of Allianz Insurance Companies (Allianz), agreed to the purchase by Allianz of 25.2% of the investment in the Hollandse Kust Zuid (HKZ) offshore wind farm. This follows a transaction between Vattenfall and BASF under which BASF acquired 49.5% of HKZ from Vattenfall on Septem- ber 1, 2021. The transaction is expected to close in the first quarter of 2022, subject to the approval of the relevant antitrust authorities. The assets and liabilities were reclassified to a disposal group upon agreement to the investment by Allianz.
BASF Report 2021 Consoli dated Financial Statements – Notes 212 Other comprehensive income as of December 31, 2021, included Disposal groups €52 million, which resulted from the change in the fair value of Million € physical power purchase agreements (PPAs) and is fully attributable Kaolin minerals business Wind farm investment December 31, 2021 December 31, 2021 to the wind farm investment disposal group. Balance Sheet Goodwill –5 – The values of the disposal groups are presented in the following Other intangible assets – – table. Property, plant and equipment –153 – Integral investments accounted for using the equity method – –565 Non-integral investments accounted for using the equity method – – Other financial assets – – Deferred tax assets – – Other receivables and miscellaneous assets – –71 Noncurrent assets –158 –636 Inventories –44 – Accounts receivable, trade – – Other receivables and miscellaneous assets – –2 Marketable securities – – Cash and cash equivalents – – Current assets –44 –2 Assets of the disposal group 202 638 Provisions for pensions and similar obligations – – Deferred tax liabilities –20 –17 Tax provisions – – Other provisions –17 – Financial indebtedness – – Other liabilities – – Noncurrent liabilities –37 –17 Accounts payable, trade – – Provisions – – Tax liabilities – – Financial indebtedness – – Other liabilities –2 –4 Current liabilities –2 –4 Liabilities of the disposal group 39 21 Net assets 163 617
BASF Report 2021 Consoli dated Financial Statements – Notes 213 4 BASF Group list of shares held pursuant to 5 Reporting by segment and region and customer proximity, particularly products that con tribute to the section 313(2) of the German Commercial Code circular economy as well as sustainable production methods help (HGB) The BASF Group’s business is operated by 11 divisions, grouped differentiate BASF from its competitors. into six segments: The list of consolidated companies and the complete list of all – Chemicals: Petrochemicals, Intermediates The Industrial Solutions segment consists of the Dispersions & companies in which BASF SE holds shares as required by – Materials: Performance Materials, Monomers Resins and the Performance Chemicals divisions. The segment section 313(2) HGB as well as information on the exemption of – Industrial Solutions: Dispersions & Resins, Performance develops and markets ingredients and additives for industrial subsidiaries from accounting and disclosure obligations are an Chemicals applications, such as polymer dispersions, resins, electronic integral component of the audited Consolidated Financial – Surface Technologies: Catalysts, Coatings materials, antioxidants and additives. Its customers come from key Statements submitted to the electronic Federal Gazette (Bundes- – Nutrition & Care: Care Chemicals, Nutrition & Health industries such as automotive, plastics and electronics as well as anzeiger). The list of shares held is also published online. – Agricultural Solutions: Agricultural Solutions energy and resources. The pigments business was part of the For more information, see basf.com/en/corporategovernance Dispersions & Pigments division until June 30, 2021. The division The divisions are allocated to the segments based on their business was renamed Dispersions & Resins as of July 1, 2021, following the models and according to their focal points, customer groups, the divestiture of the global pigments business. focus of their innovations, their investment relevance and sustainability aspects. The Surface Technologies segment bundles chemical solutions for surfaces in the Catalysts and Coatings divisions. Its portfolio range The Chemicals segment comprises the Petrochemicals and serves the automotive and chemical industries and includes Intermediates divisions and is the cornerstone of BASF’s Verbund catalysts, battery materials, automotive OEM and refinish coatings, structure. It supplies the other segments with basic chemicals and surface treatment, and precious and base metal services. intermediates, contributing to the organic growth of the key value Innovations and solutions customized in collaboration with our chains. In addition to internal transfers, the segment mainly serves customers in the field of sustainable mobility are a key growth driver customers in downstream industries, especially in the chemical and for this segment. plastics industries. The segment’s competitiveness is strengthened by technological leadership and operational excellence, process The Nutrition & Care segment comprises the Care Chemicals and product innovations as well as the development of sustainable division and the Nutrition & Health division. This segment produces technologies. ingredients and solutions for consumer applications in the areas of nutrition, home and personal care. Its customers include food and The Materials segment is composed of the Performance Materials feed producers as well as the pharmaceutical, cosmetics, and the and the Monomers divisions. The segment offers advanced materials detergent and cleaner industries. The segment’s competitiveness is and their precursors for new applications and systems. Its product strengthened, among other things, by focusing on new business portfolio includes isocyanates and polyamides as well as inorganic models and sustainability trends in the consumer goods markets, basic products and specialties for plastics and plastics processing. for instance expanding the portfolio with bio-based and bio- In addition to specific technological knowledge, industry expertise degradable products.
BASF Report 2021 Consoli dated Financial Statements – Notes 214 The Agricultural Solutions segment consists of the division of the Income from operations (EBIT) of Other The same accounting rules are used for segment reporting as those same name. As an integrated provider, its portfolio comprises Million € used for the Group, which are presented in these Notes. Transfers fungicides, herbicides, insecticides and biological crop protection 2021 2020 between the segments are generally executed at adjusted products, as well as seeds and seed treatment products. Costs for cross-divisional corporate research –355 –364 market-based prices, taking into account the higher cost efficiency Furthermore, Agricultural Solutions offers farmers innovative and Costs of corporate headquarters –255 –214 and lower risk of intragroup transactions. Assets, as well as their sustainable solutions, including those based on digital technologies, Other businesses 180 169 depreciation and amortization, are allocated to the segments based combined with practical advice. Foreign currency results, hedging and other measurement on economic control. Assets used by more than one segment are effects –62 –59 allocated based on the percentage of usage. Activities that are not allocated to any of the divisions are recorded Miscellaneous income and expenses –149 –735 under Other. These include other businesses which comprise Income from operations of Other –641 –1,203 Income from operations (EBIT) before special items is used for the commodity trading, engineering and other services, as well as rental internal steering of the segments and complements the key income and leases. Discontinued operations and certain activities management indicator, return on capital employed (ROCE). It is remaining after divestitures are also reported here. determined based on EBIT, which is calculated from gross profit on Income from operations of Other improved by €562 million year sales, selling expenses, general administrative expenses, research The following activities are also presented under Other: on year, from –€1,203 million to –€641 million. This resulted mainly and development expenses, other operating income and expenses, – The steering of the BASF Group by corporate headquarters. from miscellaneous income and expenses, which included and income from integral companies accounted for using the equity – Cross-divisional corporate research, which includes plant special income from the partial release of provisions for the method. To calculate EBIT before special items, this figure is then biotechnology research, works on long-term topics of strategic restructuring of the Global Business Services unit. In the previous adjusted for special items. Special items arise from the integration of importance to the BASF Group. Furthermore, it focuses on the year, special charges had been recognized. The costs of corporate acquired businesses, restructuring costs, impairments and reversals development of specific key technologies, which are of central headquarters rose by €41 million year on year to €255 million. of impairments, gains or losses on divestitures and sales of integral importance for the divisions. Income from other businesses increased by €11 million to investments accounted for using the equity method, as well as other – Results from currency translation that are not allocated to the €180 million. The costs for cross-divisional corporate r esearch expenses and income that arise outside of ordinary business segments; earnings from the hedging of raw materials prices and decreased by €9 million to €355 million. activities. EBIT and EBIT before special items are alternative foreign currency exchange risks; and gains and losses from the performance measures that are not defined under IFRS and are to long-term incentive programs (LTI programs). be considered as being complementary to the indicators defined – Remanent fixed costs resulting from organizational changes or by IFRS. restructuring; function and region-related restructuring costs not allocated to a division; idle capacity costs from internal human resource platforms; and consolidation effects that cannot be allocated to the divisions.
BASF Report 2021 Consoli dated Financial Statements – Notes 215 Reconciliation of the assets of Other to the assets of the BASF Group Million € December 31, 2021 December 31, 2020 Segment assets 64,262 56,161 Assets of businesses included in Other 3,202 2,251 Other financial assets and non-integral investments accounted for using the equity method 10,418 11,456 Deferred tax assets 2,600 3,386 Cash and cash equivalents / marketable securities 2,832 4,537 Defined benefit assets 661 126 Other receivables / prepaid expenses 3,407 2,375 Assets of Other 23,121 24,131 Assets of the BASF Group 87,383 80,292 Reconciliation of segment income to income before income taxes Million € 2021 2020 EBIT before special items of the segments 8,411 4,329 EBIT before special items of Other –643 –769 EBIT before special items 7,768 3,560 Special items of the segments –93 –3,317 Special items of Other 3 –434 Special items –91 –3,751 EBIT of the segments 8,317 1,012 EBIT of Other –641 –1,203 EBIT 7,677 –191 Net income from shareholdings 207 –909 Financial result –436 –462 Income before income taxes 7,448 –1,562
BASF Report 2021 Consoli dated Financial Statements – Notes 216 Segments 2021 Million € Industrial Surface Nutrition & Agricultural Chemicals Materials Solutions Technologies Care Solutions Other BASF Group Sales 13,579 15,214 8,876 22,659 6,442 8,162 3,666 78,598 Intersegment transfers 4,269 1,250 420 171 491 40 120 6,761 Sales including transfers 17,848 16,464 9,296 22,831 6,933 8,202 3,786 85,358 Income from integral companies accounted for using the equity method 409 20 9 94 6 − 136 675 Income from operations (EBIT) 2,997 2,345 965 761 554 696 −641 7,677 Assets 10,369 11,286 6,302 13,769 7,231 15,305 23,121 87,383 of which goodwill 199 189 631 2,373 874 3,187 66 7,520 other intangible assets 55 632 172 1,104 379 3,596 41 5,980 property, plant and equipment 4,734 4,732 2,025 3,817 2,716 2,570 959 21,553 integral investments accounted for using the equity method 1,199 212 21 484 42 − 582 2,540 Liabilities 3,820 4,372 2,621 3,678 3,146 4,091 23,573 45,301 Research and development expenses 97 193 175 296 172 904 378 2,216 Additions to property, plant and equipment and intangible assets (including acquisitions) 1,157 709 361 1,469 654 347 183 4,881 Depreciation and amortization of property, plant and equipment and intangible assets 767 817 380 483 413 662 157 3,678 of which impairments and reversals of impairmentsa 31 33 43 9 6 8 14 144 a Impairments and reversals of impairments included reversals of impairments of €12 million in Industrial Solutions in 2021.
BASF Report 2021 Consoli dated Financial Statements – Notes 217 Segments 2020 Million € Industrial Surface Nutrition & Agricultural Chemicals Materials Solutions Technologies Care Solutions Other BASF Group Sales 8,071 10,736 7,644 16,659 6,019 7,660 2,360 59,149 Intersegment transfers 2,861 720 375 203 429 91 73 4,752 Sales including transfers 10,932 11,456 8,019 16,862 6,448 7,751 2,433 63,901 Income from integral companies accounted for using the equity method 46 16 17 55 4 − 82 220 Income from operations (EBIT) –192 –109 630 –587 688 582 –1,203 –191 Assets 7,896 9,118 6,402 11,691 6,214 14,840 24,131 80,292 of which goodwill 186 179 628 2,019 844 3,039 64 6,959 other intangible assets 53 698 197 1,018 453 3,716 51 6,186 property, plant and equipment 4,362 4,498 2,040 2,973 2,353 2,528 893 19,647 integral investments accounted for using the equity method 710 208 48 414 34 − 464 1,878 Liabilities 3,435 3,893 2,734 2,905 2,948 3,556 26,423 45,894 Research and development expenses 96 182 177 246 160 840 385 2,086 Additions to property, plant and equipment and intangible assets (including acquisitions) 871 1,957 331 585 510 459 156 4,869 Depreciation and amortization of property, plant and equipment and intangible assets 1,429 1,665 469 1,487 464 1,000 171 6,685 of which impairments and reversals of impairmentsa 592 800 106 1,013 53 296 20 2,880 a In 2020, impairments and reversals of impairments only included impairments.
BASF Report 2021 Consoli dated Financial Statements – Notes 218 Regions 2021 Million € South America, Of which Africa, Europe Germany North America Asia Pacific Middle East BASF Group Location of customer Sales 30,531 7,300 20,867 21,234 5,965 78,598 Share % 38.8 9.3 26.5 27.0 7.6 100.0 Location of company Sales 31,594 12,722 21,935 20,632 4,437 78,598 Assets 46,012 30,837 19,324 18,020 4,026 87,383 of which intangible assets 6,674 3,675 5,348 1,187 292 13,499 property, plant and equipment 10,209 6,394 5,415 5,336 592 21,553 integral investments accounted for using the equity method 479 400 118 1,943 – 2,540 Additions to property, plant and equipment and intangible assets (including acquisitions) 2,484 1,512 845 1,468 83 4,881 Depreciation and amortization of property, plant and equipment and intangible assets including impairments and reversals of 1,764 1,138 1,146 663 105 3,678 impairments In the United States, sales to third parties in 2021 amounted to In China, sales to third parties in 2021 amounted to €11,380 million €19,583 million (2020: €14,352 million) according to location of (2020: €7,839 million) according to location of companies and companies and €18,277 million (2020: €13,414 million) according to €11,408 million (2020: €7,877 million) according to location of location of customers. On December 31, 2021, intangible assets, customers. On December 31, 2021, intangible assets, property, property, plant and equipment, and investments accounted for plant and equipment, and investments accounted for using the using the equity method amounted to €10,466 million (2020: equity method amounted to €5,613 million (2020: €3,799 million) €9,967 million) in the United States. in China.
BASF Report 2021 Consoli dated Financial Statements – Notes 219 Regions 2020 Million € South America, Of which Africa, Europe Germany North America Asia Pacific Middle East BASF Group Location of customer Sales 23,129 5,510 15,709 15,406 4,905 59,149 Share % 39.1 9.3 26.6 26.0 8.3 100.0 Location of company Sales 24,223 10,296 16,440 14,895 3,591 59,149 Assets 45,551 32,270 17,628 13,725 3,388 80,292 of which intangible assets 6,700 3,588 5,126 1,013 306 13,145 property, plant and equipment 9,550 6,192 5,275 4,220 602 19,647 integral investments accounted for using the equity method 423 391 105 1,350 – 1,878 Additions to property, plant and equipment and intangible assets (including acquisitions) 3,019 932 1,044 690 116 4,869 Depreciation and amortization of property, plant and equipment and intangible assets including impairments and reversals of 3,306 2,305 2,124 1,133 122 6,685 impairments
BASF Report 2021 Consoli dated Financial Statements – Notes 220 6 Earnings per share Earnings per share 2021 2020 Income after taxes from continuing operations million € 6,018 –1,471 of which noncontrolling interests million € 459 –17 Net income from continuing operations million € 5,559 –1,454 Income after taxes from discontinued operations million € –36 396 of which noncontrolling interests million € – 2 Net income from discontinued operations million € –36 394 Income after taxes million € 5,982 –1,075 of which noncontrolling interests million € 459 –15 Net income million € 5,523 –1,060 Weighted average number of outstanding shares 1,000 918,479 918,479 Dilution effect from BASF’s “plus” incentive share program 1,000 2,008 1,759 Weighted average number of shares for diluted earnings per share 1,000 920,486 920,238 Earnings per share € From continuing operations € 6.05 –1.58 Diluted € 6.04 –1.58 From discontinued operations € –0.04 0.43 Diluted € –0.04 0.43 From continuing and discontinued operations € 6.01 –1.15 Diluted € 6.00 –1.15 In accordance with IAS 33, earnings per share are determined by part of BASF’s “plus” share program. This applies regardless of the dividing earnings attributable to shareholders of BASF SE by the fact that the necessary shares are acquired on the market by third weighted average of outstanding shares. Pursuant to IAS 33, a parties on behalf of BASF and that there are no plans to issue new potential dilutive effect must be considered in the diluted earnings shares. A dilutive effect from the issue of “plus” shares arose in the per share for those BASF shares that will be granted in the future as amount of €0.01 in 2021 (2020: no dilutive effect).
BASF Report 2021 Consoli dated Financial Statements – Notes 221 7 Sales revenue Sales revenue from the sale of precious metals to industrial BASF also applies the practical expedient in IFRS 15.121 of not customers is recognized on delivery and the corresponding reporting information on remaining performance obligations result- Sales revenue from contracts with customers is recognized in the purchase prices are recorded as cost of sales. In the trading of ing from a contract with a maximum expected original term of one amount of the consideration BASF expects to receive in exchange precious metals and their derivatives with traders, where there is year. Furthermore, information on performance obligations is not for the goods or services when the customer obtains control of the usually no physical delivery, revenues are netted against the reported if the resulting revenue is recognized in accordance with goods or services. Control is considered to be transferred when the corresponding costs. IFRS 15.B16. customer can direct the use of the goods or services and can obtain all substantial remaining benefits from them. If a consideration that is contractually agreed upon by a customer includes variable components, BASF estimates the amount of the BASF primarily generates income from the sale of goods. Because consideration. Variable components are recognized as revenue only the customer obtains control of the goods at a specific point in time, to the extent that it is highly probable that previously recognized the corresponding sales revenue is recognized based on a given sales revenue will not have to be cancelled as soon as there is no point in time. Determination of this point in time occurs in the context longer uncertainty about the actual amount of the consideration. of an overall assessment of the circumstances which considers the Primarily rebates and other discounts are recognized as a reduction existence of a present claim to payment, the legal title to the goods, in revenue in accordance with the principle of individual measure- actual physical possession of the goods, the transfer of risks and ment. BASF grants customers rebates if the goods purchased by rewards as well as customer acceptance. The transfer of risks and the customer exceed a contractually defined threshold within the rewards takes into account the underlying terms of delivery period specified. Rebates are usually deducted from amounts (especially Incoterms) and is of particular practical significance. payable by the customer. Taking into account the specific terms of According to these principles, sales revenue from the sale of goods the underlying contract, BASF uses the expected value method or is generally recognized upon delivery. If products are delivered to a the most likely amount to estimate a variable consideration amount. consignment warehouse, BASF normally retains control of the The method is selected based primarily on number of possible goods. Accordingly, sales revenue is not recognized until the results such as the number of volume thresholds with rebates. All customer collects the goods from the consignment warehouse. available information, particularly historical values, is used for making Long-term supply agreements usually contain variable prices, estimates. dependent on the development of raw materials prices and variable volumes. In some contracts, BASF grants the customer the right to return goods within a specific period of time, even if they meet the agreed Services rendered to customers by BASF are invoiced according to specifications (sale with right of return). The actual expected amount work completed and recognized as revenue accordingly. of the consideration BASF is entitled to receive in this case is estimated using the expected value method. Refund liabilities are BASF generates a portion of its sales revenue from license recognized in the amount of considerations paid by the customer for agreements. Sales revenue from license agreements is recognized goods that are expected to be returned. based on a point in time or a period of time depending on whether the licensee is being granted a right to use (revenue recognized at a BASF opts to apply the practical expedient in IFRS 15.63 to not point in time) or a right to access (revenue recognized over time) the adjust the amount of the agreed consideration for the effects of a intellectual property of BASF. Sales revenue from sales and material financing component if, at the beginning of a contract, no usage-based royalties is recognized in accordance with the more than one year is expected to lapse between the transfer of underlying settlement agreements. control of the goods or services and payment by the customer.
BASF Report 2021 Consoli dated Financial Statements – Notes 222 Sales by division and by indication and sector 8 Functional costs Million € 2021 2020 Under the cost of sales method, functional costs incurred by the Petrochemicals 9,674 5,426 operating functions are determined on the basis of cost center Intermediates 3,904 2,645 accounting. The functional costs particularly contain the personnel Chemicals 13,579 8,071 costs, depreciation and amortization accumulated on the underlying Performance Materials 7,292 5,635 final cost centers as well as allocated costs within the cost Monomers 7,922 5,101 accounting cycle. Operating expenses that cannot be allocated to the functional costs are reported as other operating expenses. Materials 15,214 10,736 For more information on other operating expenses, see Note 9 from page 223 onward Dispersions & Resins 5,681 4,869 Performance Chemicals 3,195 2,775 Cost of sales Industrial Solutions 8,876 7,644 Catalysts 19,219 13,570 Cost of sales includes all production and purchase costs of the Coatings 3,440 3,089 company’s own products as well as merchandise that has been sold in the period, particularly plant, energy and personnel costs. Surface Technologies 22,659 16,659 Care Chemicals 4,439 3,989 Selling expenses Nutrition & Health 2,003 2,030 Nutrition & Care 6,442 6,019 Selling expenses primarily include marketing and advertising costs, Fungicides 2,449 2,267 freight costs, packaging costs, distribution management costs, commissions and licensing costs. Herbicides 2,526 2,464 Insecticides 926 825 General administrative expenses Seed Treatment 620 609 Seeds & Traits 1,641 1,495 General administrative expenses include the costs of the Corporate Agricultural Solutions 8,162 7,660 Center, of general management, the Board of Executive Directors Other 3,666 2,360 and the Supervisory Board. They also include the costs of managing operating divisions and business units as well as the costs of the BASF Group 78,598 59,149 supporting services in departments such as accounting, legal, taxes and controlling. Sales revenue of €59 million, that was included in contract liabilities Sales revenue for the 2021 fiscal year includes €234 million from as of January 1, 2021, was recognized in 2021. performance obligations fulfilled in prior periods in connection with sales and usage-dependent licenses.
BASF Report 2021 Consoli dated Financial Statements – Notes 223 Research and development expenses 9 Other operating income and expenses a Research and development expenses include the costs resulting Other operating income from research projects as well as the necessary license fees for Million € research activities. 2021 2020 For more information on research and development expenses by segment, see Note 5 from page 213 Income from the adjustment and release of provisions recognized in other operating expenses 241 54 onward Revenue from miscellaneous other activities 180 244 Income from hedging transactions and LTI programs 30 11 Income from foreign currency transactions and the translation of financial statements in foreign currencies 49 47 Gains on divestitures and the disposal of noncurrent assets 175 62 Reversals of impairment losses on noncurrent assets 13 – Income from the reversal of valuation allowances for business-related receivables 32 22 Gains/losses from precious metal trading 388 304 Other 784 655 Other operating income 1,894 1,399 a Income from foreign currency transactions was reported with income from the translation of financial statements in foreign currencies for the first time; it had previously been combined with income from hedging transactions and LTI programs. Furthermore, gains/expenses from precious metal trading, which had previously been recognized under Other, were reported separately. The prior-year figures have been restated accordingly. Income from the adjustment and release of provisions Income from hedging transactions and LTI programs resulted recognized in other operating expenses in 2021 resulted primarily exclusively from currency derivatives and other hedging trans- from the release of provisions in connection with the restructuring of actions. No income from the release of provisions for the long-term the Global Business Services unit. In both years, income also incentive (LTI) program was recognized in 2021 or 2020. resulted from risks from lawsuits and damage claims, closures and restructuring measures, employee obligations, and various other Income from foreign currency transactions and the translation individual items as part of the normal course of business. Provisions of financial statements in foreign currencies related to the were reversed or adjusted if, based on the circumstances on the translation of receivables and liabilities in foreign currencies and balance sheet date, utilization was no longer expected, or expected included income from the translation of companies’ financial to a lesser extent. statements whose local currency is different from the functional currency. As in the previous year, revenue from miscellaneous other activities primarily included income from rentals, catering Gains on divestitures and the disposal of noncurrent assets in operations, cultural events and logistics services. In 2020, €24 mil- 2021 resulted from the sale of a production site in Kankakee, Illinois, lion in revenue from finance leases was also recognized. the sale of the share in the condensate splitter in Port Arthur, Texas, and the sale of the precision microchemicals business. In 2020, this item included primarily income from the sale of fixed assets in the amount of €44 million.
BASF Report 2021 Consoli dated Financial Statements – Notes 224 Reversals of impairment losses on noncurrent assets arose in Other operating expensesa 2021 in connection with the planned divestiture of the production Million € site in Quincy, Florida, and the associated attapulgite business. 2021 2020 Restructuring and integration measures 461 809 Income from the reversal of valuation allowances for business- Environmental protection and safety measures, costs of demolition and removal, and project costs not subject to mandatory 523 356 related receivables resulted both from the reversal of impairments capitalization for settled customer receivables for which impairments had been Depreciation, amortization and impairments of noncurrent assets and of the disposal groups 135 2,968 recorded previously as well as from adjusted expectations r egarding Costs from miscellaneous revenue-generating activities 150 213 default on individual customer receivables. Expenses from hedging transactions and LTI programs 62 48 Losses from foreign currency transactions and the translation of financial statements in foreign currencies 163 165 Other income included refunds in the amount of €211 million in Losses from divestitures and the disposal of noncurrent assets 46 51 2021 and €151 million in 2020. This was due in both years to government grants in multiple countries, regional business Expenses from the addition of valuation allowances on business-related receivables 107 69 development subsidies in China, and transaction tax refunds in Expenses for derecognition of obsolete inventory 290 343 Brazil. Additional income resulted in 2021 from compensation for Other 714 1,086 environmental impact in the amount of €165 million and from special Other operating expenses 2,650 6,108 income from the sale of non-capitalized know-how in the amount of a Losses from foreign currency transactions were reported with losses from the translation of financial statements in foreign currencies for the first time; they had previously been combined with expenses from hedging transactions €50 million. In 2020, income was recognized in connection with the and LTI programs. The prior-year figures have been restated accordingly. premature termination of a long-term supply agreement in North America in the amount of €103 million and from insurance refunds. In 2021 and 2020, expenses from restructuring and integration Environmental protection and safety measures, costs of measures were largely attributable to global restructuring activities demolition and removal, and project costs not subject to to improve competitiveness in various operating divisions and site mandatory capitalization were expensed if requirements for closures in Europe and North America (2021: €401 million, 2020: mandatory capitalization pursuant to IFRS were not met. Expenses €435 million). In 2020, this item additionally contained expenses for demolition, removal and project planning totaled €257 million in associated with the restructuring of the Global Business Services 2021 and €218 million in 2020. In both years, these mainly related unit and site closures in Asia Pacific. to the Ludwigshafen site in Germany. Furthermore, expenses of €266 million in 2021 and €138 million in 2020 arose from the addition Expenses from integration measures in the amount of €21 million in to environmental provisions. In both years, these concerned several 2021 related to the integration of the global polyamide business, discontinued sites in North America and, in 2020, additionally a site which had been acquired from Solvay in 2020. In 2020, these in Germany. expenses were €90 million. Furthermore, expenses of €7 million arose in 2021 from the integration of the battery materials business which was acquired in 2021 in China. For more information, see Note 3 from page 207 onward
BASF Report 2021 Consoli dated Financial Statements – Notes 225 Depreciation, amortization and impairments of noncurrent As in the previous year, losses from divestitures and the disposal 10 Investments accounted for using the equity assets and of the disposal groups were €135 million in 2021 and of noncurrent assets were mainly in connection with the divestiture method and other financial assets included impairments in the amount of €116 million resulting of the global pigments business. primarily from the closure of a plant in North America, impairments Joint ventures and associated companies are accounted for using of plants in Asia, and impairments of construction in progress due to The rise in expenses from the addition of valuation allowances the equity method. The carrying amounts of shareholdings are discontinued investment projects. In 2020, this item amounted to on business-related receivables resulted mainly from a trans- adjusted annually based on the pro rata share of net income, €2,968 million, primarily due to impairments of €2,368 million, which action tax in Brazil. dividends and other changes in equity. Should there be indications resulted from the economic impact of the coronavirus pandemic of a reduction in the value of an investment, an impairment test is and affected all segments. In 2020, there were also impairments in In both years, other expenses included expenses for litigation, for conducted and, if necessary, an impairment is recognized in the the amount of €377 million because of restructuring in North REACH, for the provision of services, for warranties and for activities income statement. Furthermore, earnings and the carrying amount America, Europe and Asia Pacific. related to the BASF 4.0 project and for planning the new Verbund are adjusted when accounting policies deviate or as a result of For more information, see Note 14 from page 236 onward and Note 15 from page 240 onward site in Guangdong, China. Other expenses arose in connection with purchase price allocations, which primarily affects Wintershall the coronavirus pandemic in both years, but especially due to Dea AG, Kassel/Hamburg, Germany. Costs from other miscellaneous revenue-generating activities BASF’s “Helping Hands” aid campaign in 2020. relate to the items presented in other operating income. Exploration and development expenses in the oil and gas business, for which the equity method is applied, are accounted for using the Expenses from hedging transactions and LTI programs related successful efforts method. Under this method, costs of successful to expenses from LTI programs in the amount of €37 million in 2021 exploratory drilling as well as successful and dry development wells and €35 million in 2020. Further expenses resulted from changes in are capitalized. the fair value of currency derivatives and other hedging transactions. Income from integral companies accounted for using the equity method is presented in EBIT, and income from non-integral companies accounted for using the equity method is presented together with income from other financial assets in net income from shareholdings. Similarly, integral and non-integral shareholdings accounted for using the equity method are also shown separately in the balance sheet. The material equity-accounted shareholding that is classified as integral is BASF-YPC Company Ltd., Nanjing, China, in which BASF and Sinopec each hold 50%, and which operates the Verbund site in Nanjing, China. The material non-integral sharehold- ing is the Wintershall Dea AG oil and gas company, which operated as a GmbH until July 2021, and in which BASF holds a 72.7% share of equity (voting right share 67%). Wintershall Dea was operated jointly as a joint venture by partners BASF and LetterOne until October 2021. Through the instatement of independent members to the main body responsible for decisions about relevant activities, BASF has exercised significant influence since November 1, 2021. Accordingly, Wintershall Dea has been classified as an associated company since that date.
BASF Report 2021 Consoli dated Financial Statements – Notes 226 Stahl Lux 2 S.A., Luxembourg (BASF interest: 16.32%), Reconciliation of the carrying amounts of integral shareholdings accounted for using the equity method Quantafuel ASA, Oslo, Norway (BASF interest: 10.59%), and CIMO Million € Compagnie industrielle de Monthey S.A., Monthey, Switzerland Joint ventures Associated companies (BASF interest: 15%), are classified as associated companies as 2021 2020 2021 2020 BASF is represented in the relevant boards and can thus exercise Carrying amounts according to the equity method as of the beginning of the year 1,297 1,309 581 576 significant influence over the companies. Proportional income after taxes and other adjustments to income and expenses 601 188 74 32 Proportional changes in other comprehensive income 109 –35 18 –12 10.1 Integral companies accounted for using the equity Total comprehensive income 710 153 92 20 method Changes in the scope of consolidation – – – – Additions 12 – 614 – Disposals – –6 –13 –8 Income from integral companies accounted for using the equity method Transfers –180 –159 –573 –7 Million € 2021 2020 Carrying amounts according to the equity method as of the end of the year 1,839 1,297 701 581 Proportional income after taxes 669 234 of which joint ventures 593 193 associated companies 76 41 Proportional income after taxes and other adjustments to Disposals in 2021 related to decreases in capital of the associated Other adjustments to income and expenses 6 –14 income and expenses for the joint ventures increased mainly company, Yara Freeport LLC, Wilmington, Delaware. of which joint ventures 8 –5 because of the improved earnings contribution of BASF-YPC Company Ltd. In 2021, transfers regarding joint ventures included dividend associated companies –2 –9 payments and regarding associated companies they included Income from integral companies accounted for using 675 220 Proportional changes of other comprehensive income included dividend payments as well as the reclassification of the shareholding the equity method income and expense recognized directly in equity and related in the Hollandse Kust Zuid wind farm in the amount of €565 million primarily to currency effects. to the disposal group. Income from integral companies accounted for using the equity method increased by €455 million in 2021. Of the increase, Additions for associated companies in 2021 related primarily to the €343 million related to the shareholding in BASF-YPC purchase of 49.5% of Vattenfall’s Hollandse Kust Zuid offshore wind Com pany Ltd., primarily due to higher prices and volumes. In farm. The total investment has been reported as a disposal group addition, the previous year had also been burdened by scheduled since December 2021 due to the agreement to sell shares in the turnarounds of production plants. wind farm to Allianz Capital Partners.
BASF Report 2021 Consoli dated Financial Statements – Notes 227 Additional information on the BASF-YPC Company Ltd. material integral investment accounted for using the equity method Reconciliation of the carrying amount of the shareholding in BASF-YPC Company Ltd. Million € 2021 2020 Financial information on BASF-YPC Company Ltd., Nanjing, China (100%) BASF interest 50% 50% Million € December 31, 2021 December 31, 2020 Carrying amount as of the beginning of the year 710 771 Balance Sheet Proportional income after taxes and other adjustments to 409 66 income and expenses Noncurrent assets 960 931 Proportional changes in other comprehensive income 103 –17 Current assets 1,702 820 Dividends received 74 110 of which marketable securities, cash and cash equivalents 747 229 Carrying amount as of the end of the year 1,148 710 Assets 2,662 1,751 Equity 2,296 1,419 10.2 Non-integral companies accounted for using the Noncurrent liabilities 3 3 equity method of which financial indebtedness – – Current liabilities 363 329 Income from non-integral companies accounted for using the equity of which financial indebtedness – 54 method Million € Total equity and liabilities 2,662 1,751 2021 2020 Proportional income after taxes 435 –643 Statement of income 2021 2020 of which joint ventures – –610 Sales revenue 3,615 1,995 associated companies 435 –33 Amortization/impairment and reversals of impairments 179 202 Other adjustments to income and expenses –739 –282 Interest income 7 3 of which joint ventures – –280 Interest expenses 1 2 associated companies –739 –2 Income taxes 273 44 Income from the divestiture of shares in Solenis 589 – Income after taxes and other adjustments to income and expenses 818 132 Income from non-integral companies accounted for using the equity method 285 –925 Changes in other comprehensive income 205 –34 Income from non-integral companies accounted for using the equity method increased by €1,210 million in 2021 due primarily to income from the divestiture of the shares in Solenis as well as to the improvement in the earnings contribution of Wintershall Dea. The improvement in Wintershall Dea’s earnings in the amount of €545 million was largely the result of higher oil and gas prices as well as lower impairments of assets. In addition to impairments and
BASF Report 2021 Consoli dated Financial Statements – Notes 228 reversals of impairments recorded for Wintershall Dea (€161 million Reconciliation of the carrying amounts of non-integral investments accounted for using the equity method after tax reported in BASF’s net income from shareholdings), Million € proportional impairments arose in the amount of €680 million before Joint ventures Associated companies taxes on the amortized fair value adjustments from 2019, which 2021 2020 2021 2020 reduced the carrying amount by €420 million. Of that amount, Carrying amounts according to the equity method as of the beginning of the year 10,199 12,401 675 722 €408 million was attributable to Argentina, and was caused by the Proportional income after taxes and other adjustments to income and expenses – –890 –304 –35 planned disposal of operated unconventional oil activities, the Proportional changes in other comprehensive income – –1,255 216 –2 increase in the corporate tax rate, an increased country risk, the Total comprehensive income − –2,145 –88 –37 implementation of a regulated gas price scheme by the Argentine government until 2028, as well as updated price assumptions. Changes in the scope of consolidation – – –18 – Furthermore, the latter led to minor impairments in Norway and Additions – – – – Libya. In the previous year, impairments amounting to €791 million Disposals – – – –10 after taxes resulted from lower oil and gas price forecasts as well as Transfers –10,199 –57 9,274 – from changed reserve estimates. The shareholding as a whole is Carrying amounts according to the equity method as of the end of the year − 10,199 9,843 675 recoverable. Values in use were determined for the impairment test as of December 31, 2021. The underlying assumptions for production Only the shareholding in Wintershall Dea was included in joint Disposals in 2020 included a capital decrease in Solenis UK and cost trends as well as the price assumptions for 2023 to 2040 ventures in 2020. For 2021, proportional income after taxes and International Ltd. in the amount of €10 million. correspond with Wintershall Dea’s. For 2022, BASF anticipates an other adjustments to income and expenses as well as the oil price of $75 per bbl of Brent crude and a gas price (TTF) of proportional changes in other comprehensive income for Transfers in 2021 contained primarily the reclassification of $17.2 per mmBtu. After a decline in oil prices to approximately Wintershall Dea are reported in full under associated companies. Wintershall Dea from joint ventures to associated companies. In $71 per bbl in 2023, and in gas prices to around $8 per mmBtu in Until November 1, 2021, when Wintershall Dea became an addition, transfers regarding associated companies related to 2023 and 2024, a subsequent increase is assumed at a nominal associated company, proportional income after taxes and other dividend payments by Wintershall Dea GmbH as well as to the rate of 2% p.a. for both oil and gas. The expected cash flows were adjustments to income and expenses amounted to €258 million; reclassification of Solenis shares to the disposal group. discounted using country-specific cost of capital rates, which reflect proportional changes in other comprehensive income amounted to the relevant country risks and tax rates. The cost of capital rates in –€757 million until that date. euros, calculated using the capital asset pricing model, were between 3.4% and 14.3% (2021: between 3.4% and 14.4%). A The proportional changes of other comprehensive income in decrease of 10% in oil and gas price assumptions for the entire 2021 predominantly included changes in the fair value of derivatives planning period would result in the need for an impairment of about used to hedge gas prices and currency effects of Wintershall Dea. €613 million of the shareholding in Wintershall Dea as a whole. An increase in capital cost rates of one percentage point would lead to Changes in the scope of consolidation included the shareholding additional proportional impairments of appr oximately €200 million in Solenis UK International Ltd, London, United Kingdom. The before tax which would burden net income fr om shareholdings by former Solenis group holding company will be reported under other €70 million and reduce the carrying amount accordingly. financial assets until its complete liquidation. For more information on Wintershall Dea, see the chapter on Non-Integral Oil and Gas Business in the Management’s Report from page 93 onward
BASF Report 2021 Consoli dated Financial Statements – Notes 229 Additional information on the Wintershall Dea material non-integral investment accounted for using the equity method The following table contains financial information on the W intershall Dea material non-integral shareholding accounted for using the equity Reconciliation of the carrying amount of the shareholding in method, including adjustments for fair value made at initial recognition and the resulting effects on earnings. Wintershall Dea Million € 2021 2020 BASF interest in equity attributable to shareholders of 72.7% 72.7% Financial information on Wintershall Dea, Kassel/Hamburg, Germany (100%) Wintershall Dea AG Million € Carrying amount as of the beginning of the year 10,199 12,402 December 31, 2021 December 31, 2020 Proportional income after taxes and other adjustments to –344 –890 Balance Sheet income and expenses Noncurrent assets 27,216 27,881 Proportional changes in other comprehensive income 216 –1,256 of which goodwill from fair value adjustments 2,740 2,740 Dividends received 488 57 Current assets 4,666 2,459 Carrying amount as of the end of the year 9,583 10,199 of which marketable securities, cash and cash equivalents 2,106 821 Assets 31,882 30,340 Equity attributable to shareholders of Wintershall Dea AG 13,182 14,029 Subordinate bonds issued by Wintershall Dea 1,525 – Equity 14,707 14,029 Noncurrent liabilities 12,039 14,343 of which financial indebtedness 4,055 5,886 Current liabilities 5,136 1,968 of which financial indebtedness 575 471 Total equity and liabilities 31,882 30,340 Statement of income 2021 2020 Sales revenue 7,804 3,642 Amortization/impairment and reversals of impairments –2,765 –3,080 Interest income 135 122 Interest expenses –39 –39 Income taxes –1,498 –424 Income after taxes and other adjustments to income and expenses –473 –1,224 Changes in other comprehensive income 296 –1,728
BASF Report 2021 Consoli dated Financial Statements – Notes 230 10.3 Other shareholdings and financial assets 11 Financial result Financial result Net income from other shareholdings Million € Million € 2021 2020 2021 2020 Interest income from cash and cash equivalents 158 146 Dividends and similar income 32 18 Interest and dividend income from securities and loans 10 18 Income from the disposal of / write-up of 14 136 Interest income 168 164 shareholdings Income from profit transfer agreements / tax Interest expenses –482 –537 allocation to shareholdings 1 3 Interest result –314 –373 Income from other shareholdings 47 157 Expenses from loss transfer agreements –72 –63 Reversals of write-downs on / income from securities and loans 16 22 Write-downs on / losses from the sale of –53 –78 Net interest income from other long-term personnel obligations 2 – shareholdings Income from the capitalization of borrowing costs 29 30 Expenses from other shareholdings –125 –141 Interest income on income taxes 42 35 Net income from other shareholdings –78 16 Miscellaneous financial income 6 31 Net income from other shareholdings in 2021 decreased year on Other financial income 94 118 year by €94 million due primarily to lower income from the Write-downs on / losses from securities and loans –5 –56 measurement of shareholdings at fair value. Net interest expense from underfunded pension plans and similar obligations –82 –108 Net interest expense from other long-term personnel obligations – –2 Carrying amounts of other financial assets Unwinding the discount on other noncurrent liabilities –9 –11 Million € Dec. 31, 2021 Dec. 31, 2020 Interest expenses on income taxes –24 –20 Other shareholdings 514 533 Miscellaneous financial expenses –96 –10 Long-term securities 61 49 Other financial expenses –215 –207 Other financial assets 575 582 Other financial result –122 –89 Financial result –436 –462
BASF Report 2021 Consoli dated Financial Statements – Notes 231 Interest expenses decreased primarily because of the lower 12 Income taxes Changes in deferred taxes in the balance sheet are recorded as balance of financial indebtedness. deferred tax expense or income unless the underlying transaction is Accounting policies recognized directly in equity or in income and expenses recognized Write-downs on / losses from securities and loans declined in equity. For those effects which have been recognized in equity, mainly due to lower impairments on loans to nonconsolidated Group In Germany, a uniform corporate income tax rate of 15.0% as well changes to deferred tax assets and tax liabilities are also recognized companies. as a solidarity surcharge of 5.5% thereon are levied on all distributed directly in equity. and retained earnings. In addition to corporate income tax, income The net interest expense from underfunded pension plans and generated in Germany is subject to a trade tax. It varies depending Deferred tax liabilities are recognized for differences between the similar obligations declined year on year as a result of the lower on the municipality in which the company is represented. The proportional IFRS equity and the tax base of the investment in a interest rate used to determine expenses for pension benefits weighted average tax rate was 14.6% in 2021 (2020: 14.5%). The consolidated subsidiary if a reversal of these differences is expected compared with the previous year. 30% rate used to calculate deferred taxes for German Group in the foreseeable future. Deferred tax liabilities are recognized for companies remained unchanged in 2021. The income of foreign dividend distributions planned for the following year if these The rise in other financial expenses was primarily due to higher net Group companies is assessed using the tax rates applicable in their distributions lead to a reversal of temporary differences. expenses associated with the translation of bonds and the valuation respective countries. of the corresponding hedging instruments against interest and Provisions for German trade tax, corporate income tax and similar currency risks. Deferred taxes are recorded for temporary differences between the income taxes are calculated and recognized based on the expected carrying amount of assets and liabilities in the financial statements taxable income of the consolidated companies less any prepay- according to IFRS and the carrying amounts for tax purposes as ments that have been made. Provisions are set up for interest well as for tax loss carryforwards and unused tax credits. These also accrued. This interest is reported under other financial result, not tax comprise temporary differences arising from business combinations, expense. Other taxes to be assessed are considered accordingly. with the exception of goodwill. Deferred tax assets and liabilities are calculated using the respective country-specific tax rates applicable IFRIC 23 clarifies the application of the recognition and measurement for the period in which the asset or liability is realized or settled. Tax policies from IAS 12 when there is uncertainty regarding income rate changes enacted or substantively enacted on or before the tax-related treatment of individual transactions. They are accounted balance sheet date are taken into consideration. for with the assumption that tax authorities will examine the questionable transaction and have all relevant information. The Deferred tax assets are offset against deferred tax liabilities provided amount of risk provisions is calculated and reviewed with they are related to the same taxation authority. Surpluses of deferred consideration for the results of past tax audits as well as the legal tax assets are only recognized provided that the tax benefits are assessment of not yet audited transactions and the risk of a deviating likely to be realized. The valuation of deferred tax assets is based on tax-related interpretation by the tax authorities. The most probable the probability of a reversal of the differences and the assessment of value of the individual risks is recognized. the ability to utilize tax loss carryforwards and unused tax credits. This depends on whether future taxable profits will exist during the Tax expense and tax rate period in which temporary differences are reversed and in which tax loss carryforwards and unused tax credits can be claimed. The The BASF Group tax rate amounted to 19.2% in 2021 (2020: 5.8%). assessment of recoverability of deferred tax assets is based on The relatively high tax rate in relation to 2020 resulted primarily from internal projections of the future earnings of the particular Group lower nondeductible operating expenses, caused largely in the company. previous year by non-tax-effective impairments of goodwill, and from the increased earnings contributions of countries with higher
BASF Report 2021 Consoli dated Financial Statements – Notes 232 tax rates. Particularly higher tax-exempt income, mainly in Tax expense connection with the divestiture of the share in Solenis, had an Million € offsetting impact. 2021 2020 Current tax expense 1,436 398 Corporate income tax, solidarity surcharge and trade taxes (Germany) 38 73 Foreign income tax 1,575 739 Taxes for prior years –176 –414 Deferred tax expense (+) / income (–) –6 –489 From changes in temporary differences 49 –129 From changes in tax loss carryforwards/unused tax credits –67 –372 From changes in the tax rate –2 32 From valuation allowances on deferred tax assets 14 –20 Income taxes 1,430 –91 Reconciliation of income taxes and the effective tax rate 2021 2020 Million € % Million € % Income before income taxes 7,448 –1,562 Expected tax based on German corporate income tax rate (15%) 1,117 15.0 –234 15.0 Solidarity surcharge 0 0.0 2 –0.1 Trade taxes 78 1.1 –255 16.3 Foreign tax rate differential 548 7.4 55 –3.5 Tax-exempt income –211 –2.8 –64 4.1 Nondeductible expenses 140 1.9 339 –21.7 Income of companies accounted for using the equity method (income after taxes) –56 –0.7 106 –6.8 Taxes for prior years (current and deferred taxes) –176 –2.4 –103 6.6 Deferred tax liabilities for the future reversal of temporary differences associated with shares in –6 –0.1 –66 4.2 participating interests Changes in the tax rate –2 0.0 32 –2.1 Other –3 0.0 97 –6.2 Income taxes / effective tax rate 1,430 19.2 –91 5.8
BASF Report 2021 Consoli dated Financial Statements – Notes 233 Deferred taxes result from temporary differences between tax acquisitions according to IFRS 3 has resulted in significant deviations balances and the measurement of assets and liabilities according to between fair values and the values in the tax accounts. This primarily IFRS as well as from tax loss carryforwards and unused tax credits. leads to deferred tax liabilities. The remeasurement of all the assets and liabilities associated with Deferred taxes Deferred tax assets and liabilities 2021 Million € January 1, 2021, Effects recognized Effects recognized Business December 31, Deferred tax Deferred tax net in income in equity (OCI) combinations Other 2021, net assets liabilities Intangible assets –955 –37 –26 –22 –6 –1,045 41 –1,086 Property, plant and equipment –1,068 –18 –64 –3 22 –1,131 303 –1,434 Financial assets –74 8 –26 – 25 –67 43 –109 Inventories and accounts receivable –169 –187 –53 –1 37 –372 292 –664 Provisions for pensions and similar obligations 2,851 18 –790 – 6 2,085 2,781 –695 Other provisions and liabilities 831 148 78 2 3 1,062 1,168 –106 Tax loss carryforwards 505 69 4 1 1 580 580 – Other 18 4 –3 – –31 –11 63 –75 Deferred tax assets (liabilities) before netting 1,939 6 –878 –23 57 1,101 5,270 –4,169 Netting – – – – – – –2,670 2,670 Deferred tax assets (liabilities) after netting 1,939 6 –878 –23 57 1,101 2,600 –1,499
BASF Report 2021 Consoli dated Financial Statements – Notes 234 Deferred tax assets and liabilities 2020 Million € January 1, 2020, Effects recognized Effects recognized Business December 31, Deferred tax Deferred tax net in income in equity (OCI) combinations Other 2020, net assets liabilities Intangible assets –934 –8 33 –42 –4 –955 89 –1,044 Property, plant and equipment –1,081 –65 101 –36 13 –1,068 246 –1,314 Financial assets –136 64 5 – –7 –74 44 –118 Inventories and accounts receivable –199 82 –31 –3 –18 –169 232 –401 Provisions for pensions and similar obligations 2,424 28 384 14 1 2,851 3,342 –491 Other provisions and liabilities 841 42 –91 3 36 831 986 –155 Tax loss carryforwards 193 332 –11 1 –10 505 505 – Other 15 14 –9 2 –4 18 82 –64 Deferred tax assets (liabilities) before netting 1,123 489 381 –61 7 1,939 5,526 –3,587 Netting – – – – – – –2,140 2,140 Deferred tax assets (liabilities) after netting 1,123 489 381 –61 7 1,939 3,386 –1,447 Deferred tax assets on deductible temporary differences in the Tax loss carryforwards Tax liabilities amount of €245 million were not recognized in 2021 (2020: €182 million), as their utilization at reversal was not reasonably No deferred tax assets were recognized for tax loss carryforwards of Tax liabilities primarily include assessed income taxes and other certain. €172 million in 2021 (2020: €257 million). Of these, €3 million will taxes as well as estimated income taxes not yet assessed for the expire in 2022, €4 million in 2023, €2 million in 2024, €12 million in current year. Undistributed earnings of subsidiaries resulted in temporary 2025, €52 million in 2026, and €20 million in 2027 and thereafter. differences of €11,587 million in 2021 (2020: €10,398 million) for The remaining €79 million will not expire. which deferred tax liabilities were not recognized, as they are either not subject to taxation on payout or they are expected to be Surpluses of deferred tax assets for companies that reported tax reinvested for an indefinite period of time. losses in 2021 or 2020 totaled €2,379 million as of Decem- ber 31, 2021 (December 31, 2020: €2,645 million). Deferred taxes were recognized because, due to planned earnings, the use of temporary differences or loss carryforwards is expected.
BASF Report 2021 Consoli dated Financial Statements – Notes 235 13 Noncontrolling interests Noncontrolling interests in profits rose year on year in 2021, Income and expenses recognized in equity that were attributable to especially at BASF PETRONAS Chemicals Sdn. Bhd., Petaling noncontrolling interests totaled €90 million in 2021 and –€49 million Noncontrolling interests in profits and losses Jaya, Malaysia, and BASF TotalEnergies Petrochemicals LLC, in 2020. These effects resulted from currency translation in both Million € Wilmington, Delaware, resulting mainly from considerably higher years. 2021 2020 sales prices and volumes. Noncontrolling interests in profits 480 90 Noncontrolling interests in losses –21 –105 Noncontrolling interests in losses were recognized in 2020, Total 459 –15 primarily at BASF PETRONAS Chemicals Sdn. Bhd. due to the impairments of assets. Noncontrolling interests December 31, 2021 December 31, 2020 Equity interest Equity interest Group company Partner % Million € % Million € BASF India Limited, Mumbai, India Free float 26.67 71 26.67 52 BASF PETRONAS Chemicals Sdn. Bhd., PETRONAS Chemicals Group Berhad, 40.00 184 40.00 81 Petaling Jaya, Malaysia Kuala Lumpur, Malaysia BASF Shanghai Coatings Co., Ltd., Shanghai, China Shanghai Huayi Fine Chemical Co., Ltd, Shanghai, China 40.00 96 40.00 78 BASF TODA Battery Materials, LLC, Yamaguchi, Japan TODA KOGYO CORP., Hiroshima, Japan 34.00 32 34.00 29 BASF TotalEnergies Petrochemicals LLC, Total Petrochemicals & Refining USA, Inc., Houston, Texas 40.00 265 40.00 256 Wilmington, Delaware BASF Shanshan Battery Materials Co., Ltd., Ningbo Yongxiang Investment Co., Ltd., Ningbo, China 49.00 342 – – Changsha, China Shanghai BASF Polyurethane Company Ltd., Shanghai Hua Yi (Group) Co (SHYG), Schanghai, China, and Sinopec 30.00 146 30.00 98 Shanghai, China Shanghai Gaoqiao Petrochemical Company Limited, Beijing, China Other 153 76 Total 1,289 670
BASF Report 2021 Consoli dated Financial Statements – Notes 236 14 Intangible assets The expected useful lives and amortization methods of intangible BASF’s goodwill is allocated to 20 cash-generating units (2020: 20), assets are based on historical values, plans and estimates. The which are defined either on the basis of business units or at a higher Accounting policies weighted average amortization periods of intangible assets were as level. follows: Acquired intangible assets (excluding goodwill) with defined The respective recoverable amounts were determined using the useful lives are generally measured at cost less straight-line Weighted average amortization in years value in use. Plans approved by company management and their amortization. The useful life is determined using the period of the 2021 2020 respective cash flows for the next five years were used. For the underlying contract or the period of time over which the intangible period thereafter, a terminal value was calculated using a forward asset can be expected to be used. Distribution and similar rights 15 14 projection from the last detailed planning year as a perpetual annuity. Product rights, licenses and trademarks 25 30 Planning is based on experience, current performance and Impairments are recognized if the recoverable amount of the asset Know-how, patents and production technologies 16 16 management’s best possible estimates on the future development is lower than the carrying amount. The recoverable amount is the Internally generated intangible assets 5 4 of individual parameters, such as raw materials prices and profit higher of either the fair value less costs to sell or the value in use. The Other rights and values 8 5 margins. Market assumptions regarding, for example, economic value in use is determined on the basis of future cash inflows and development, inflation expectations and market growth are included outflows, and the weighted average cost of capital after taxes, based on external macroeconomic and industry-specific sources. depending on tax rates and country-related risks. If the reasons for Emission rights: Emission certificates, which are granted free of an impairment no longer exist, the write-downs are reversed up to charge by the German Emissions Trading Authority (Deutsche The fundamental transformation of the automotive industry will have the value of the asset, had an impairment not been recognized. Emissionshandelsstelle) or a similar authority in other countries, are a significant impact on the emissions catalyst business, which Depending on the type of intangible asset, amortization is reported recognized in the balance sheet with a value of zero. Emission rights belongs to the Catalysts (excluding battery materials) cash- under cost of sales, selling expenses, research and development purchased on the market are capitalized at cost as intangible assets. generating unit. In the planning period, the demand for catalysts is expenses or other operating expenses. Emissions generated create an obligation to surrender the emission initially expected to remain stable as a result of higher environmental certificates. Intangible assets purchased on the market are standards. In the medium term, the transition from combustion Intangible assets with indefinite useful lives are trade names and subsequently measured at fair value, up to a maximum of the engines to electromobility will lead to a steady decline in demand. trademarks that have been acquired as part of acquisitions. These amount of the acquisition costs. If the fair value is lower than the For this reason, the growth rate for perpetual annuity was adjusted are measured at cost and tested for impairment annually, or if there carrying amount on the balance sheet date, the emission rights are from 2.0% in 2020 to –0.7% in 2021. is an indication that their value has declined. impaired. For more information on the Surface Technologies segment, which the cash-generating Catalysts (excluding battery materials) unit is allocated to, see the Management’s Report from page 82 onward Internally generated intangible assets primarily comprise Goodwill is only written down in the case of an impairment. The required discounting of cash flows for impairment testing is internally developed software. Such software and other internally Impairment testing for goodwill is performed once a year and calculated using the weighted average cost of capital rate after tax, generated intangible assets are measured at cost and amortized whenever there is an indication of impairment. Goodwill impairments which is determined using the capital asset pricing model. over their estimated useful lives. Impairments are recognized if the are not reversed. For more information on the weighted cost of capital rate, see Note 1 from page 200 onward carrying amount of an asset exceeds the recoverable amount. In addition to those costs directly attributable to the asset, costs of internally generated intangible assets also include an appropriate portion of overhead costs.
BASF Report 2021 Consoli dated Financial Statements – Notes 237 Goodwill of cash-generating units Million € 2021 2020 Weighted Weighted cost of capital cost of capital a a Cash-generating unit Goodwill after taxes Growth rate Goodwill after taxes Growth rate Agricultural Solutions division 3,187 5.54% 2.0% 3,039 4.86% 2.0% Catalysts division (excluding battery materials) 1,306 6.63% –0.7% 1,244 6.43% 2.0% Catalysts division (battery materials) 338 6.51% 2.0% 63 6.76% 2.0% Personal Care Ingredients in the Care Chemicals division 507 5.54% 2.0% 493 5.21% 2.0% Surface Treatment in the Coatings division 712 6.67% 2.0% 696 6.42% 2.0% Other cash-generating units 1,470 5.51%–6.67% 0.0–2.0% 1,424 5.21%–6.92% 0.0–2.0% Goodwill as of December 31 7,520 6,959 a Growth rates used in impairment tests to determine terminal values in accordance with IAS 36 The annual impairment tests of the 20 cash-generating units were In 2020, a goodwill impairment for the cash-generating Surface performed in the fourth quarter of 2021. The calculation also takes Treatment unit was recognized in the amount of €786 million in into account capital structure and the beta factor of the respective other expenses due to the significant drop in demand from effects of peer group as well as the average tax rate of each cash-generating the coronavirus pandemic and expectations for slow recovery. The unit. Impairment tests were performed on the units assuming a outcome of the annual impairment test in 2021 was that the weighted average cost of capital rate after taxes of between 5.51% recoverable amount for the cash-generating unit exceeded the and 6.67% (2020: between 4.86% and 6.92%). This corresponds to carrying amount by €408 million. The recoverable amount would be a weighted average cost of capital rate before taxes of between equal to the carrying amount if the weighted average cost of capital 6.53% and 8.94% (2020: between 6.50% and 8.85%). rate rose by 1.05 percentage points or the growth rate were 1.46 percentage points lower. After determining the recoverable amounts for the cash-generating units, the conclusion was that reasonable possible deviations from the key assumptions would not lead to the carrying amount of any unit except the Surface Treatments unit exceeding the respective recoverable amounts.
BASF Report 2021 Consoli dated Financial Statements – Notes 238 Development of intangible assets Additions from acquisitions resulted in the amount of €392 mil- lion from the acquisition of the 51% share in BASF Shanshan Development of intangible assets 2021 Battery Materials Co., Ltd., Changsha, China. It is allocated to the Million € Surface Technologies segment. Know-how, Internally Product rights, patents and generated Other For more information on acquisitions, see Note 3 from page 207 onward Distribution and licenses and production intangible rights and a similar rights trademarks technologies assets values Goodwill Total Disposals of intangible assets amounting to €638 million primarily Cost concerned fully amortized distribution and similar rights in the As of January 1, 2021 2,731 1,387 4,182 234 973 7,734 17,241 Industrial Solutions and Nutrition & Care segments. Furthermore, Changes in the scope of consolidation 0 6 0 – 0 – 6 customer relationships in the amount of €72 million and goodwill in Additions 2 1 16 32 28 – 78 the amount of €8 million were derecognized in connection with a Additions from acquisitions 45 – 89 – 5 254 392 divestiture in the Nutrition & Care segment. In addition, goodwill was derecognized through a divestiture in the Surface Technologies Disposals –335 –17 –142 –3 –82 –60 –638 segment. Transfers 0 0 –17 5 8 – –4 Transfers to disposal groups – – 0 – 0 –13 –13 Transfers to disposal groups related to the adjustment of Currency effects 105 42 176 1 16 400 739 reclassified amounts of the divested pigments business and good- As of December 31, 2021 2,547 1,419 4,304 268 949 8,314 17,802 will of the kaolin minerals business held for sale. Accumulated amortization In 2021, additions to accumulated amortization contained As of January 1, 2021 1,340 275 1,185 140 381 775 4,096 impairments of €2 million. They primarily related to unrealized IT Changes in the scope of consolidation 0 7 0 0 0 – 7 projects not allocated to an operational segment. Additions 171 44 260 26 113 – 614 of which impairments 0 – 1 1 – – 2 Disposals –320 –17 –142 –3 –74 –26 –581 Transfers 0 – 0 0 0 – 0 Transfers to disposal groups 0 – 0 – 0 – 0 Currency effects 52 7 52 0 10 45 167 As of December 31, 2021 1,243 316 1,356 164 430 794 4,303 Net carrying amount as of 1,304 1,103 2,949 104 520 7,520 13,499 December 31, 2021 a Including licenses to such rights and values
BASF Report 2021 Consoli dated Financial Statements – Notes 239 Development of intangible assets 2020 Million € Know-how, Internally Product rights, patents and generated Other Distribution and licenses and production intangible rights and a similar rights trademarks technologies assets values Goodwill Total Cost As of January 1, 2020 2,891 1,433 4,319 196 611 8,105 17,555 Changes in the scope of consolidation – – –59 – – – –59 Additions 2 0 40 37 24 – 103 Additions from acquisitions 123 – 171 0 376 21 691 Disposals –147 0 –67 –7 –28 – –249 Transfers –6 0 –34 8 24 – –8 Transfers to disposal groups 7 0 13 – –14 – 6 Currency effects –139 –46 –201 0 –20 –392 –798 As of December 31, 2020 2,731 1,387 4,182 234 973 7,734 17,241 Accumulated amortization As of January 1, 2020 1,323 238 1,072 112 285 – 3,030 Changes in the scope of consolidation – – –57 – – – –57 Additions 217 44 281 33 135 786 1,496 of which impairments 15 2 15 3 0 786 821 Disposals –143 0 –59 –6 –27 – –235 Transfers 6 0 –1 1 –2 – 4 Transfers to disposal groups –5 0 0 0 1 – –4 Currency effects –58 –7 –51 0 –11 –11 –138 As of December 31, 2020 1,340 275 1,185 140 381 775 4,096 Net carrying amount as of 1,391 1,112 2,997 94 592 6,959 13,145 December 31, 2020 a Including licenses to such rights and values
BASF Report 2021 Consoli dated Financial Statements – Notes 240 15 Property, plant and equipment Both movable and immovable fixed assets are principally depreciated Borrowing costs: If borrowing costs are directly incurred as part of using the straight-line method. The estimated useful lives and the acquisition, construction or production of a qualifying asset, they Accounting policies depreciation methods of property, plant and equipment are based are capitalized as part of the acquisition or production cost of that on historical values, plans and estimates. The depreciation methods, asset. A qualifying asset is an asset for which the process necessary Property, plant and equipment are measured at cost less useful lives and residual values are reviewed at each balance sheet to make it ready for its intended use or sale is longer than one year. depreciation and impairment over their useful lives. The revaluation date. Borrowing costs are capitalized up to the date the asset is ready for method is not applied. Low-value assets are fully expensed in the its intended use. Borrowing costs were calculated based on a rate year of acquisition. The weighted average depreciation periods of continuing operations of 1.25% (previous year: 1.5%) and adjusted on a country-specific were as follows: basis, if necessary. All other borrowing costs are recognized as an The cost of self-constructed plants includes direct costs, appropriate expense in the period in which they are incurred. allocations of material and production overhead costs, and a share Weighted average depreciation in years of the general administrative costs of the divisions involved in the 2021 2020 Government grants: Government grants related to the acquisition construction of the plants. or construction of property, plant and equipment reduce the Buildings and structural installations 18 16 acquisition or construction cost of the respective assets. Other Expenses related to the scheduled maintenance of large-scale Machinery and technical equipment 11 10 government grants or government assistance are recognized plants are capitalized separately and depreciated using the Miscellaneous equipment and fixtures 7 6 immediately as other operating income or treated as deferred straight-line method over the period until the next planned income and released over the underlying period. turnaround. Costs for the replacement of components are If there is indication of a possible cause for impairment, an impairment recognized as assets if an additional future benefit is expected. The test is performed. Impairments to property, plant and equipment are carrying amount of the replaced components is derecognized. recognized if the recoverable amount of the asset is lower than the Costs for maintenance and repair as part of normal business carrying amount. The measurement is based on fair value less costs operations are recognized as an expense. to sell or the value in use. An impairment is recognized for the difference between the carrying amount and the recoverable As lessee, BASF generally recognizes all leases in the balance sheet. amount. If the reasons for an impairment no longer exist, the The right-of-use assets from leases and lease liabilities are measur ed write-downs are reversed up to the value of the asset, had an at the present value of the financial commitments entered. impairment not been recognized. Impairments and reversals of For more information, see Note 16 from page 244 onward impairments are reported in other operating income and expenses. For more information on the value in use and the weighted cost of capital rate, see Note 1 from Investment properties held to realize capital gains or rental income page 200 onward are immaterial. They are valued at the lower of fair value or cost less depreciation.
BASF Report 2021 Consoli dated Financial Statements – Notes 241 Development of property, plant and equipment including right-of-use assets arising from leases in 2021 Million € Right-of-use Right-of-use Advance Advance Machinery and machinery and Miscellaneous miscellaneous payments and payments Right-of-use Right-of-use technical technical equipment and equipment and construction in for right-of-use Land land Buildings buildings equipment equipment fixtures fixtures progress assets Total Cost As of January 1, 2021 947 451 10,749 834 43,902 505 4,773 690 3,164 – 66,015 Changes in the scope of consolidation 0 –2 –2 0 –2 – –2 –1 0 – –10 Additions 7 11 141 168 814 98 203 186 2,301 150 4,078 Additions from acquisitions – 39 104 – 149 – 3 – 38 – 332 Disposals –8 –1 –97 –49 –556 –12 –171 –134 –140 – –1,168 Transfers –5 10 310 – 1,392 – 118 – –1,723 – 102 Transfers to disposal groups –59 0 –60 –2 –360 0 –15 –5 –9 0 –510 Currency effects 25 37 350 31 1,442 33 150 20 104 – 2,193 As of December 31, 2021 905 544 11,495 982 46,781 624 5,058 756 3,735 150 71,030 Accumulated depreciation As of January 1, 2021 66 100 6,689 292 34,882 229 3,576 357 177 – 46,368 Changes in the scope of consolidation – –2 –2 0 –1 – –3 –1 0 –1 –9 Additions –3 17 380 129 1,921 80 331 173 35 – 3,064 of which impairments –3 – 27 8 72 – 3 – 35 – 142 Disposals 0 –1 –83 –27 –517 –8 –163 –103 –132 – –1,033 Transfers – 2 3 –1 131 – –1 – –32 – 102 Transfers to disposal groups –13 0 –45 –1 –336 – –11 –3 0 0 –409 Currency effects 4 9 174 16 1,058 14 104 11 5 – 1,395 As of December 31, 2021 54 125 7,115 408 37,138 316 3,833 435 53 – 49,477 Net carrying amount as of 852 419 4,380 574 9,642 308 1,225 321 3,681 150 21,553 December 31, 2021
BASF Report 2021 Consoli dated Financial Statements – Notes 242 Additions to property, plant and equipment arising from investment Disposals of property, plant and equipment mainly included the projects (excluding leases) amounted to €3,465 million in 2021. sale of the production site in Kankakee, Illinois, and the disposal of Investments were made at the following sites in particular: BASF's share in the condensate splitter in Port Arthur, Texas. Ludwigshafen, Germany; Antwerp, Belgium; Zhanjiang, China; Geismar, Louisiana; and Freeport, Texas. Material investments Transfers related mainly to the reclassification of operation-ready included engineering services and the procurement of technical assets from construction in progress to other asset categories. equipment in connection with development of the new Verbund site in Zhanjiang, China, as well as construction and expansion of Transfers to disposal groups related largely to reclassified amounts ethylene oxide and polyethylene oxide production plants in Antwerp, in connection with the divested kaolin minerals business. Belgium, and Ludwigshafen, Germany. Investments also included For more information on divestitures, see Note 3 from page 207 onward modernization measures, particularly at the Ludwigshafen site. Government grants for funding investment measures reduced asset Currency effects raised property, plant and equipment by additions by €5 million. The additions to advance payments for €798 million and resulted mainly from appreciation of the U.S. dollar right-of-use assets related only to the acquisition of land use rights and the Chinese renminbi against the euro. at the new Verbund site in Zhanjiang, China. Additions from acquisitions resulted from the acquisition of the 51% share in BASF Shanshan Battery Materials Co., Ltd. For more information on acquisitions, see Note 3 from page 207 onward In 2021, impairments of €155 million and reversals of impairments of €13 million were included in accumulated depreciation. Impairments of €49 million related to machinery and technical equipment as well as buildings at a production site in Asia in the Industrial Solutions segment. The value in use of €2 million was calculated applying a pre-tax cost of capital rate of 6.89%. This corresponds to a cost of capital rate of 9.05%. Furthermore, there was a complete write-down in the amount of €17 million due a plant closure at a production site in North America in the Materials segment, which related almost entirely to machinery and technical equipment. Impairments to construction in progress mainly related to discontinued investment projects. Reversals of impairments in the amount of €13 million resulted primarily from an increase in the fair value of plants impaired at a site in North America in 2020.
BASF Report 2021 Consoli dated Financial Statements – Notes 243 Development of property, plant and equipment including right-of-use assets arising from leases in 2020 Million € Right-of-use Right-of-use Advance Advance Machinery and machinery and Miscellaneous miscellaneous payments and payments Right-of-use Right-of-use technical technical equipment and equipment and construction in for right-of-use Land land Buildings buildings equipment equipment fixtures fixtures progress assets Total Cost As of January 1, 2020 950 440 10,757 808 43,783 399 4,808 551 3,006 6 65,508 Changes in the scope of consolidation 1 – – – – – 2 1 37 – 41 Additions 18 40 161 120 787 147 199 202 1,842 – 3,516 Additions from acquisitions 12 – 82 3 400 10 3 1 48 – 559 Disposals –3 –13 –129 –53 –590 –13 –145 –36 –216 – –1,198 Transfers 5 – 282 1 1,123 6 77 –1 –1,515 –6 –28 Transfers to disposal groups 3 –2 – –3 –34 – –4 –2 60 – 18 Currency effects –39 –14 –404 –42 –1,567 –44 –167 –26 –98 – –2,401 As of December 31, 2020 947 451 10,749 834 43,902 505 4,773 690 3,164 – 66,015 Accumulated depreciation As of January 1, 2020 53 65 6,374 144 33,110 144 3,472 196 158 – 43,716 Changes in the scope of consolidation – – – – – – 1 – – – 1 Additions 19 40 614 188 3,401 106 392 195 234 – 5,189 of which impairments 18 23 250 50 1,396 25 49 14 234 – 2,059 Disposals –2 –1 –112 –27 –546 –8 –135 –25 –214 – –1,070 Transfers – – –2 – 34 – –45 –1 –10 – –24 Transfers to disposal groups – – 2 2 7 – –1 3 10 – 23 Currency effects –4 –4 –187 –15 –1,124 –13 –108 –11 –1 – –1,467 As of December 31, 2020 66 100 6,689 292 34,882 229 3,576 357 177 – 46,368 Net carrying amount as of December 31, 2020 881 351 4,060 542 9,020 276 1,197 333 2,987 − 19,647
BASF Report 2021 Consoli dated Financial Statements – Notes 244 16 Leases – A number of leases, particularly for real estate and barges, include plan) or the scope (either quantitatively or time-related) of use of extension and termination options. Extension and termination the asset. Accounting policies options are taken into account on recognition of the lease liability only if BASF is reasonably certain that these options will be BASF presents the interest component of lease payments in cash A lease is an agreement that conveys the right to control the use of exercised in the future. When contract terms are being deter- flows from operating activities and the repayment portion in cash identified asset for a defined period of time in return for a payment. mined, consideration is given to all facts and circumstances that flows from financing activities. Lease payments under short-term offer an economic incentive for exercising extension options or agreements, agreements with low-value assets or variable payments Leases in which BASF is a lessee mainly relate to real estate and not exercising termination options. Changes in lease terms arising are presented in cash flows from operating activities. transportation and technical equipment. from the exercise of an extension option or non-exercise of a termination option are only considered if sufficient certainty exists. Leases can be embedded within other contracts. If separation is Estimates and expectations which are asserted at the required under IFRS, the embedded lease is recorded separately commencement date of the lease liability and the right-of-use from its host contract and each component of the contract is asset and pertain to future payments not yet determined on the accounted and measured in accordance with the applicable date of provision are assessed continuously during the lease regulations. term. If subsequently improved or changed knowledge influences the expected payment profile over time, the lease liability is As lessee, BASF accounts for nearly all leases, recognizing right-of- remeasured. use assets for leased assets and liabilities for lease agreements. The – If an existing lease contract is modified, the lease liability and following principles are considered: right-of-use asset must be remeasured, provided the modification – BASF exercises the exemption for lease agreements with a changes the payment profile (pursuant to the interest and principal maximum term of 12 months from the date of provision and low-value assets. Low-value assets are generally defined as leased assets worth a maximum of €5,000. BASF as lessee – Lease liabilities are measured at the present value of the remaining lease payments, taking into account the incremental borrowing Lease liabilities rate. Million € – As a general rule, BASF separates non-lease components, such December 31, 2021 December 31, 2020 as services, from lease payments. Future lease Future lease Lease liabilities Interest portion payments Lease liabilities Interest portion payments – A right-of-use asset is generally recognized at the same amount as the lease liability. Differences may arise from the lease payments 2022 336 30 366 334 29 363 made prior to the provision of the leased asset, less any lease 2023 219 27 246 233 28 261 incentives received. 2024 153 29 182 156 23 179 – After capitalization at commencement date, whereby the right-of- 2025 100 25 125 109 24 133 use asset is measured at cost, the right-of-use asset is generally 2026 74 20 94 74 18 92 depreciated over the lease term using the straight-line method. 2027 and thereafter 532 167 699 455 151 606 Total 1,414 298 1,712 1,361 273 1,634
BASF Report 2021 Consoli dated Financial Statements – Notes 245 Expenses and income in the statement of income from leases for BASF Future lease payments to BASF from operating lease contracts as lessee Million € Million € December 31, 2021 December 31, 2020 2021 2020 2022 35 32 Interest expenses for lease liabilities –36 –36 2023–2026 106 92 Expenses for variable lease payments not included in the –30 –13 measurement of lease liabilities 2027 and thereafter 49 48 Income from sublease agreements – 1 Total 190 172 Expenses for short-term leases –129 –131 Expenses for leases for low-value assets –27 –43 Income from leases for BASF as lessor Gains and losses from sale and leaseback transactions – – Million € 2021 2020 Total –222 –222 Income from finance leases 3 25 In 2021 and 2020, no material sale and leaseback transactions of which gains and losses from sales 1 24 occurred. financial income from net investment 2 1 in the lease A rental agreement for a building representing a volume of €60 mil- income from variable lease payments not – – lion was concluded in December 2021. The rental term begins at included in measurement of net investment the end of 2022. Income from operating leases 35 31 of which income from variable lease payments not – – BASF as lessor dependent upon an index or interest rate Total 38 56 BASF acts as a lessor for finance leases to a minor extent only. Receivables on finance leases were €44 million in 2021 (2020: €44 million). The leased assets pertained primarily to buildings and production facilities. Claims arising from operating leases amounted to €190 million in 2021 (2020: €172 million). As in the previous year, there were no material operating leases for property, plant and equipment.
BASF Report 2021 Consoli dated Financial Statements – Notes 246 17 Inventories Inventories Million € Accounting policies Dec. 31, Dec. 31, 2021 2020 Raw materials and factory supplies 4,414 3,105 Inventories are measured at acquisition cost or cost of conversion based on the weighted average method. If the market price or the Work in progress, finished goods and merchandise 9,337 6,784 fair value of the sales products, which are based on the net r ealizable Advance payments and services in progress 117 121 values, is lower, then the sales products are written down to this Inventories 13,868 10,010 lower value. The net realizable value is the estimated price in the ordinary course of business less the estimated costs of completion Work in progress, finished goods and merchandise are combined and the estimated selling costs. into one item due to production conditions in the chemical industry. Services in progress mainly relate to services not invoiced as of the In addition to direct costs, cost of conversion includes an appropriate balance sheet date. allocation of production overhead costs based on normal utilization rates of the production plants, provided that they are related to the Cost of sales included inventories recognized as an expense production process. Pensions, social services and voluntary social amounting to €44,244 million in 2021, and €30,379 million in 2020. benefits are also included, as well as allocations for administrative costs, provided they relate to the production. Borrowing costs are Write-downs on inventory were recognized in the amount of not included in cost of conversion. €97 million in 2021, and in the amount of €65 million in 2020. Inventories may be impaired if the prices for the sales products decline, or in cases of a high rate of days sales of inventory (DSI). Write-downs on inventories are reversed if the reasons for them no longer apply. The exception made by IAS 2 for traders is applied to the measurement of precious metals. Accordingly, inventories held exclusively for trading purposes are measured at fair value less costs to sell and recognized in the precious metal trading item (carrying amount as of December 31, 2021: €1,554 million; as of December 31, 2020: €1,604 million) under miscellaneous current assets. All changes in value are immediately recognized in the statement of income.
BASF Report 2021 Consoli dated Financial Statements – Notes 247 18 Receivables and miscellaneous assets The changes in noncurrent loans and interest receivables were predominantly due to reimbursements of loans to nonconsolidated subsidiaries. Current loan receivables increased because of the sale Other receivables and miscellaneous assets of assets to a joint venture partner in North America. Million € December 31, 2021 December 31, 2020 The rise in noncurrent derivatives with positive fair values primarily Noncurrent Current Noncurrent Current affected the market valuation of combined interest rate and currency Loans and interest receivables 93 149 127 123 swaps. The change in current derivatives with positive fair market Derivatives with positive fair values 335 610 105 414 values was largely attributable to the increase in fair values of Receivables from finance leases 40 4 41 3 commodity derivatives for precious metals. Receivables from capital equipment of nonconsolidated subsidiaries – 167 – 122 Bank acceptance drafts are used as an alternative form of payment Receivables from bank acceptance drafts – 387 – 288 in China. Bank acceptance drafts are issued at a discount from their Other 270 376 287 261 par value. They can be held to maturity, traded or redeemed Other receivables and assets that qualify as financial instruments 738 1,692 560 1,211 prematurely at a discount. If BASF discounts a bank acceptance Prepaid expenses 77 327 79 257 draft with recourse, a liability toward the credit institution is Defined benefit assets 661 – 126 – recognized in the amount of the payment received. The increase Tax refund claims 198 1,610 104 1,158 relates to higher sales and broader use of this form of payment. Employee receivables 0 24 0 21 Prepaid expenses in 2021 mainly included prepayments of Precious metal trading items – 1,554 – 1,604 €41 million related to operating activities compared with €28 million Other 48 361 43 422 in 2020, as well as €93 million in prepayments for insurance in 2021 Other receivables and assets that do not qualify as financial instruments 984 3,876 352 3,462 compared with €79 million in 2020. Prepayments for license costs Other receivables and miscellaneous assets 1,722 5,568 912 4,673 decreased from €70 million in 2020 to €49 million in 2021. Prepaid expenses in 2021 included higher advance payments for received precious metal catalysts to be refurbished. As in the previous year, defined benefit assets were recognized in 2021 mainly at Group companies in Switzerland and the United Kingdom. The change in current tax refund claims was largely attributable to the rise in value-added tax receivables in Germany as well as the rise in income tax/other tax receivables at South American Group companies.
BASF Report 2021 Consoli dated Financial Statements – Notes 248 The rise in current other receivables and assets, which represent Valuation allowances on receivables (financial instruments) 2021 financial instruments, was due to higher deposits on commodity Million € derivatives and increased receivables for other refunds. As of As of Reclassification Translation December 31, January 1, 2021 Additions Releases between stages effect 2021 Precious metal trading items primarily comprise physical items, Accounts receivable, trade 299 120 110 − 1 310 precious metal accounts as well as long positions in precious of which stage 2 42 52 47 – – 47 metals, which are largely hedged through forward sales or stage 3 257 68 63 – 1 263 derivatives. Other receivables 122 28 40 − 2 112 Expected losses of trade accounts receivable at BASF are of which stage 1 2 15 14 – 0 3 calculated primarily on the basis of internal or external customer stage 2 0 0 0 – 0 0 ratings and the associated probability of default. stage 3 120 13 26 – 2 109 Total 421 148 150 − 3 422 The following table presents the gross values and credit risks for trade accounts receivable measured at amortized cost as of December 31, 2021. At BASF, a comprehensive, global credit insurance program covers Additions included valuation allowances of €1 million due to a accounts receivable, trade. Under a global excess of loss policy, change in valuation parameters. Additions primarily included Accounts receivable, trade future bad debts are insured for essentially all BASF Group valuation allowances of loans to former and current Group Million € companies excluding joint ventures. The program has no impact on companies. Creditworthiness as the calculation of valuation allowances in accordance with IFRS 9. of December 31, Equivalence to No compensation claims were incurred in either 2021 or 2020. 2021 external ratinga Gross carrying amounts High/medium credit from AAA to BBB– 7,325 Payment terms are generally agreed upon individually with custom- rating Low credit rating from BB– to D 4,707 ers and, as a rule, are within 90 days. In 2021, valuation allowances of €120 million (2020: €142 million) were added for trade accounts a Standard & Poor’s rating receivable, and valuation allowances of €110 million (2020: €124 million) were reversed. There are currently no significant credit risks (or a concentration thereof) associated with other financial instruments. BASF generally In 2021, valuation allowances of €28 million were recognized for monitors the credit risk associated with counterparties with which other receivables representing financial instruments, and valuation receivables exist representing financial instruments. In accordance allowances of €40 million were reversed. In the previous year, with IFRS 9, impairments for expected credit losses on receivables valuation allowances of €98 million were recognized and valuation are recognized based on this. allowances of €13 million were reversed.
BASF Report 2021 Consoli dated Financial Statements – Notes 249 19 Capital, reserves and retained earnings convertible bonds and/or bonds with warrants, or combinations of Subscribed capital these instruments, with or without maturity limitations up to a Authorized capital nominal value of €10 billion until May 11, 2022. The notional interest Subscribed capital remained unchanged year on year at in the share capital attributable to the BASF shares to be issued in €1,176 million and comprises 918,478,694 qualifying shares. BASF SE has only issued fully paid-up registered shares with no par connection with the debt instruments issued under this authorization value. There are no preferential voting rights or other restrictions. may not exceed 10% of the share capital. Capital reserves BASF SE does not hold any treasury shares. In this connection, the share capital was increased conditionally by Capital reserves include effects from BASF’s share program, In accordance with the resolution of the Annual Shareholders’ up to €117,565,184 by issuing a maximum of 91,847,800 new premiums from capital increases and consideration for warrants and Meeting on May 3, 2019, the Board of Executive Directors was registered BASF shares. The conditional capital increase will only be negative goodwill from the capital consolidation resulting from authorized, with the consent of the Supervisory Board, to increase, carried out to the extent to which holders of convertible bonds, or acquisitions of subsidiaries in exchange for the issue of BASF SE until May 2, 2024, on a one-off basis or in portions on a number of warrants attached to bonds with warrants issued, exercise their shares at par value. occasions, the company’s share capital by a total of up to €470 mil- conversion or option rights. This authorization had not been lion by issuing new shares against contributions in cash or in kind. In exercised as of the end of the 2021 fiscal year. Retained earnings principle, shareholders are entitled to a subscription right. However, the Board of Executive Directors is authorized, with the approval of Authorization of share buybacks The acquisition of shares in companies that BASF already controls the Supervisory Board, to exclude shareholders’ statutory subscrip- or that are included in the Consolidated Financial Statements as a tion rights in the cases specified in the authorizing resolution. The By way of a resolution of the Annual Shareholders’ Meeting of joint arrangement is treated as a transaction between shareholders, Board of Executive Directors is authorized, with the consent of the May 12, 2017, the Board of Executive Directors was authorized to as long as this does not lead to a change in the consolidation Supervisory Board, to lay down the further contents of the share buy back shares until May 11, 2022, in accordance with section 71(1) method. There were no material transactions of this type in 2021, as rights and the details of the execution of the capital increase. The no. 8 of the German Stock Corporation Act (AktG). The buyback in the previous year. total shares issued on the basis of the above authorization with the may not exceed 10% of the company’s share capital at the time the exclusion of the shareholders’ subscription right in the case of resolution was passed and can take place via the stock exchange, Retained earnings capital increases in return for contributions in cash or in kind must a public purchase offer addressed to all shareholders, or a public Million € not exceed 10% of the share capital at the time that this authoriza- invitation to the shareholders to submit sales offers. This authoriza- December 31, December 31, 2021 2020 tion comes into effect or – if this value is lower – at the time of its tion has not been exercised. Legal reserves 958 901 exercise. The proportionate amount of the share capital of those shares that are to be issued on the basis of conversion or option On January 4, 2022, the Board of Executive Directors approved a Other retained earnings 39,407 37,010 bonds granted during the term of this authorization under the share buyback program with a maximum volume of €3 billion to be Retained earnings 40,365 37,911 exclusion of the subscription right, must be credited against the implemented between January 2022 and December 2023. The aforementioned ceiling of 10%. This authorization has not been share buyback program is based on the previously described Legal reserves rose by €57 million in 2021 and by €70 million in exercised to date. authorization from May 12, 2017. A proposal to renew the 2020 due to reclassifications from retained earnings. authorization to buy back own shares is planned for the 2022 Annual Conditional capital Shareholders’ Meeting, which would authorize the continuation of Other retained earnings include, among other things, earnings the share buyback program already underway. generated in the past by companies included in the Consolidated By way of a resolution of the Annual Shareholders’ Meeting of Financial Statements. Because of the disposal of the pigments May 12, 2017, the Board of Executive Directors was authorized, business on June 30, 2021, the amount of €48 million for the with the approval of the Supervisory Board, to issue, on a one-off remeasurement of defined benefit plans, plus an additional €6 mil- basis or in portions on more than one occasion, bearer or registered lion resulting from the disposal of the operational companies held
BASF Report 2021 Consoli dated Financial Statements – Notes 250 by Solenis UK International Ltd., London, United Kingdom, which 20 Other comprehensive income Currency translation had been accounted for using the equity method until that date, was reclassified, in equity, from other comprehensive income to retained Accounting policies Differences resulting from currency translation increased equity by a earnings. Moreover, deferred taxes in the amount of –€18 million total of €2,205 million and decreased equity by €2,598 million in the arising from an adjustment in connection with the introduction of The expenses and income shown in other comprehensive income previous year. This included deferred taxes in the amount of IAS 19 were offset against retained earnings in equity. are divided into two categories: Items that will be recognized in the –€19 million in 2021 (2020: €19 million). At-equity investments income statement in the future (known as “recycling”) and items that accounted for €697 million (2020: –€1,125 million). The differences Payment of dividends will not be reclassified to the income statement in the future. The first resulted primarily from the appreciation of the U.S. dollar and the category includes gains and losses from currency translation, the Chinese renminbi relative to the euro in 2021. In accordance with the resolution of the Annual Shareholders’ measurement of certain securities classified as debt instruments, Meeting on April 29, 2021, BASF SE paid a dividend of €3.30 per and changes in the fair value of derivatives held to hedge future cash Furthermore, as a result of divestitures and other changes in the qualifying share from the retained profit of the 2020 fiscal year. With flows. Items that will not be reclassified to the income statement at scope of consolidation, €52 million after taxes was reclassified to 918,478,694 qualifying shares, this represented total dividends of a future date include effects from the remeasurement of defined the income statement in 2021 and €71 million after taxes in 2020. €3,030,979,690.20. The remaining €914,882,378.80 in retained benefit plans. profits was allocated to retained earnings. Cash flow hedges Remeasurement of defined benefit plans Changes in the fair value of derivatives designated in hedging Changes in the value of defined benefit plans led to an increase in relationships (cash flow hedges) adjusted for deferred taxes in the other comprehensive income of €2,709 million in 2021 and to a amount of –€10 million (2020: €24 million) reduced equity by a total decrease of €973 million in the previous year (after taxes in both of €329 million (2020: €108 million). In 2021, –€381 million (2020: years). Of that, €44 million was attributable to investments –€163 million) was attributable to the hedging of future cash flows at accounted for using the equity method in 2021 (2020: –€19 million). shareholdings accounted for using the equity method. Deferred taxes amounted to –€811 million in 2021 and to €422 mil- For more information on cash flow hedge accounting, see Note 26.5 from page 274 onward lion in 2020. Because of the disposal of the pigments business on June 30, 2021, the amount of €48 million for the remeasurement of defined benefit plans, plus an additional €6 million resulting from the disposal of the operational companies of Solenis UK International Ltd., London, United Kingdom, which had been accounted for using the equity method until that date, was reclassified, in equity, from other comprehensive income to retained earnings. Moreover, deferred taxes in the amount of –€18 million arising from an adjustment in connection with the introduction of IAS 19 were offset against retained earnings in equity. For more information on the remeasurement of defined benefit plans, see Note 22 from page 254 onward
BASF Report 2021 Consoli dated Financial Statements – Notes 251 21 Liabilities Financial indebtedness Million € Carrying amounts based on effective interest method Nominal value (million, Currency currency of issue)a Effective interest rate December 31, 2021 December 31, 2020 BASF SE Commercial paper USD 280 248 178 Commercial paper GBP – – 1,112 1.875% Bond 2013/2021 EUR 1,000 1.47% – 1,000 2.5% Bond 2017/2022 USD 500 2.65% 441 407 1.375% Bond 2018/2022 GBP 250 1.52% 297 277 2% Bond 2012/2022 EUR 1,250 1.93% 1,251 1,252 0.925% Bond 2017/2023 USD 850 0.83% 739 673 0.101% Bond 2020/2023 EUR 1,000 0.14% 999 999 0.875% Bond 2016/2023 GBP 250 1.06% 297 277 2.5% Bond 2014/2024 EUR 500 2.60% 499 499 1.750% Bond 2017/2025 GBP 300 1.87% 356 332 0.875% Bond 2018/2025 EUR 750 0.97% 748 747 3.675% Bond 2013/2025 NOK 1,450 3.70% 145 138 0.250% Bond 2020/2027 EUR 1,000 0.32% 996 996 0.875% Bond 2017/2027 EUR 1,000 1.04% 990 989 2.670% Bond 2017/2029 NOK 1,600 2.69% 160 153 0.875% Bond 2019/2029 EUR 250 1.01% 248 247 1.5% Bond 2018/2030 EUR 500 1.63% 495 495 1.5% Bond 2016/2031 EUR 200 1.58% 199 199 0.875% Bond 2016/2031 EUR 500 1.01% 494 493 2.37% Bond 2016/2031 HKD 1,300 2.37% 147 137 1.450% Bond 2017/2032 EUR 300 1.57% 297 296 a As of the balance sheet date Continued on next page
BASF Report 2021 Consoli dated Financial Statements – Notes 252 Continued from previous page Financial indebtedness Million € Carrying amounts based on effective interest method Nominal value (million, Currency currency of issue) Effective interest rate December 31, 2021 December 31, 2020 3% Bond 2013/2033 EUR 500 3.15% 493 493 2.875% Bond 2013/2033 EUR 200 2.96% 198 198 4% Bond 2018/2033 AUD 160 4.24% 100 98 1.625% Bond 2017/2037 EUR 750 1.73% 739 738 3.25% Bond 2013/2043 EUR 200 3.27% 200 199 1.025% Bond 2018/2048 JPY 10,000 1.03% 77 79 3.89% U.S. private placement series A 2013/2025 USD 250 3.92% 221 203 4.09% U.S. private placement series B 2013/2028 USD 700 4.11% 617 570 4.43% U.S. private placement series C 2013/2034 USD 300 4.45% 264 244 BASF Finance Europe N.V. 3.625% Bond 2018/2025 USD 200 3.69% 176 163 0.75% Bond 2016/2026 EUR 500 0.88% 497 496 Other bonds 110 102 Bonds and other liabilities to the capital market 13,737 15,479 Liabilities to credit institutions 3,447 3,735 Financial indebtedness 17,184 19,214
BASF Report 2021 Consoli dated Financial Statements – Notes 253 Breakdown of financial indebtedness by currency Maturities of financial indebtedness Unused credit lines Million € Million € Dec. 31, Dec. 31, Dec. 31, Dec. 31, BASF SE had committed and unused credit lines with variable 2021 2020 2021 2020 Euro 11,611 12,684 Following year 1 3,420 3,395 interest rates amounting to €6,000 million as of December 31, 2021, and €9,000 million as of December 31, 2020. U.S. dollar 3,255 3,166 Following year 2 2,208 2,310 Pound sterling 950 1,998 Following year 3 1,280 2,121 Norwegian krone 305 291 Following year 4 1,892 1,351 Chinese renminbi 168 250 Following year 5 1,177 1,787 Indian rupee 154 86 Following year 6 and maturities beyond this year 7,207 8,250 Hong Kong dollar 147 137 Total 17,184 19,214 Japanese yen 119 136 Australian dollar 100 98 Other bonds Argentinian peso 99 66 Turkish lira 63 34 Other bonds consisted primarily of a bond issued by BASF Corpo- Brazilian real 61 62 ration that was used to finance investments in the United States. Thai baht 55 27 Both the nominal interest rate and effective interest rate of this bond were 6.95% in 2021. Its remaining term to maturity is 78 months. Indonesian rupiah 45 18 South African rand 33 95 Liabilities to credit institutions Ukrainian hryvnia 9 38 Other currencies 10 28 Liabilities to credit institutions decreased from €3,735 million as of Total 17,184 19,214 December 31, 2020 to €3,447 million as of December 31, 2021. The weighted average interest rate on loans amounted to 2.7% in 2021, compared with 2.1% in 2020.
BASF Report 2021 Consoli dated Financial Statements – Notes 254 Other liabilities 22 Provisions for pensions and similar obligations Million € December 31, 2021 December 31, 2020 Accounting policies Noncurrent Current Noncurrent Current Derivatives with negative fair values 131 438 284 674 In addition to state pension plans, most employees are granted Liabilities from leases 1,078 334 1,026 334 company pension benefits from either defined contribution or Loan and interest liabilities 35 505 37 583 defined benefit plans. Benefits generally depend on years of service, Advances received on orders – 949 – 679 contributions or compensation, and take into consideration the legal framework of labor, tax and social security laws of the countries Miscellaneous liabilities 26 753 41 464 where the companies are located. To limit the risks of changing Other liabilities that qualify as financial instruments 1,270 2,978 1,388 2,734 financial market conditions as well as demographic developments, Liabilities related to social security 63 79 55 76 employees have, for a number of years now, been almost exclusively Employee liabilities 22 294 22 238 offered defined contribution plans for future years of service. Liabilities from precious metal trading positions – 201 – 200 Contract liabilities 201 40 210 52 The Group Pension Committee monitors the risks of all pension plans of the Group with regard to the financing of pension Deferred income 17 32 7 26 commitments and the portfolio structure of existing plan assets. The Miscellaneous liabilities 28 56 29 114 organization, responsibilities, strategy, implementation and reporting Other liabilities that do not qualify as financial instruments 330 701 323 706 requirements are documented for the units involved. Other liabilities 1,600 3,679 1,711 3,440 The accounting policies presented in the following relate to defined benefit pension obligations. Other liabilities Carrying amounts of assets used to secure liabilities Million € Provisions for pensions are calculated on an actuarial basis in Contract liabilities include mainly customer payments entitling Dec. 31, Dec. 31, accordance with the projected unit credit method. Assumptions 2021 2020 them to access licenses over an agreed period of time. The majority To secure relating to the following valuation parameters, among others are of existing contracts have terms of up to six years. Of the contract used: future developments in compensation, pensions and inflation, liabilities reported as of December 31, 2021, €40 million are liabilities to credit institutions 64 13 employee turnover, and the life expectancy of beneficiaries. expected to be recognized as revenue in 2022. accounts payable, trade 11 2 Obligations are discounted based on the market yields on high- For more information on financial risks and derivative instruments, see Note 26 from page 263 onward other liabilities 170 264 quality corporate fixed-rate bonds. For more information on liabilities arising from leases, see Note 16 from page 244 onward Carrying amounts of assets used 245 279 Similar obligations, especially those arising from commitments by Liabilities to credit institutions were secured primarily with North American Group companies to pay the healthcare costs and registered land charges. Secured other liabilities relate primarily to life insurance premiums of retired staff and their dependents, are derivatives with negative fair values that are secured with other reported under provisions for similar obligations. receivables and miscellaneous assets.
BASF Report 2021 Consoli dated Financial Statements – Notes 255 Actuarial reports are used to calculate the amount of pension The strategy of the BASF Group with regard to financing pension by BASF Pensionstreuhand e.V.; at German Group companies, provisions. commitments takes into account country-specific supervisory and these benefits are financed primarily via pension provisions. The tax regulations. benefits are largely based on cash balance plans. Furthermore, Actuarial gains and losses from changes in estimates relating to the employees are given the option of participating in various deferred actuarial assumptions used to calculate defined benefit obligations, In some countries, pension benefits were granted for which the compensation schemes. the difference between standardized and actual returns on plan employer has a subsidiary liability. Pension benefits in a number of assets, as well as the effects of the asset ceiling are recognized countries include minimum interest guarantees to a limited extent. If United States directly in equity as other comprehensive income. the pension fund cannot generate the income needed to provide the Employees are granted benefits based on defined contribution minimum guarantee, this must be provided by the employer under plans. Economic and legal environment of the plans the subsidiary liability. To the extent that recourse to the employer is unlikely based on the structure and execution of the pension benefits Effective 2010, the existing defined benefit plans were closed to In some countries – especially in Germany, in the United States, in as well as the asset situation of the pension fund, these plans are further increases in benefits based on future years of service, and the United Kingdom and in Switzerland – there are pension treated as defined contribution plans. benefits earned in the past were frozen. There is no entitlement to obligations subject to government supervision or similar legal pension adjustments to compensate for cost-of-living increases. restrictions. For example, there are minimum funding requirements Description of the defined benefit plans to cover pension obligations, which are based on actuarial The legal and regulatory frameworks governing the plans are based assumptions that differ from those pursuant to IAS 19. Furthermore, The following section describes the typical plan structure in the on the U.S. Employee Retirement Income Security Act (ERISA), there are qualitative and quantitative restrictions on allocating plan individual countries. Different arrangements may exist, in particular which requires the plan sponsor to ensure a minimum funding level. assets to certain asset categories. This could result in annual due to the assumption of plans as part of acquisitions; however, Any employer contributions necessary to meet the minimum funding fluctuations in employer contributions, financing measures and the these do not have any material impact on the description of plans in level are based on the results of an actuarial valuation. Furthermore, assumption of obligations in favor of the pension funds to comply the individual countries. there are unfunded pension plans that are not subject to ERISA with regulatory requirements. requirements. Germany The obligations and the plan assets used to fund the obligations are For BASF SE and German Group companies, a basic level of Additional similar obligations arise from plans that assume the exposed to demographic, legal and economic risks. Economic risks benefits is provided by BASF Pensionskasse VVaG, a legally healthcare costs and life insurance premiums of retired employees are primarily due to unforeseen developments on commodity and independent plan, which is financed by employer and employee and their dependents. Such plans have been closed to new entrants capital markets. They affect, for example, pension adjustments contributions as well as the return on plan assets. BASF SE ensures since 2007. In addition, the amount of the benefits for such plans based on the level of inflation in Germany and in the United Kingdom, the necessary contributions to adequately finance the benefits has been frozen. as well as the impact of discount rates on the amount of the defined promised by BASF Pensionskasse VVaG. Some of the benefits benefit obligation. In previous years, measures taken to close plans financed via BASF Pensionskasse VVaG are subject to adjustments with defined benefits for future service, especially benefits based on that must be borne by its member companies to the extent that final pay promises and the assumption of healthcare costs for former these cannot be borne by BASF Pensionskasse VVaG due to the employees, led to a reduction in risk with regard to future benefit regulations imposed by the German supervisory authority. In 2004, levels. the basic benefit plan was closed for newly hired employees at German BASF companies and replaced by a defined contribution plan. A new defined contribution plan was introduced as of July 1, 2021, for new hires in the German BASF companies. At BASF SE, occupational pension promises that exceed the basic level of benefits are financed under a contractual trust arrangement
BASF Report 2021 Consoli dated Financial Statements – Notes 256 Switzerland Actuarial assumptions The valuation of the defined benefit obligation is generally performed The employees of the BASF Group in Switzerland receive a company using the most recent actuarial mortality tables as of December 31 pension, which is financed through a pension fund by employer and The valuation of the defined benefit obligation is based on the of the respective business year, which in Germany and the United employee contributions as well as the return on plan assets. The following key assumptions: States are derived from the BASF Group population and were last pension plans are accounted for as defined benefit plans, as the updated in 2019 for the pension obligations in Germany and in 2018 obligatory minimum pension guaranteed by law under the Swiss Assumptions used to determine the defined benefit obligation as of for the pension obligations in the United States. The actuarial Pension Fund Act (BVG) is included in the scheme. All benefits vest December 31 mortality tables for the pension obligations in Switzerland were immediately. According to government regulations, the employer is United adjusted in 2021. obligated to make contributions, so that the pension funds are able Germany United States Switzerland Kingdom to grant the minimum benefits guaranteed by law. The pension 2021 2020 2021 2020 2021 2020 2021 2020 Actuarial mortality tables (significant countries) as of December 31, 2021 funds are managed by boards, where employer and employees are Discount rate 1.10 0.70 2.70 2.30 0.40 0.10 2.00 1.50 Germany Heubeck Richttafeln 2018G (modified) equally represented, which steer and monitor the benefit plans and Projected pension asset allocation. increase 1.60 1.50 – – – – 3.50 3.10 United States RP-2018 (modified) with MP-2018 generational projection United Kingdom Switzerland BVG 2020 generational with CMI 2018 mortality improvement Employees are granted benefits based on a defined contribution Assumptions used to determine expenses for pension benefits in the S2PxA (standard actuarial mortality tables for plan. respective business year United Kingdom self-administered plans (SAPS)) United The BASF Group also maintains defined benefit plans in the United Germany United States Switzerland Kingdom Kingdom, which have been closed for further increases based on 2021 2020 2021 2020 2021 2020 2021 2020 future years of service. Adjustments to compensate for increases in Discount rate 0.70 1.10 2.30 3.10 0.10 0.20 1.50 2.20 the cost of living until the beginning of retirement are legally required Projected pension for beneficiaries of defined benefit plans. increase 1.50 1.50 – – – – 3.10 3.00 The financing of the pension plans is determined by the provisions The assumptions used to ascertain the defined benefit obligation as of the regulatory authority for pensions and the relevant social and of December 31 are used in the following year to determine the labor law requirements. The defined benefit plans are administered expenses for pension plans. by a trust company, whose Board of Trustees, according to the trustee agreement and law, represents the interests of the A Group-wide, uniform procedure is used to determine the discount beneficiaries and ensures that the benefits can be paid in the future. rates applied for valuation of material pension obligations of the The required funding is determined using technical valuations BASF Group. Accordingly, the discount rates were derived from the according to local regulations every three years. yields on corporate bonds in the respective currency zones with an issue volume of more than 100 million units of the respective Other countries currency with a minimum rating of AA– to AA+ from at least one of For Group companies in other countries, defined benefits are the following three rating agencies: Fitch, Moody’s, or Standard & covered in some cases by pension provisions, but mainly by external Poor’s. insurance companies or pension funds.
BASF Report 2021 Consoli dated Financial Statements – Notes 257 Sensitivity analysis Explanation of the amounts in the statement of income and Development of defined benefit obligations balance sheet Million € A change in the material actuarial assumptions would have the 2021 2020 following effects on the defined benefit obligation: Composition of expenses for pension benefits Defined benefit obligation as of January 1 29,840 28,423 Million € Current service cost 419 419 Sensitivity of the defined benefit obligation as of December 31 2021 2020 Past service cost 1 6 Million € Expenses for defined benefit plans 423 430 Increase by 0.5 percentage Decrease by 0.5 percentage Plan settlements –21 –60 points points Expenses for defined contribution plans 308 306 Interest cost 276 395 2021 2020 2021 2020 Expenses for pension benefits (recognized in income 731 736 from operations) Benefits paid –1,084 –1,095 Discount rate –2,115 –2,221 2,420 2,553 Employee contributions 37 41 Projected pension 1,533 1,666 –1,267 –1,411 Net interest expense from underfunded pension plans and Actuarial gains/losses –1,496 2,131 increase similar obligations 85 108 of which adjustments relating to financial assumptions –1,505 2,106 Net interest income from overfunded pension plans –3 0 adjustments relating to demographic An alternative valuation of the defined benefit obligation was Expenses for pension benefits (recognized in the assumptions –117 8 financial result) 82 108 performed to determine how changes in the underlying assumptions experience adjustments 126 17 influence the amount of the defined benefit obligation. A linear Effects from acquisitions and divestitures 171 54 extrapolation of these amounts based on alternative changes in the The interest on the net defined benefit liability at the beginning of the Other changes –19 –4 assumptions as well as an addition of combined changes in the year is recognized in the financial result. This is the difference individual assumptions is not possible. between the interest cost of the defined benefit obligation and the Currency effects 505 –470 standardized return on plan assets as well as the interest cost for Defined benefit obligation as of December 31 28,629 29,840 the asset ceiling. The expected contribution payments and benefits paid over the course of the fiscal year are taken into account when As of December 31, 2021, the weighted average duration of the determining net interest. defined benefit obligation amounted to 16.6 years (previous year: 16.6 years). Net interest expense of the respective fiscal year is based on the discount rate and the defined benefit obligation at the beginning of BASF tendered and reissued the mandate for the actuarial valuation the year. of indirect obligations at BASF Pensionskasse VVaG and of direct obligations of the German group, effective as of May 1, 2021. In this context, some of the previous assumptions and valuation methods were modified. This led to actuarial losses totaling €8 million, which were included in adjustments relating to financial assumptions.
BASF Report 2021 Consoli dated Financial Statements – Notes 258 Development of plan assets Employer contributions were €151 million in 2021. In 2020, Development of net defined benefit liability Million € BASF’s employer contributions totaled €615 million, including Million € 2021 2020 special contributions to BASF Pensionstreuhand e.V. in the amount 2021 2020 Plan assets as of January 1 21,400 20,863 of €401 million and €58 million to American plan assets. Net defined benefit liability as of January 1 –8,440 –7,560 Standardized return on plan assets 194 286 Current service cost –419 –419 Deviation between actual and standardized return on plan 1,935 765 BASF’s remaining obligations and the proportional plan assets of Past service cost –1 –6 assets benefit recipients in Switzerland relating to the divestiture of the Plan settlements 0 0 Employer contributions 151 615 pigments business are presented in effects from acquisitions and Interest cost –276 –395 Employee contributions 37 41 divestitures. This item also includes the amount of €43 million, which was deposited into Swiss plan assets in the same context. Standardized return on plan assets 194 286 Benefits paid –952 –769 Deviation between actual and standardized return on plan 1,935 765 Effects from acquisitions and divestitures 216 2 assets Through continuous monitoring of financing requirements of its Past service cost – – pension plans, BASF strives to achieve the necessary yields to fill Actuarial gains/losses of the defined benefit obligation 1,496 –2,131 Plan settlements –21 –60 financing gaps over the course of time. Company contributions for Benefits paid by unfunded plans 132 326 Other changes –264 –11 2022 are currently expected to be around €130 million. Employer contributions 151 615 Currency effects 434 –332 Effects from acquisitions and divestitures 45 –52 Plan assets as of December 31 23,130 21,400 Other changes –245 –7 Currency effects –71 138 The standardized return on plan assets is calculated by multiplying Net defined benefit liability as of December 31 –5,499 –8,440 plan assets at the beginning of the year with the discount rate used of which defined benefit assets 661 126 for existing defined benefit obligations at the beginning of the year, provisions for pensions and similar obligations 6,160 8,566 taking into account benefit and contribution payments to be made during the year. Regional allocation of defined benefit plans as of December 31 BASF SE made pension payments which are covered by the assets Million € of BASF Pensionstreuhand e.V. BASF Pensionstreuhand e.V. Pension Net defined benefit obligations Plan assets liability reimbursed BASF SE in 2021 with €250 million in pension payments 2021 2020 2021 2020 2021 2020 relating to 2020. This transaction is presented in other changes in plan assets. Germany 20,400 21,535 15,498 14,426 –4,902 –7,109 United States 3,563 3,596 2,610 2,404 –953 –1,192 Effects from plan settlements resulted in 2021 primarily from the Switzerland 1,812 1,816 2,212 1,851 400 35 transfer of benefit entitlements and the corresponding assets from United Kingdom 1,967 1,986 2,178 2,026 211 40 the pension plan in Canada to an external insurer. Other 887 907 632 693 –255 –214 Total 28,629 29,840 23,130 21,400 –5,499 –8,440
BASF Report 2021 Consoli dated Financial Statements – Notes 259 Explanations regarding plan assets the creditworthiness of issuers, the plan asset allocation may be The funding of the plans was as follows: adjusted in the case of a revised market assessment. Alternative The target asset allocation has been defined by using asset liability investments largely comprise investments in private and Current funding situation of the pension plans as of December 31 studies and is reviewed regularly. Accordingly, plan assets are infrastructure equity, absolute return funds and senior secured Million € aligned with the long-term development of the obligations, taking loans. 2021 2020 into consideration the risks associated with the specific asset Defined Defined benefit Pension benefit Pension classes and the regulations relating to the investment of plan assets. Almost all of the equities are priced on active markets. The category obligation assets obligation assets The existing portfolio structure is based on the target asset debt instruments includes promissory notes and debentures Unfunded pension plans 2,121 – 1,840 – allocation. In addition, current market assessments are taken into (Pfandbriefe) acquired through private placements with a market Funded pension plans 26,508 23,130 28,000 21,400 consideration. In order to mitigate risks and maximize returns, a value in the amount of €188 million as of December 31, 2021, and widely spread global portfolio of individual assets is held. €110 million as of December 31, 2020. For such securities, Total 28,629 23,130 29,840 21,400 especially those held by domestic pension plans, there is no active Liability-driven investment (LDI) techniques, such as hedging the risk market. There is also no fungible market price for the additional Defined contribution plans and government pensions of changes in interest rates and inflation, are used in some pension amount of €387 million, especially in the category of alternative plans, especially for U.K. and U.S. plans. investments and real estate. The capital market compensates for The contributions to defined contribution plans recognized in this lack of fungibility with yield premiums depending on the maturity. income from operations amounted to €308 million in 2021 and Structure of plan assets €306 million in 2020. % Plan assets as of the balance sheet date contained securities issued 2021 2020 by BASF Group companies with a market value of €0 million in 2021 Contributions to government pension plans were €578 million in Equities 26 28 and €1 million in 2020. The market value of the properties of legally 2021 and €557 million in 2020. Debt instruments 45 47 independent pension funds rented to BASF Group companies of which for government debtors 18 19 remained unchanged from the previous year at €112 million. for other debtors 27 28 Real estate 6 5 Since 2010, an agreement has existed between BASF SE and BASF Pensionskasse VVaG on the granting of profit participation Alternative investments 21 17 capital with a nominal value of €80 million to strengthen the financing Cash and cash equivalents 2 3 of the BASF Pensionskasse VVaG. The existing profit participation Total 100 100 capital was paid back to BASF SE in 2021. To enable Pensions- kasse VVaG to meet future regulatory solvency requirements and The asset class debt instruments comprises promissory notes and strengthen its risk-bearing capacity, BASF SE temporarily provided debentures (Pfandbriefe) as well as corporate and government the pension fund with capital in the form of a retrospective initial fund bonds. Government bonds primarily relate to bonds from countries loan with a nominal value of €220 million in 2021. The pension fund with very high credit ratings, such as the United States, the United utilized €80 million of that amount in 2021. Furthermore, BASF Pen- Kingdom, Germany and Switzerland. Government bonds from sionstreuhand e.V. reimbursed BASF SE in 2021 with €250 million in emerging countries are also held to a limited extent. Corporate pension payments relating to 2020. bonds mainly comprise bonds from creditworthy debtors, although particular high-yield bonds are also held to a limited extent. In connection with the continuous monitoring of default risk based on a given risk budget and on the observation of the development of
BASF Report 2021 Consoli dated Financial Statements – Notes 260 23 Other provisions Provisions for restructuring measures include severance payments The probable amount required to settle noncurrent provisions is to departing employees or similar personnel expenses as well as discounted if the effect of discounting is material. In this case, the Accounting policies expected costs for site closures, including the costs for demolition provision is recognized at present value. Assumptions must be and similar measures. Provisions are recognized for these expenses made in determining the discount rate (2021: 1.25%; 2020: 1.5%) Other provisions are recognized when there is a present obligation when the relevant measures have been planned and announced by used for calculating noncurrent provisions. Financing costs related as a result of a past event and when there is a probable outflow of management. to unwinding the discount of provisions in subsequent periods are resources whose amount can be reliably estimated. Provisions are shown in other financial result. recognized at the probable settlement value. Provisions for employee obligations primarily consist of variable compensation including associated social security contributions, as Other provisions Provisions for environmental protection and remediation costs well as obligations for granting long-service bonuses. The latter are Million € are recognized for expected costs for rehabilitating contaminated predominantly calculated based on actuarial principles. December 31, 2021 December 31, 2020 sites, recultivating landfills, removal of environmental contamination Of which Of which current current at existing production or storage sites and similar measures. Provisions for obligations from sales and purchase contracts largely comprise obligations arising from rebates granted and other Restoration obligations 158 21 148 21 In addition, other provisions also cover expected costs for price discounts in the Agricultural Solutions segment, warranties Environmental protection and 926 94 693 114 remediation costs restoration obligations for dismantling existing plants and and product liabilities, sales commissions and expected losses on buildings. If BASF is the only responsible party that can be identified, contracts. Employee obligations 2,368 1,907 1,174 754 the provision covers the entire expected obligation. At sites operated Obligations from sales and 1,423 1,379 1,134 1,114 purchase contracts together with one or more partners, the provision generally covers Provisions for litigation, damage claims, warranties and similar only BASF’s share of the expected obligation. The amount of the obligations contain anticipated expenses from lawsuits in which Restructuring measures 279 229 414 371 provision is determined based on the available technical information BASF is the defendant party, as well as obligations under damage Litigation, damage claims, warranties and similar 79 26 205 161 on the site, the technology used, legal regulations, and official claims against BASF and fines. In order to determine the amount of obligations requirements. The calculation accounts for expected significant the provisions, the company takes into consideration the facts Other 486 279 541 290 changes in obligations. related to each case, the size of the claim, compensation awarded Total 5,717 3,935 4,309 2,825 in similar cases and independent expert advice as well as assumptions regarding the probability of a successful claim and the range of possible claims. Actual costs can deviate from these estimates. For more information, see Note 24 on page 262
BASF Report 2021 Consoli dated Financial Statements – Notes 261 The increase in provisions for employee obligations was mainly The following table shows the development of other provisions by divestitures, currency effects and the reclassification of obligations attributable to higher accruals for variable compensation category. Other changes include reclassifications to disposal to liabilities when the amount and timing of these obligations become components. groups, changes in the scope of consolidation, acquisitions, known. The increase in provisions for obligations from sales and purchase contracts resulted from higher accruals for rebate programs. Development of other provisions in 2021 Million € The increase in provisions for environmental protection and January 1, Unwinding of December 31, 2021 Additions discount Utilization Releases Other changes 2021 remediation costs resulted primarily from additions for contamina- Restoration obligations 148 26 2 –8 –1 –9 158 tion at several discontinued sites in North America. Environmental protection and remediation 693 268 3 –64 –8 34 926 costs Other includes interest on noncurrent tax provisions. Employee obligations 1,174 1,943 1 –687 –60 –2 2,368 Obligations from sales and purchase contracts 1,134 1,142 – –894 –83 125 1,423 Restructuring measures 414 90 – –93 –167 34 279 Litigation, damage claims, warranties and 205 29 – –128 –37 9 79 similar obligations Other 541 184 – –139 –66 –37 486 Total 4,309 3,681 7 –2,013 –421 154 5,717
BASF Report 2021 Consoli dated Financial Statements – Notes 262 24 Risks from litigation and claims At this time, BASF cannot predict the outcomes of resolving these matters or what potential actions may be taken by regulatory BASF Corporation has potential liability under the Comprehensive agencies. An adverse outcome in any one or more of these matters Response, Compensation and Liability Act of 1980, as amended, could be material to BASF’s financial results. and related state laws for investigation and cleanup at certain sites. The Lower Passaic River Study Area (LPRSA) is one such site Furthermore, BASF SE and its affiliated companies are defendants comprising the lower 17 miles of the Passaic River in New Jersey. in or parties to a variety of legal or regulatory proceedings on a BASF Corporation and more than 60 other companies (collectively, recurring basis. To our current knowledge, none of these proceed- the Lower Passaic River Study Area Cooperating Parties Group or ings will have a material effect on the economic situation of BASF. CPG) agreed to complete a remedial investigation / feasibility study (RI/FS) of the LPRSA. In 2016, the United States Environmental Protection Agency (USEPA) selected a final remedy for the lower eight miles of the LPRSA. A decision from USEPA on a targeted approach for the upper portion of the LPRSA was issued on September 30, 2021. BASF Corporation established a provision covering BASF’s currently estimated share of the remediation costs. Since August 2019, BASF Corporation has been served in various U.S. federal and state lawsuits alleging property and resource damages and personal injuries from possible exposure to per- and polyflouroalkyl substances (PFAS). In December 2018, a multi- district litigation (MDL) was created to coordinate claims brought against manufacturers, distributors, and suppliers of Aqueous Film Forming Foam (AFFF) in particular, which plaintiffs allege contains toxic levels of certain PFAS compounds including perfluorooctanoic acid (PFOA) and perfluorooctane sulfonate (PFOS). Plaintiffs typically allege that exposure to AFFF has caused loss of use and enjoyment of property, diminished property value, remediation costs, and personal injuries including various types of cancers. The complaints name BASF as a defendant in connection with its 2009 acquisition of Ciba Specialty Chemicals Inc. and the legacy Ciba/BASF Lodyne fluorochemical product lines. BASF has been named in over 1,200 suits as of January 2022 and is defending all litigation.
BASF Report 2021 Consoli dated Financial Statements – Notes 263 25 Other financial obligations Obligations arising from purchase contracts 26 Supplementary information on financial instruments The figures listed below are stated at nominal value: Obligations from purchase contracts resulted primarily from long-term purchase obligations for raw materials as well as supply 26.1 Accounting policies Other financial obligations agreements for renewable energy. The increase is mainly due to Million € long-term energy supply agreements concluded in 2021, including Financial assets and financial liabilities are recognized in the Dec. 31, Dec. 31, about €3.5 billion for green energy from the Hollandse Kust Zuid consolidated balance sheet when the BASF Group becomes a 2021 2020 Bills of exchange 3 2 wind farm. party to a financial instrument. Financial assets are derecognized For more information on long-term energy supply agreements, see the chapter on Energy and climate when BASF no longer has a contractual right to the cash flows from Guarantees 383 347 protection in the Management’s Report from page 126 onward the financial asset or when the financial asset is transferred together Warranties 58 79 Firm purchase obligations as of December 31, 2021, were as with all material risks and rewards of ownership and BASF does not Collateral granted on behalf of third-party liabilities 1 – follows: have control of the financial asset after it has been transferred. For Initiated investment projects 4,761 3,921 example, receivables are derecognized when they are definitively of which purchase commitments 1,481 1,052 Obligations arising from purchase contracts found to be uncollectible such as in the event of concluded Million € insolvency proceedings. Financial liabilities are derecognized when for the purchase of intangible assets 10 15 Dec. 31, Dec. 31, the contractual obligations expire, are discharged or cancelled. Payment and loan commitments and other financial 2021 2020 obligations 263 75 Following year 1 9,686 8,003 Regular-way purchases and sales of financial instruments are accounted for using the settlement date; in precious metal trading, Following year 2 4,963 5,347 the trade date is used. BASF SE provides a guarantee to Abu Dhabi National Oil Corpora- Following year 3 1,832 3,419 tion covering all obligations of Wintershall Dea Middle East GmbH Following year 4 1,716 1,317 The fair value of a financial instrument is the price that would be related to the Ghasha concession in the United Arab Emirates. Following year 5 1,720 1,238 received to sell an asset or paid to transfer a liability in an orderly Furthermore, BASF SE assumed guarantees to the Danish Energy Following year 6 and maturities beyond this year 11,823 4,165 transaction between market participants at the measurement date. Agency covering all obligations of Wintershall Dea Inter- Total 31,741 23,489 If pricing on an active market is available, for example in the form of national GmbH and Wintershall Noordzee B.V. related to licenses for exchange prices, these are used as the basis for the measurement. exploration and production of hydrocarbons in the Danish Otherwise, the measurement is based on either internal measure- concession area. The guarantees do not stipulate a maximum ment models using current market parameters or external measure- amount. The risk of a claim being exercised against the guarantees ments, for example, from banks. These internal measurements rely is classified as low. In addition, guarantees by BASF SE existed until predominantly on the net present value method and option pricing January 12, 2022, for restoration obligations of Wintershall Dea models. These models incorporate, for example, expected future Norge AS for various oil and gas facilities acquired from Equinor. cash flows as well as discount factors adjusted for term and, potentially, risk. Depending on the availability of market parameters, The rise in obligations from initiated investment projects is mainly BASF assigns financial instruments’ market values one of the three attributable to large-scale projects which began in 2021. levels of the fair value hierarchy pursuant to IFRS 13. Reassignment to a different level during a fiscal year is only carried out if the availability of observable market parameters for identical or similar items changes.
BASF Report 2021 Consoli dated Financial Statements – Notes 264 The classification and measurement of financial assets is based on Impairments are recognized for expected credit losses in both impairments. Bank guarantees and letters of credit are used to an the one hand on the cash flow condition (the “solely payments of initial and subsequent measurement, even before the occurrence immaterial extent. Expected credit losses and individual principle and interest” criterion), that is, the contractual cash flow of any default event. Counterparties are generally considered to impairments are only calculated for those receivables that are not characteristics of an individual financial asset. On the other hand, it default when they become insolvent, become a debtor in a covered by insurance or other collateral. Impairments on also depends on the business model used for managing financial creditor protection program or are in a finance-related legal receivables whose insurance includes a deductible are not asset portfolios. Based on these two criteria, BASF uses the dispute with BASF, or more than half of BASF’s receivables recognized in excess of the amount of the deductible. following measurement categories for financial assets: portfolio with them is more than 90 days overdue. In these cases, A decrease in impairment due, for example, to a reduction in the – Financial assets at fair value through profit or loss include all individual impairments are recognized for the financial assets credit risk of a counterparty or an objective event occurring after financial assets whose cash flows are not solely payments of measured at amortized cost that are then considered to be credit the impairment is recorded in profit or loss. Reversals of principal and interest in accordance with the cash flow condition impaired. impairments may not exceed amortized cost, less any expected established in IFRS 9. At BASF, derivatives, for example, are The extent of expected credit losses is determined based on the future credit losses. allocated to this measurement category. In general, BASF does credit risk of a financial asset, as well as any changes to this – Financial assets at fair value through other comprehensive not exercise the fair value option in IFRS 9, which permits the credit risk: If the credit risk of a financial asset has increased income include all assets with contractual terms that give rise to allocation of financial instruments not to be measured at fair value significantly since initial recognition, expected credit losses are cash flows on specified dates that are solely payments of principal through profit or loss on the basis of the cash flow condition or the generally recognized over the lifetime of the asset. If, however, the and interest on the principal amount outstanding, in accordance business model criterion to the above category under certain credit risk has not increased significantly in this period, impair- with the cash flow condition in IFRS 9. Furthermore, the assets in circumstances. ments are generally only recognized as 12-month expected this measurement category may not just be held with the intention – Financial assets measured at amortized cost include all assets credit losses. By contrast, under the simplified approach for of collecting the expected contractual cash flows over their term, with contractual terms that give rise to cash flows on specific determining expected credit losses permitted by IFRS 9, but also generating cash flows from their sale. At BASF, certain dates, provided that these cash flows are solely payments of impairments for receivables such as lease receivables and trade securities that are reported as other financial assets or marketable principal and interest on the principal amount outstanding in accounts receivable always cover the lifetime expected credit securities are allocated to this category. BASF does not exercise accordance with the cash flow condition in IFRS 9, to the extent losses of the receivable concerned. the option to subsequently measure equity instruments through that the asset is held with the intention of collecting the expected At BASF, the credit risk of a financial asset is assessed using both other comprehensive income. contractual cash flows over its term. At BASF, this measurement internal information and external rating information on the Assets measured at fair value through other comprehensive category includes trade accounts receivable, as well as receivables respective counterparty. A significant increase in the counterparty’ s income are initially measured at fair value, which usually reported under other receivables and miscellaneous assets and credit risk is assumed if its rating is lowered by a certain number corresponds to the transaction price of the securities allocated to certain securities. of notches. It is generally assumed that the credit risk for a this category at the time of acquisition. Subsequent measurement Initial measurement of these assets is generally at fair value, counterparty with a high credit rating will not have increased is likewise at fair value. Changes in the fair value are recognized in which usually corresponds to the transaction price at the time of significantly. other comprehensive income and reclassified to the statement of acquisition or, in the case of trade accounts receivable, to the Regional and, in certain circumstances, industry-specific factors income when the asset is disposed of. transaction price pursuant to IFRS 15. Subsequent measurement and expectations are taken into account when assessing the Impairments on financial assets measured at fair value through effects are recognized in income using the effective interest extent of impairment as part of the calculation of expected credit other comprehensive income are calculated in the same way as method. losses and individual impairments. In addition, BASF uses internal impairments on financial assets measured at amortized cost and and external ratings and the assessments of debt collection recognized in profit or loss. agencies and credit insurers, when available. Individual impairments are also based on experience relating to customer solvency and customer-specific risks. Factors such as credit insurance, which covers a portion of receivables measured at amortized cost, are likewise considered when calculating
BASF Report 2021 Consoli dated Financial Statements – Notes 265 The following measurement categories are used for financial In cash flow hedges, future cash flows and the related income and liabilities: expenses are hedged against the risk of changes in fair value. To this – Financial liabilities measured at amortized cost generally end, future underlying transactions and the corresponding hedging include all financial liabilities, provided these do not represent instruments are designated in a cash flow hedge accounting derivatives. They are generally measured at fair value at the time relationship for accounting purposes. The effective portion of the of initial recognition, which usually corresponds to the value of the change in fair value of the hedging instrument, which often meets consideration received. Subsequent measurement is recognized the definition of a derivative, and the cost of hedging are recognized in profit or loss at amortized cost using the effective interest directly in equity under other comprehensive income over the term method. At BASF, for example, bonds and liabilities to banks of the hedge, taking deferred taxes into account. The ineffective reported under financial indebtedness are measured at amortized portion is recognized immediately in the income statement. In the cost. case of future transactions that lead to recognition of a nonfinancial – Financial liabilities at fair value through profit or loss contain asset or a nonfinancial liability, the cumulative fair value changes of derivative financial liabilities. These are likewise measured at the the hedge in equity are generally charged against the cost of the value of the consideration received as the fair value of the liability hedged item on its initial recognition. For hedges based on financial on the date of initial recognition. Fair value is also applied as a assets, financial liabilities or future transactions, cumulative fair value measurement basis for these liabilities in subsequent changes of the hedges are transferred from equity to the income measurement. The option to subsequently measure non- derivative statement in the reporting period in which the hedged item is financial liabilities at fair value is not exercised. recognized in the income statement. The maturity of the hedging Derivative financial instruments can be embedded within other instrument is aligned with the effective date of the future transaction. contracts, creating a hybrid financial instrument. If IFRS policies require separation, the embedded derivative is accounted for When fair value hedge accounting is used, the asset or liability separately from its host contract and measured at fair value. If recognized is hedged against the risk of a change in fair value. The IFRS 9 does not provide for separation, the hybrid instrument is hedging instruments used, which often take the form of a derivative, accounted for at fair value in its entirety. are measured at fair value and changes in fair value are recognized in the statement of income. The carrying amounts of the assets or Financial guarantees of the BASF Group are contracts that require liabilities designated as the underlying transaction are also measured compensation payments to be made to the guarantee holder if a at fair value through the statement of income. debtor fails to make payment when due under the terms of a transaction entered into with the holder of the guarantee. Financial guarantees issued by BASF are measured at fair value upon initial recognition. In subsequent periods, these financial guarantees are carried at the higher of amortized cost or the best estimate of the present obligation as of the reporting date.
BASF Report 2021 Consoli dated Financial Statements – Notes 266 26.2 Financial risks €78 million applying 10% appreciation to the functional currency). ber 31, 2021, a change in interest rates would not have had an effect This only refers to transactions in U.S. dollars. on shareholders’ equity. There were also no interest derivatives Market risks designated in a hedge accounting relationship as of Decem- Exposure and sensitivity by currency ber 31, 2020. Foreign currency risks: Changes in exchange rates could lead to Million € losses in the value of financial instruments and adverse changes in December 31, 2021 December 31, 2020 Carrying amounts of nonderivative interest-bearing financial instruments future cash flows from planned transactions. Foreign currency risks Exposure Sensitivity Exposure Sensitivity Million € from financial instruments result from the translation at the closing +5% +10% +5% +10% December 31, 2021 December 31, 2020 rate of financial receivables, loans, securities, cash and financial USD 1,712 –128 –231 1,965 –101 –190 Fixed Variable Fixed Variable interest rate interest rate interest rate interest rate liabilities into the functional currency of the respective Group Other 1,011 –49 –94 1,117 –66 –123 company. Foreign currency contracts in various currencies are used Loans 109 129 75 115 Total 2,723 –177 –324 3,082 –167 –313 Securities 60 209 51 206 to hedge foreign exchange risks from nonderivative financial instruments and planned transactions. Financial 14,446 2,738 17,742 1,472 Due to the use of options to hedge currency risks, the sensitivity indebtedness The foreign currency risk exposure corresponds to the net amount analysis is not a linear function of the assumed changes in exchange of the nominal volume of the primary and the derivative financial rates. Nominal and fair values of combined interest rate and currency swaps instruments that are exposed to currency risks. In addition, planned Million € purchase and sales transactions of the respective following year are Interest rate risks: Interest rate risks arise from changes in pr evailing December 31, 2021 December 31, 2020 included if they fall under the currency risk management system. market interest rates, which can lead to changes in the fair value of Nominal Fair Nominal Fair value value value value Long and short positions in the same currency are offset against fixed-rate instruments and in interest payments for variable-rate each other. instruments. Interest rate swaps and combined interest rate and Combined interest rate and 4,183 102 4,183 –163 currency swaps currency derivatives are used in individual cases to hedge these of which fixed rate 4,183 102 4,183 –163 The sensitivity analysis was conducted by simulating a 5% and 10% risks. The derivatives are presented in Note 26.5. Interest rate risks appreciation of the respective functional currency against the other are relevant to BASF’s financing activities but are not of material currencies. A 5% appreciation of the respective functional currency significance for BASF’s operating activities. Central benchmark interest rates are being comprehensively revised would have reduced BASF’s income before income taxes by as part of what is known as the IBOR reform. Accordingly, the €174 million as of December 31, 2021. A 10% appreciation of the The variable interest risk exposure, which also includes fixed rate interest rates affected by the reform will be phased out and replaced respective functional currency would have resulted in a negative bonds maturing in the following year, amounted to –€2,408 million by new ones. The publication of all GBP, EUR, CHF and JPY LIBORs effect on BASF’s income before income taxes in the amount of as of December 31, 2021 (2020: –€1,659 million). An increase in all as well as USD LIBORs with maturities of one week and two months €326 million. A 5% appreciation of the respective functional curr ency relevant interest rates by one half of a percentage point would have was discontinued as of December 31, 2021. Publication of the resulted in an effect on BASF’s income in the amount of –€203 mil- lowered income before income taxes by €4 million as of remaining USD LIBORs is expected to continue until June 30, 2023. lion as of December 31, 2020 (–€390 million with a 10% apprecia- December 31, 2021. An increase in all relevant interest rates by one tion). The effect from the items designated under hedge accounting percentage point would have lowered income before income taxes BASF is continuously monitoring developments arising from the would have decreased shareholders’ equity before income taxes by by €9 million as of the same date. An increase in all relevant interest IBOR reform to ensure the timely adjustment of existing contracts as €3 million applying 5% appreciation to the functional currency, and rates by one half of a percentage point would have lowered income well as to identify potential financial risks at an early stage. Particular increased it by €2 million applying 10% appreciation to the functional before income taxes by €5 million as of December 31, 2020 (an consideration is given to the carrying amounts or nominal values currency as of December 31, 2021 (2020: increase of €36 million increase of one percentage point would have lowered income before (derivatives) of contracts that reference an interest rate affected by applying 5% appreciation to the functional currency and increase of income taxes by €10 million). Because no interest derivatives were the reform and therefore may still have to be converted to an designated in hedge accounting relationships as of Decem- alternative interest rate (contracts yet to be adjusted). As of
BASF Report 2021 Consoli dated Financial Statements – Notes 267 December 31, 2021, financial liabilities related to contracts yet to be By holding commodity derivatives and precious metal trading Exposure due to commodity derivatives adjusted were identified in the amount of €302 million. These are positions, BASF is exposed to price risks. The valuation of Million € mainly variable-rate bank loans referenced to a USD LIBOR commodity derivatives and precious metal trading positions at fair December 31, 2021 December 31, 2020 (€187 million) or EONIA (€115 million). Furthermore, financial assets value means that adverse changes in market prices could negatively Exposure Value at risk Exposure Value at risk related to contracts yet to be adjusted were identified in the amount affect the earnings and equity of BASF. Crude oil, oil of €85 million. These are mainly short-term loans, particularly to products and 97 18 56 5 natural gas nonconsolidated subsidiaries, that are referenced to a USD LIBOR BASF concluded several physical power purchase agreements Precious metals 51 1 88 1 (€85 million). No derivatives were identified that are associated with (physical PPAs) in Europe with terms of up to 25 years in 2021. contracts yet to be adjusted. Under the physical PPAs, BASF procures electricity and associated Agricultural 58 0 37 0 commodities green electricity certificates, known as guarantees of origin (GoOs), Electricity and Commodity price risks: Some of BASF’s divisions are exposed to at a fixed price. Some physical PPAs are not eligible for the own use green electricity 388 7 – – strong fluctuations in raw materials prices. These result primarily exemption and are therefore recognized as derivatives in the bal- certificates from raw materials (for example naphtha, benzene, natural gas, LPG ance sheet. In addition, BASF concluded what is known as a virtual condensate) as well as from precious metals. BASF takes the power purchase agreement (virtual PPA) with a term of 15 years in The exposure corresponds to the net amount of all long and short following measures to reduce price risks associated with the the United States in 2021. The virtual PPA contains an embedded positions of the respective commodity category. purchase of raw materials: contract for difference for electricity that is recognized separately as For more information on BASF’s financial risks and risk management, see Opportunities and Risks – BASF uses commodity derivatives to hedge risks from the vola- a derivative in the balance sheet. from page 151 onward tility of raw materials prices. These are primarily options on crude oil, oil products and natural gas. BASF performs value-at-risk analyses for all commodity derivatives Default and credit risk – The Catalysts division enters into both short-term and long-term and precious metal trading positions. Using the value-at-risk analysis purchase contracts with precious metal and battery metal enables continual quantification of market risk and forecasting of the Default and credit risks arise when customers and debtors do not producers. It also buys precious metals on spot markets from maximum possible loss within a given confidence interval over a fulfill their contractual obligations. BASF regularly analyzes the various business partners. The price risk from metals purchased defined period. The value-at-risk calculation is based on a confidence creditworthiness of the counterparties and grants credit limits on the to be sold on to third parties, or for use in the production of interval of 95% and a holding period of one day. BASF uses the basis of this analysis. Due to the global activities and diversified catalysts and battery materials, is hedged using derivative variance-covariance approach. customer structure of the BASF Group, there is no significant instruments. This is mainly performed using forward contracts, concentration of default risk. The carrying amount of all receivables, which are settled by either entering into offsetting contracts or by BASF uses value at risk in conjunction with other risk management loans and interest-bearing securities plus the nominal value of delivering the precious metal. tools. Besides value at risk, BASF sets volume-based limits as well financial obligations stemming from contingent liabilities not to be – In the Agricultural Solutions division, the sales prices of products as exposure and stop-loss limits. recognized represents the maximum default risk for BASF. are sometimes pegged to the price of certain agricultural For more information on credit risks, see Note 18 from page 247 onward commodities. To hedge the resulting risks, derivatives on agricultural commodities are concluded. Liquidity risks In addition, BASF holds limited unhedged precious metal and oil BASF promptly recognizes any risks from cash flow fluctuations as product positions, which can also include derivatives, for trading on part of liquidity planning. BASF has ready access to sufficient liquid its own account. The value of these positions is exposed to market funds from the ongoing commercial paper program and confirmed price volatility and is subject to constant monitoring. lines of credit from banks.
BASF Report 2021 Consoli dated Financial Statements – Notes 268 26.3 Maturity analysis Maturities of contractual cash flows from financial liabilities as of December 31, 2021 Million € The interest and principal payments as well as other payments for Bonds and other Accounts liabilities to the Liabilities to payable, Derivative Miscellaneous derivative financial instruments are relevant for the presentation of capital market credit institutions trade liabilities liabilities Total the maturities of the contractual cash flows from financial liabilities. 2022 2,462 1,200 7,820 459 762 12,703 Future cash flows are not discounted here. 2023 2,230 190 4 37 251 2,712 2024 675 796 2 3 182 1,658 Derivatives are included using their net cash flows, provided they have negative fair values and therefore represent a liability. Derivatives 2025 1,812 258 – 52 126 2,248 with positive fair values are assets and are therefore not taken into 2026 629 684 – 0 94 1,407 account. 2027 and thereafter 7,608 382 – 57 706 8,753 Total 15,416 3,510 7,826 608 2,121 29,481 Maturities of contractual cash flows from financial liabilities as of December 31, 2020 Million € Bonds and other Accounts liabilities to the Liabilities to payable, Derivative Miscellaneous capital market credit institutions trade liabilities liabilities Total 2021 2,531 1,128 5,276 76 749 9,760 2022 2,161 295 12 287 267 3,022 2023 2,150 301 3 103 178 2,735 2024 673 868 – 28 132 1,701 2025 1,749 215 – 70 91 2,125 2026 and thereafter 8,133 1,035 – 80 605 9,853 Total 17,397 3,842 5,291 644 2,022 29,196
BASF Report 2021 Consoli dated Financial Statements – Notes 269 26.4 Classes and categories of financial instruments At the time of initial recognition, the fair value of the contract for Sensitivities physical PPAs (Europe) difference, which was calculted using a valuation model, was higher Million € For trade accounts receivable, other receivables and miscellaneous than the transaction price. As this is a level 3 fair value, the difference Change in expected Change in expected Change in expected assets, cash and cash equivalents, as well as trade accounts of €12 million is deferred and reported in the balance sheet together electricity prices GoO prices production volumes payable and other liabilities, the carrying amount approximates the with the positive or negative fair value of the contract for difference, +10% –10% +10% –10% +10% –10% fair value. according to the valuation model, under other receivables and 42 –42 1 –1 8 –8 miscellaneous assets or other liabilities. The difference is reversed The fair value of financial indebtedness is determined on the basis of using the straight-line method over the term of the contract. Income At the time of initial recognition, the physical PPAs’ fair values, which interbank interest rates. The difference between carrying amounts from the reversal of the difference will be recognized in profit or loss were calculated using a valuation model, were higher or lower, and fair values results primarily from changes in market interest under other operating income. The changes in fair value according respectively, than the transaction prices. As these are level 3 fair rates. to the valuation model are recognized in profit or loss as other values, the differences amounting to €14 million and –€5 mil lion operating income or other operating expenses. were deferred and recognized in the balance sheet together with the The financial instruments reported under Derivatives – no hedge positive fair values of the contracts, according to the valuation accounting, of which fair value level 3, in the table “Carrying The financial instruments reported under Derivatives – hedge model, under assets of disposal groups. The differences are amounts and fair values of financial instruments” relate to a accounting, of which fair value level 3, in the table “Carrying reversed over the term of the contract using the straight-line method. contract for difference for electricity embedded in a virtual power amounts and fair values of financial instruments” relate to two The resulting gains and losses are reported in profit or loss under purchase agreement (virtual PPA). The expected contractual physical power purchase agreements (physical PPAs) concluded in other operating income or other operating expenses. capacity of the solar power plant in Texas, United States, is Europe. The physical PPAs are based on wind turbines in the 50 mega watts. The solar park is scheduled to go into operation in Netherlands with an expected proportional capacity of 35 mega- The physical PPAs were designated in a cash flow hedge accounting 2023. The level 3 fair value is determined as the present value of the watts each. The wind farm is scheduled to go into operation in 2022 relationship. Accordingly, the effective portion of the change in fair expected cash flows from the contract for difference. The key or 2023. Unlike virtual PPAs, physical PPAs provide for actual supply value of the hedging instruments is recognized directly in equity valuation parameters are the expected electricity prices and of electricity volumes to BASF. In addition to electricity, BASF (other comprehensive income). Possible ineffectiveness is recog- expected production volumes. A change in the key valuation receives certificates verifying the “green properties” of the electricity, nized in profit or loss as other operating income or other operating parameters as of December 31, 2021 would have af fected the fair known as guarantees of origin (GoOs). BASF pur chases both the expenses. value of the contract for difference as follows: electricity and the GoOs at a fixed price under the physical PPAs. Because the physical PPAs described here are not eligible for the Sensitivities virtual PPA contract for difference for electricity own use exemption, they are to be recognized in the balance sheet (United States) as derivatives and measured at fair value. Level 3 fair value is Million € determined as the present value of the difference between the Change in expected Change in expected agreed fixed price and the expected market prices for electricity or electricity prices production volumes GoOs. The key valuation parameters are the expected electricity +10% –10% +10% –10% and GoO prices as well as the expected production volumes. 5 –5 1 –1
BASF Report 2021 Consoli dated Financial Statements – Notes 270 Carrying amounts and fair values of financial instruments as of December 31, 2021 Million € Total carrying amount Valuation category within scope of in accordance Of which Of which Of which b c d e Carrying amount application of IFRS 7 with IFRS 9 Fair value fair value level 1 fair value level 2 fair value level 3 a Shareholdings 514 514 FVTPL 0 – 0 – Receivables from finance leases 44 44 n/a 44 – – – Accounts receivable, trade 11,723 11,723 AC 11,723 – – – Accounts receivable, trade 219 219 FVTPL 219 – 219 – Derivatives – no hedge accounting 729 729 FVTPL 729 13 716 – g Derivatives – hedge accounting 287 287 n/a 296 0 216 80 f Other receivables and miscellaneous assets 6,211 1,351 AC 1,351 – – – f Other receivables and miscellaneous assets 90 90 FVTPL 90 – 90 – Securities 9 9 AC 9 – – – Securities 0 0 FVTOCI 0 – 0 – Securities 260 260 FVTPL 260 207 53 – Cash equivalents 236 236 FVTPL 236 236 – – Cash and cash equivalents 2,388 2,388 AC 2,388 – – – Total assets 22,710 17,850 17,345 456 1,294 80 Bonds 13,489 13,489 AC 14,617 12,819 1,798 – Commercial paper 248 248 AC 248 – – – Liabilities to credit institutions 3,447 3,447 AC 3,447 – – – Liabilities from leases 1,412 1,412 n/a 1,412 – – – Accounts payable, trade 7,826 7,826 AC 7,826 – – – h Derivatives – no hedge accounting 568 568 FVTPL 557 2 566 –11 Derivatives – hedge accounting 1 1 n/a 1 0 1 – f Other liabilities 3,298 2,267 AC 2,267 – – – Total liabilities 30,289 29,258 30,375 12,821 2,365 –11 a In general, only significant shareholdings are measured at fair value. All insignificant shareholdings are measured at cost (carrying amount: €514 million). Fair value level 1 is applied to publicly listed shareholdings. Level 2 is applied to shar eholdings for which valuation is based on parameters observable in the market to the greatest extent possible. These may be adjusted to reflect valuation-relevant characteristics of the respective shareholding in the fair value. b AC: amortized cost; FVTOCI: fair value through other comprehensive income; FVTPL: fair value through profit or loss; a more detailed description of the categories can be found in Note 26.1 from page 263 onward. c Fair value was determined based on quoted, unadjusted prices on active markets. d Fair value was determined based on parameters for which directly or indirectly quoted prices on active markets were available. e Fair value was determined based on parameters for which there was no observable market data. f Does not include separately shown derivatives or receivables and liabilities from finance leases. If miscellaneous receivables are valued at fair value through profit or loss, their valuation is generally based on parameters observable on the market. These are adjusted to reflect valuation-relevant characteristics of the respective assets in the fair value. g The carrying amount of the physical PPAs reported in the balance sheet under assets of disposal groups is €71 million after subtracting the differences of €14 million and –€5 million described on page 269. h The carrying amount of the contract for difference for electricity reported in the balance sheet under other liabilities is €1 million after subtracting the difference of €12 million described on page 269.
BASF Report 2021 Consoli dated Financial Statements – Notes 271 Carrying amounts and fair values of financial instruments as of December 31, 2020 Million € Total Valuation category within application in accordance Of which Of which Of which b c d e Carrying amount scope of IFRS 7 with IFRS 9 Fair value fair value level 1 fair value level 2 fair value level 3 a Shareholdings 533 533 FVTPL 94 93 1 – Receivables from finance leases 44 44 n/a 44 – – – Accounts receivable, trade 9,422 9,422 AC 9,422 – – – Accounts receivable, trade 44 44 FVTPL 44 – 44 – Derivatives – no hedge accounting 387 387 FVTPL 387 1 386 – Derivatives – hedge accounting 132 132 n/a 132 0 132 – f Other receivables and miscellaneous assets 4,889 1,075 AC 1,075 – – – f Other receivables and miscellaneous assets 133 133 FVTPL 133 – 133 – Securities 8 8 AC 8 – – – Securities 0 0 FVTOCI 0 – 0 – Securities 249 249 FVTPL 249 207 42 – Cash equivalents 145 145 FVTPL 145 145 – – Cash and cash equivalents 4,185 4,185 AC 4,185 – – – Total assets 20,171 16,357 15,918 446 738 − Bonds 14,189 14,189 AC 15,500 – 15,500 – Commercial paper 1,290 1,290 AC 1,290 – – – Liabilities to credit institutions 3,735 3,735 AC 3,735 – – – Liabilities from leases 1,360 1,360 n/a 1,360 – – – Accounts payable, trade 5,291 5,291 AC 5,291 – – – Derivatives – no hedge accounting 957 957 FVTPL 957 25 932 – Derivatives – hedge accounting 1 1 n/a 1 – 1 – f Other liabilities 2,833 1,804 AC 1,804 – – – Total liabilities 29,656 28,627 29,938 25 16,433 − a In general, only significant shareholdings are measured at fair value. All insignificant shareholdings are measured at cost (carrying amount: €439 million). Fair value level 1 is applied to publicly listed shareholdings. Level 2 is applied to shar eholdings for which valuation is based on parameters observable in the market to the greatest extent possible. These may be adjusted to reflect valuation-relevant characteristics of the respective shareholding in the fair value. b AC: amortized cost; FVTOCI: fair value through other comprehensive income; FVTPL: fair value through profit or loss; a more detailed description of the categories can be found in Note 26.1 from page 263 onward. c Fair value was determined based on quoted, unadjusted prices on active markets. d Fair value was determined based on parameters for which directly or indirectly quoted prices on active markets were available. e Fair value was determined based on parameters for which there was no observable market data. f Does not include separately shown derivatives or receivables and liabilities from finance leases. If miscellaneous receivables are valued at fair value through profit or loss, their valuation is generally based on parameters observable on the market. These are adjusted to reflect valuation-relevant characteristics of the respective assets in the fair value.
BASF Report 2021 Consoli dated Financial Statements – Notes 272 Offsetting of derivative assets and liabilities as of December 31, 2021 Million € Offset amounts Potential netting volume Due to global netting Gross amount Amount offset Net amount agreements Relating to financial collateral Potential net amount Derivatives with positive fair values 459 –12 447 –209 –125 112 Derivatives with negative fair values 459 –12 447 –209 –116 121 Offsetting of derivative assets and liabilities as of December 31, 2020 Million € Offset amounts Potential netting volume Due to global netting Gross amount Amount offset Net amount agreements Relating to financial collateral Potential net amount Derivatives with positive fair values 415 –18 397 –134 –61 202 Derivatives with negative fair values 563 –18 545 –134 –233 178 The table “Offsetting of derivative assets and liabilities” shows the receivable were reduced by €805 million. The reduction in trade extent to which assets and liabilities were offset in the balance sheet, accounts payable was €36 million and the reduction in advance as well as potential effects from the offsetting of derivatives subject payments received on orders was €769 million. Accordingly, the net to a legally enforceable global netting agreement (primarily in the amount for trade accounts receivable was €11,942 million (gross form of an ISDA agreement) or similar agreement. For positive fair amount before offsetting: €12,747 million). The resulting net amount values of combined interest rate and currency swaps, the respective for trade accounts payable was €7,826 million (gross amount before counterparties provided cash collaterals in an amount comparable offsetting: €7,862 million). The net amount for advance payments to the outstanding fair values. received on orders was €949 million (gross amount before offsetting: €1,718 million). In 2020, trade accounts receivable were also offset Deviations from the derivatives with positive fair values and against trade accounts payable and the advance payments received derivatives with negative fair values reported in other receivables on orders included in current other liabilities. This reduced trade and other liabilities at the end of 2021 and 2020 arose from accounts receivable by €616 million. The reduction in trade accounts derivatives not subject to any netting agreements as well as from payable was €45 million and the reduction in advance payments embedded derivatives. These are not included in the table above. received on orders was €571 million. Accordingly, the net amount for trade accounts receivable was €9,466 million (gross amount In addition to the offsetting of derivatives presented in the table before offsetting: €10,082 million). The resulting net amount for above, trade accounts receivable in 2021 were offset against trade trade accounts payable was €5,291 million (gross amount before accounts payable and advance payments received on orders, which offsetting: €5,336 million). The net amount for advance payments were included in current other liabilities, provided specific netting received on orders was €679 million (gross amount before offsetting: agreements with customers existed. As a result, trade accounts €1,250 million).
BASF Report 2021 Consoli dated Financial Statements – Notes 273 The net gains and losses from financial instruments shown in the Net gains and losses from financial instruments following table comprise the results of valuations, the amortization of Million € discounts, the recognition and reversal of impairments, results from 2021 2020 the translation of foreign currencies as well as interest, dividends Financial assets measured at amortized cost 318 –282 and all other effects on the earnings resulting from financial of which interest result 19 32 instruments. The line item financial instruments at fair value through Financial instruments at fair value through profit or loss 608 691 profit or loss contains only gains and losses from instruments that of which interest result 58 65 are not designated as hedging instruments in a hedging relationship Financial assets at fair value through other comprehensive income 2 2 in accordance with IFRS 9. of which interest result 2 1 Gains and losses from the valuation of securities recognized in equity are shown in development of income and expense recognized in equity attributable to shareholders of BASF SE on page 195 Financial liabilities measured at amortized cost –726 –326 For more information, see the Statement of Changes in Equity on page 199 of which interest result –324 –403
BASF Report 2021 Consoli dated Financial Statements – Notes 274 26.5 Derivative financial instruments and hedging To ensure efficient risk management, risk positions are centralized at Hedge accounting relationships BASF SE and certain Group companies. The contracting and execution of derivative financial instruments for hedging purposes BASF is exposed to commodity price risks in the context of procuring The use of derivative financial instruments are conducted according to internal guidelines, and subject to strict naphtha. Some of the planned purchases of naphtha are hedged control mechanisms. using swaps and options on oil and oil products. The main BASF is exposed to foreign currency, interest rate and commodity contractual elements of these items are aligned with the price risks during the normal course of business. These risks are The fair values of derivative financial instruments are calculated characteristics of the hedged item. Cash flow hedge accounting hedged using derivative instruments as necessary in accordance using valuation models that, if available, use input parameters was employed for a portion of these hedging relationships in 2021 with a centrally determined strategy. Hedging is employed for observable on the market. Exceptions to this are some commodity and 2020. The average exercise price of the designated options existing underlying transactions from the product business, cash derivatives, whose valuation is based directly on market prices. was $675.54 per metric ton as of December 31, 2021 (Decem- investments and financing as well as for planned sales, raw material ber 31, 2020: $454.45 per metric ton). Cash flows from designated purchases and capital measures. Furthermore, hedging may also be In addition to the derivative instruments presented in the following hedging instruments and hedged transactions occur in the following used for cash flows from acquisitions and divestitures. The risks table, BASF also had derivatives that were embedded in other year and are also recognized in profit or loss for that year. from the hedged items and the derivatives are continually monitored. financial instruments. This primarily related to options embedded in Where derivatives have a positive market value, BASF is exposed to a loan on the borrower’s equity instruments. The fair value of these Furthermore, cash flow hedge accounting continued to be employed credit risks from derivative transactions in the event of nonperfor- derivatives was €33 million as of December 31, 2020. The options to a minor extent for procuring natural gas, which is likewise exposed mance of the other party. To minimize the default risk on derivatives were exercised in 2021. to commodity price risks. Commodity price-based options serve as with positive market values, transactions are exclusively conducted hedging instruments, for which contract terms are defined to reflect with creditworthy banks and partners and are subject to predefined the risks of the hedged item. Depending on where trading took credit limits. place, the average exercise price of the designated options was €32.60 per MWh or $3.74 per mmBtu as of December 31, 2021. The average exercise price of the designated options was €13.35 per MWh or $2.74 per mmBtu as of December 31, 2020. Cash Fair value of derivative instruments flows from the hedging transaction and hedged item are generally Million € recognized in profit or loss for the following year. December 31, 2021 December 31, 2020 Foreign currency forward contracts 21 10 The change in the options’ time value is recognized separately in Foreign currency options 1 35 equity as costs of transaction-related hedging and, in the year Foreign currency derivatives 22 45 during which the hedged items mature, it is initially derecognized of which designated hedging instruments as defined by IFRS 9 (hedge accounting) 0 35 against the carrying amount of the procured assets and recognized Combined interest rate and currency swaps 102 –163 in profit or loss when the assets are consumed. In 2021, a decrease in fair value of €27 million was recognized in equity, and €24 million of which designated hedging instruments as defined by IFRS 9 (hedge accounting) 179 90 was initially derecognized against the carrying amount of the Interest derivatives 102 –163 inventories procured and then recognized upon consumption in Commodity derivatives 324 –321 profit or loss. In 2020, a decrease in fair value of €17 million was a recognized as a reduction in equity, and €13 million was derecog- of which designated hedging instruments as defined by IFRS 9 (hedge accounting) 107 7 Derivative financial instruments 447 –439 nized against the carrying amount of the assets. a Of which €71 million reported in the balance sheet under assets of disposal groups
BASF Report 2021 Consoli dated Financial Statements – Notes 275 BASF’s planned soybean procurement is also exposed to commod- Furthermore, BASF SE’s fixed-rate U.S. private placement of BASF used currency options in 2021 to hedge the foreign currency ity price risks. These commodity price risks are hedged with soybean $1.25 billion, issued in 2013, was converted to euros using risk resulting from the U.S. dollar-denominated sales price for the futures. The contractual conditions for these hedging transactions cross-currency swaps, as the private placement exposes BASF to a sale of the shares in Solenis. These were designated in a cash flow correspond to the respective hedged item, and some are desig- combined interest/currency risk. The hedged interest rate was hedge accounting relationship. As this was a transaction-related nated in cash flow hedge accounting relationships. The average 4.13% in the fiscal years 2021 and 2020. The hedged foreign hedge, the change in the time value component was recognized as price hedged using these instruments was $13.35 per bushel as of exchange rate in both years was $1.3589 per euro. This hedge was hedging costs at a point in time. Accordingly, €10 million was initially December 31, 2021 (December 31, 2020: $12.52 per bushel). Cash designated as a cash flow hedge. recognized as a reduction in equity. Upon disposal of the shares in flows from these futures and the hedged expected future transac- Solenis in November 2021, the amount recognized in equity was tions are generally recognized in profit or loss for the following year. Furthermore, BASF was exposed to foreign currency risks in 2021 reclassified to profit or loss and reported under net income from through U.S. dollar-denominated commercial paper. These risks are shareholdings. There was no ineffectiveness at any time during the The physical power purchase agreements that were reported as hedged with foreign currency forward contracts and designated in a year. derivatives in the balance sheet were designated as hedging cash flow hedge accounting relationship. The changes in the value instruments to a cash flow hedge accounting relationship. The aver- of the hedging instruments in the amount of €11 million resulting Furthermore, BASF used foreign currency options in 2021 to hedge age price hedged using these instruments was €45.44 per MWh of from the change in the forward rate were recognized as time- period- the Chinese renminbi denominated purchase price for 51% of the electricity and €1.83 per GoO as of December 31, 2021. The real- related hedging costs. Because all underlying transactions and shares in BASF Shanshan Battery Materials Co., Ltd. The options ized hedging results are recognized in profit or loss upon occurrence hedging instruments had expired by December 31, 2021, the used for hedging were designated in a cash flow hedge accounting of the hedged underlying transactions in the years 2022 to 2048. amount of €11 million, which was initially recognized in equity, was relationship. This was a transaction-related hedge; accordingly, the reclassified in full as an increase in earnings. There was no change in the time value component was recognized as hedging Due to planned sales in U.S. dollars, BASF is exposed to foreign ineffectiveness at any time during the year. costs at a point in time. For this purpose, €2 million was recognized currency risks, which are partially hedged with currency options and as a reduction in equity. Upon closing of the transaction in designated in a cash flow hedge accounting relationship. The The expected sales price associated with the disposal of the August 2021, the amount recognized in equity as hedging costs hedged transaction – the designated share of expected sales in pigments business was partially hedged against exchange rate was derecognized thereby increasing the purchase price. There was U.S. dollars – is calculated based on internal thresholds. The hedged fluctuations in 2021 and 2020. The occurrence of the hedged no ineffectiveness at any time during the year. volume is always below the total amount of expected sales in transactions was, due to contractual agreements, considered highly U.S. dollars for the following fiscal year. The average hedged rate probable; and the transaction and derivatives used for hedging were The effects of the hedging relationships on the balance sheet, the was $1.1630 per euro as of December 31, 2021, and $1.1583 per designated in a cash flow hedge accounting relationship. The hedge cash flow hedge reserve, hedged nominal value and ineffectiveness euro in the previous year. The impact on earnings from designated was initially achieved through foreign currency forward contracts to be determined are presented in the following tables by fiscal year. transactions in 2021 will be recognized in the following year. The and, following the discontinuation of this hedging relationship, with decrease in the options’ time value component arising in the amount foreign currency options. This was a transaction-related hedge. The of €14 million in 2021 was recognized separately in equity as the change in the forward rate and the change in the time value cost of hedging and resulted in a reduction in equity. Due to the component were recognized as hedging costs at a point in time. maturity of hedged items, accumulated changes in the options’ time This reduced equity by €3 million in 2021, and by €8 million in 2020. values were reclassified as a reduction in earnings in the amount of Upon disposal of the pigments business as of June 30, 2021, €19 million. In 2020, €30 million was recognized as a change in the €11 million was reclassified as a reduction in earnings and included options’ time value component, thereby reducing equity; and in disposal losses from the global pigments business. There was no €34 million was reclassified as a reduction in earnings. ineffectiveness at any time during the year.
BASF Report 2021 Consoli dated Financial Statements – Notes 276 Cash flow hedge accounting effects in 2021 Million € Change in fair values for assessing Carrying amount of hedging instruments Cash flow hedge reserve ineffectiveness Recognized ineffectiveness Income Accumulated Hedging effects Amounts statement amounts for recognized reclassified to item for continuing in other profit or loss for recognition Financial Financial Nominal hedging comprehensive realized hedging of reclassifi- Hedging Hedged Ineffective- Income assets liabilities Balance sheet item value relationships income transactions cation instrument transaction ness amount statement item Other receivables and Other Foreign currency risks 1 –1 miscellaneous assets / 508 0 83 –125 operating 0 0 – n/a other liabilities income Combined interest/ 179 – Other receivables and 920 –4 89 –85 Other financial 179 187 – n/a f oreign currency risks miscellaneous assets income Other receivables and Commodity price risks 107 0 miscellaneous assets / 488 73 154 –a n/a 100 100 – n/a assets of disposal groups / other liabilities Total 287 –1 1,916 69 326 –210 279 287 − a €59 million was derecognized from the cash flow hedge reserve against the cost of inventories and recognized in profit or loss upon consumption. Cash flow hedge accounting effects in 2020 Million € Change in fair values for assessing Carrying amount of hedging instruments Cash flow hedge reserve ineffectiveness Recognized ineffectiveness Income Accumulated Hedging effects Amounts statement amounts for recognized reclassified to item for continuing in other profit or loss for recognition Financial Financial Nominal hedging comprehensive realized hedging of reclassifi- Hedging Hedged Ineffective- Income assets liabilities Balance sheet item value relationships income transactions cation instrument transaction ness amount statement item Other receivables and Other Foreign currency risks 35 – miscellaneous assets 1,142 27 114 –77 operating 27 27 – n/a income Interest risks – – Other liabilities – – –3 4 Interest 0 0 – n/a income Combined interest/ 90 – Other receivables and 920 5 –48 94 Other financial 90 102 – n/a foreign currency risks miscellaneous assets income Other receivables and Commodity price risks 7 0 miscellaneous assets / 65 5 9 –a n/a 5 5 – n/a other liabilities Total 132 0 2,127 37 72 21 122 134 − a €6 million was derecognized from the cash flow hedge reserve against the cost of inventories and recognized in profit or loss upon consumption.
BASF Report 2021 Consoli dated Financial Statements – Notes 277 The occurrence of all forecasted transactions was considered to be 27 Statement of cash flows and capital structure business. These included tax payments in the amount of €150 mil- highly probable at all times during fiscal years 2021 and 2020. management lion that were directly associated with the transaction. Further tax Amounts accumulated in the cash flow hedge reserve for com- payments were accounted for in the amount of €31 million in 2021. modity price risks are derecognized against the carrying amount of Statement of cash flows For more information on acquisitions and divestitures, see Note 3 from page 207 onward acquired assets once the hedged transaction occurs. Thus, there is no immediate reclassification of the amounts recognized in the cash Cash flows from operating activities contained the following Payments made for property, plant and equipment and intangible flow hedge reserve to profit or loss in these cases. payments: assets amounted to €3,532 million, €403 million higher than in the previous year. In connection with its catalyst production, BASF is exposed to Statement of cash flows commodity price risks associated with holding physical precious Million € In 2020, BASF SE transferred securities in the amount of €401 mil- metal items. These production-related precious metal inventories 2021 2020 lion to BASF Pensionstreuhand e.V., Ludwigshafen am Rhein, are hedged with forward contracts in accordance with a defined Income taxes –1,707 –595 Germany. This transfer was not cash effective and therefore had no hedging strategy. In 2021, a portion of these precious metal of which income tax refunds 95 273 effect on the statement of cash flows. inventories was designated in a fair value hedge accounting income tax payments –1,802 –868 relationship with forward contracts on the precious metals. Changes Interest payments –318 –341 Cash and cash equivalents consist primarily of cash on hand and in the forward rate were considered costs of hedging, and €2 million of which interest received 151 146 bank balances with maturities of less than three months. was recognized in other comprehensive income and reclassified successively to profit or loss, being a time-period-related hedge. All interest paid –469 –487 The cash and cash equivalents presented in the statement of cash hedging instruments expired in 2021. The hedged precious metals Dividends received 711 244 flows may deviate from the figures in the balance sheet if the r elevant were sold. Cash flows in connection with the hedging instruments amounts were reclassified to assets of disposal groups. As of were recognized in profit or loss in 2021. All hedging relationships In 2021, cash flows from investing activities included €600 million in January 1, 2021, cash and cash equivalents in the amount of were fully effective. payments made for acquisitions in connection with the purchase of €4,335 million reported in the statement of cash flows consisted of BASF Shanshan Battery Materials Co., Ltd. (2020: €1,240 million for the balance sheet value (€4,330 million) and the value reclassified to the acquisition of Solvay’s polyamide business). the pigments business disposal group (€5 million). No cash and cash equivalents were reclassified to the disposal groups as of Payments received for divestitures in the amount of €1,030 million December 31, 2021; their balance in the statement of cash flows were mainly from the sale of the pigments business. That included is therefore identical to that in the balance sheet. As of Janu- project-related tax payments of €65 million and special contributions ary 1, 2020, cash and cash equivalents in the amount of €2,455 mil- to Swiss pension plan assets of €43 million. Payments received from lion reported in the statement of cash flows consisted of the balance the disposal of the equity-accounted investment in Solenis sheet value (€2,427 million) and the values reclassified to the dis- (€1,066 million) are reported in cash flows from investing activities posal groups for the construction chemicals business (€21 million) under payments received from the disposal of noncurrent assets and the pigments business (€7 million). and securities. Gains on divestitures in the amount of €589 million was reclassified from cash flows from operating activities to cash As in the previous year, cash and cash equivalents were not subject flows from investing activities via gains (–) / losses (+) from the to any utilization restrictions. disposal of noncurrent assets and securities. The reconciliation according to IAS 7 breaks down the changes in In 2020, payments received for divestitures resulted in the amount financial and similar liabilities and their hedging transactions into of €2,520 million from the sale of the construction chemicals cash-effective and non-cash-effective changes. The cash-effective
BASF Report 2021 Consoli dated Financial Statements – Notes 278 Reconciliation according to IAS 7 for 2021 changes presented on the left correspond to the figures in cash Million € flows from financing activities. Dec. 31, Dec. 31, 2020a Non-cash-effective changes 2021a Loan liabilities do not contain any interest components. Acquisitions/ Cash effective in divestitures/ cash flows changes in Additions Changes Other financing-related liabilities primarily comprise liabilities from from financing the scope of Currency from lease Other in fair accounts used for cash pooling with BASF companies not included activities consolidation effects contracts effects value Financial indebtedness 19,214 –2,575 97 411 – 37 – 17,184 in the Consolidated Financial Statements. They are reported in miscellaneous liabilities within the balance sheet item other liabilities Loan liabilities 559 –63 –53 6 – –8 – 441 that qualify as financial instruments. Lease liabilities 1,369 –551b –17 52 622 –61c – 1,414 Other financing-related liabilities 228 52 54 2 – 6 – 342 Assets/liabilities from hedging transactions form part of the Financial and similar liabilities 21,370 –3,137 80 471 622 –26 − 19,381 balance sheet items derivatives with positive and negative fair values Assets/liabilities from hedging transactions –43 –8 – – – – 56 5 respectively and include only those transactions which hedge risks arising from financial indebtedness and financing-related liabilities Total 21,327 –3,145 80 471 622 –26 56 19,386 secured by micro hedges. a Balances as of December 31, 2021 and 2020 also include contributions reclassified to the disposal groups and therefore deviate from balance sheet values. For more information on receivables and miscellaneous assets, see Note 18 from page 247 onward b Lease payments totaled €437 million in 2021. The principal component in the amount of €401 million is presented in cash flows from financing activities. BASF reports interest payments in cash flows from operating activities; these items amounted to €36 million. Advance payments for land use rights at the new Verbund site in Zhanjiang, China, in the amount of €150 million are also included in cash flows from financing activities. For more information on liabilities, see Note 21 from page 251 onward c Includes mainly disposals from lease contracts. For more information on the statement of cash flows, see the Management’s Report from page 65 onward Reconciliation according to IAS 7 for 2020 Capital structure management Million € Dec. 31, Dec. 31, The aim of capital structure management is to maintain the financial 2019a Non-cash-effective changes 2020a flexibility needed to further develop BASF’s business portfolio and Acquisitions/ take advantage of strategic opportunities. The objectives of the Cash effective in divestitures/ cash flows changes in Additions Changes company’s financing policy are to ensure solvency, limit financial from financing the scope of Currency from lease Other in fair risks and optimize the cost of capital. activities consolidation effects contracts effects value Financial indebtedness 18,392 1,615 –7 –789 – 3 – 19,214 Capital structure management focuses on meeting the requirements Loan liabilities 526 45 –10 –3 – 1 – 559 needed to ensure unrestricted access to the capital market and a b c Lease liabilities 1,478 –415 –54 –85 519 –74 – 1,369 solid A rating. The capital structure is managed using selected Other financing-related liabilities 284 –36 –19 2 – –3 – 228 financial ratios, such as dynamic debt ratios, as part of the company’ s Financial and similar liabilities 20,680 1,209 –90 –875 519 –73 − 21,370 financial planning. Assets/liabilities from hedging transactions –49 371 – – – – –365 –43 The equity of the BASF Group as reported in the balance sheet Total 20,631 1,580 –90 –875 519 –73 –365 21,327 amounted to €42,081 million as of December 31, 2021 (Decem- a Balances as of December 31, 2020 and 2019 also include contributions reclassified to the disposal groups and therefore deviate from balance sheet values. ber 31, 2020: €34,398 million); the equity ratio was 48.2% on b Lease payments totaled €453 million in 2020. The principal component in the amount of €415 million is presented in cash flows from financing activities. BASF reports interest payments in cash flows from operating activities; these items amounted to €38 million. December 31, 2021 (December 31, 2020: 42.8%). c Includes mainly disposals from lease contracts.
BASF Report 2021 Consoli dated Financial Statements – Notes 279 BASF prefers to access external financing on the capital markets. A Ratings as of December 31, 2020 28 Personnel expenses and employees commercial paper program is used for short-term financing, while Noncurrent Current corporate bonds are used for financing in the medium and long financial financial Personnel expenses term. These are issued in euros and other currencies with different indebtedness indebtedness Outlook maturities. The goal is to create a balanced maturity profile, achieve Fitch A F1 stable The BASF Group’s expenses for wages and salaries, social security a diverse range of investors and optimize BASF’s debt capital Moody’s A3 P-2 stable contributions and assistance, as well as for pensions in 2021 totaled financing conditions. Since 2020, BASF has employed green Standard & Poor’s A A-1 negative €11,097 million. In 2020, these expenses amounted to €10,576 mil- corporate bonds to finance the development of sustainable products lion and included personnel expenses from the disposal group for and projects with a clear environmental benefit. the construction chemicals business in the amount of €291 million BASF strives to maintain a solid A rating, which ensures unrestricted until the date of the divestiture. The rise in personnel expenses in BASF currently has the following ratings, which were most recently access to financial and capital markets. 2021 was mainly due to higher bonus provisions. Particularly the confirmed by Fitch on June 11, 2021, and by Moody’s on For more information on BASF’s financing policy, see the Management’s Report from page 64 onward lower average number of employees had an offsetting impact. January 5, 2022. Standard & Poor’s adjusted its outlook for the A rating from “negative” to “stable” on July 16, 2021, and confirmed Personnel expenses the rating on January 6, 2022. Million € 2021 2020 Ratings as of December 31, 2021 Wages and salaries 8,847 8,416 Social security contributions and 1,519 1,424 Noncurrent Current assistance expenses financial financial indebtedness indebtedness Outlook Pension expenses 732 736 Fitch A F1 stable Personnel expenses 11,097 10,576 Moody’s A3 P-2 stable Standard & Poor’s A A-1 stable
BASF Report 2021 Consoli dated Financial Statements – Notes 280 Number of employees The average number of employees was distributed over the regions 29 Share price-based compensation programs as follows: and BASF incentive share program As of December 31, 2021, the number of employees increased to 111,047 employees compared with 110,302 employees as of Average number of employees Share price-based compensation programs December 31, 2020. The rise was primarily due to staf f increases in 2021 2020 Asia Pacific, especially in connection with the formation of In 2021, the BASF Group continued offering its share price-based BASF Shanshan Battery Materials Co., Ltd., as well as for the new Europe 67,788 71,329 compensation program (the long-term incentive (LTI) program), Verbund site in Zhanjiang, China. The divestiture of the pigments of which Germany 51,144 53,080 known as Strive!, which was launched in 2020. The share price- business, which comprised around 2,500 employees, had an North America 16,765 18,599 based compensation program known as “BOP” (BASF Option offsetting impact. Asia Pacific 18,464 18,719 Program), which had existed since 1999, was offered for the last South America, Africa, Middle East 6,799 7,326 time in 2020. All option rights granted during the BOP program As of December 31, 2021, a total of 1,175 employees (2020: years remain valid until the end of their respective exercise periods. 1,137 employees) worked at joint operations. BASF Group 109,815 115,973 of which apprentices and trainees 2,750 2,821 Generally, members of the Board of Executive Directors and all The development of the number of employees was distributed over temporary staff 2,400 2,518 senior executives are entitled to participate in the LTI programs. the regions as follows: The average number of employees decreased to 109,815 employ- Strive! Number of employees as of December 31 ees in 2021 (2020: 115,973 employees). This decline was primarily 2021 2020 due to the divestiture of the construction chemicals business in the Strive! is based on a performance share plan and takes into account previous year and to the divestiture of the pigments business in the the achievement of strategic goals and the development of the Europe 67,532 68,849 year under review. Employees from joint operations are included in BASF share and dividend (total shareholder return) over a period of of which Germany 51,026 51,961 the average number of employees relative to BASF’s share in the four years. North America 16,753 16,948 company. On average, these had a total of 1,143 employees (2020: Asia Pacific 19,976 17,753 1,055 employees). Participation in Strive! is voluntary for senior executives and is linked South America, Africa, Middle East 6,786 6,752 For more information on acquisitions and divestitures, see Note 3 from page 207 onward to a share ownership obligation. Strive! offers rolling eligibility, without a deadline for participation. Approximately 700 people were BASF Group 111,047 110,302 eligible to participate in Strive! in 2021. About 90% of eligible senior of which apprentices and trainees 3,028 3,120 executives and the Members of the Board of Executive Directors temporary staff 2,329 2,128 participated. Unlike for senior executives, participation is not voluntary for the members of the Board of Executive Directors and is outlined in their service contracts. The same plan conditions generally apply to members of the Board of Executive Directors. A Strive! plan includes a four-year performance period with a fixed disbursement date. A target amount is determined at the beginning of each new Strive! plan for every participant. This target amount is converted into a preliminary number of virtual performance share units (PSUs) by dividing it by the average BASF share price in the fourth quarter of the previous year. The number of PSUs that are
BASF Report 2021 Consoli dated Financial Statements – Notes 281 ultimately paid out at the end of the performance periods for Fair value of PSUs and parameters used as of December 31, 2021 BASF Option Program (BOP) Strive!2021 and Strive!2020 depends on the achievement of the Strive! program of the year three strategic targets: growth (volume growth compared with The “BOP” LTI program last offered in 2020, grants virtual option global chemical production), profitability (increase in EBITDA before 2021 2020 rights. When exercised, the option rights are settled in cash. special items) and sustainability (CO emissions). Number of PSUs granted 892,146 724,405 2 Number of PSUs vested 223,037 362,203 Participation in BOP was voluntary. In order to take part in the Achievement of each strategic target is calculated for each year of Fair value including fluctuation / PSU € 78.59 82.06 program, a participant had to make a personal investment: the four-year performance period. Upon conclusion of the perfor- Fair value excluding fluctuation / PSU € 88.83 89.04 Participants were required to hold BASF shares representing mance period, the average degree of target achievement for each between 10% and 30% of their respective variable compensation strategic goal is equal to the arithmetic mean of the degrees of target Weighted target achievement % 158.3 137.5 for a two-year period from the granting of the option (holding period). achievement for the four years. The total target achievement for the Base price € 57.15 67.85 The number of shares to be held was determined by the amount of respective Strive! plan is determined by adding the target achieve- variable compensation and the volume-weighted average share ment degree for the three strategic targets after having multiplied In 2021, the number of PSUs granted under the 2021 Strive! price on the first trading day after the Annual Shareholders’ Meeting. each by the corresponding weighting factor. To calculate the final program amounted to 892,146 and under the 2020 Strive! program number of PSUs, this weighted target achievement is multiplied by to 724,405. PSUs vested by the deadline totaling 223,037 for the Participants received four option rights per invested share. Each the preliminary number of PSUs. The payment amount upon 2021 Strive! program and 362,203 for the 2020 Strive! program option consists of two parts, right A and right B, which may be conclusion of the four-year performance period is calculated by were measured at fair value. Fair value is determined using the BASF exercised if defined thresholds have been met: The threshold of multiplying the final number of PSUs by the average BASF share share price of €61.78 on the balance sheet date plus expected right A is met if the price of the BASF share has increased by more price for the fourth quarter of the last year of the performance period, dividend payments during the term of the program. The weighted than 30% in comparison with the base price on the option grant plus the accumulated dividend payments in the four fiscal years. The target achievement degrees of 158.3% for the 2021 Strive! program date (absolute threshold). The value of right A is the difference payment occurs in May of the following year and is capped at 200% and 137.5% for the Strive! program 2020 are also taken into between the market price of BASF shares on the exercise date and of the target amount. The payment amount therefore not only account. A fluctuation rate of 4% is assumed in the fair value the base price; it is limited to 100% of the base price. Right B may reflects achievement of the strategic targets, but performance of calculation for senior executives. be exercised (relative threshold) if the cumulative percentage BASF’s dividend and share price as well (total shareholder return). performance of BASF shares exceeds the percentage performance The LTI provision for Strive! rose from €11 million as of Decem- of the MSCI World Chemicals IndexSM (MSCI Chemicals). The value A personal investment in BASF shares is the prerequisite for ber 31, 2020, to €48 million as of December 31, 2021, due to the of right B is the base price of the option multiplied by twice the participation in Strive!. Participants are required to own BASF shares increased number of vested PSUs and higher fair values. The percentage by which the BASF share outperforms the MSCI amounting to a predetermined percentage of their base salary for expense from the addition of provisions totaled €37 million in 2021 Chemicals Index on the exercise date. It is limited to the closing the duration of the performance period. A set-up phase applies to and €11 million in 2020. No provisions were attributable to the price on the date of exercise less the calculated nominal value of the first-time participants. During this period, they are required to hold a disposal groups as of December 31, 2021, or December 31, 2020. BASF share. Right B may only be exercised if the price of the BASF percentage of shares as their predetermined personal investment. share equals at least the base price. When a two-year vesting period The set-up phase for the 2021 Strive! program ends on Decem- is over, options granted can be exercised until the end of the ber 31, 2024. The 2021 Strive! program has the same fundamental respective exercise period. During the exercise period, there are structure as the 2020 Strive! program. certain times (closed periods) during which the options may not be exercised. Each option can only be exercised in full, and one of the thresholds must be exceeded. If the other threshold is not exceeded, the other option right lapses. A participant’s maximum gain from
BASF Report 2021 Consoli dated Financial Statements – Notes 282 exercising an option is limited to five times the original individual The exercisable options had no intrinsic value as of Decem- weighted-average fair value on the grant date amounted to €67.71 investment. Option rights are nontransferable and are forfeited if the ber 31, 2021, or December 31, 2020. for the 2021 program, and €45.30 for the 2020 program. option holders no longer work for the BASF Group or have sold part of their individual investment before the expiry of the two-year BASF “Plus” Incentive Share Program The fair value of the free shares to be granted is recognized as an vesting period. They remain valid in the case of retirement. For the expense with a corresponding increase in capital reserves over the members of the Board of Executive Directors, the long-term The “plus” incentive share program was introduced in 1999 and is term of the program. orientation of the program was significantly strengthened compared currently available to employees in Germany, other European with the conditions applying to the other participants. Members of countries and Mexico. Simultaneous participation in both the “plus” Personnel expenses for BASF’s “plus” incentive share program the Board of Executive Directors were required to participate in the program and an LTI program is not permitted. totaled €27 million in 2021 and €28 million in 2020. BOP program with at least 10% of their actual annual variable compensation. In view of this binding personal investment (in the Employees who participate in BASF’s “plus” incentive share program form of BASF shares), an extended holding period of four years and acquire shares in BASF as a personal investment from their applies. Members of the Board of Executive Directors may only variable compensation. For every 10 BASF shares purchased in the exercise their option rights four years after they have been granted program, a participant receives one BASF share at no cost after at the earliest (vesting period). one, three, five, seven and 10 years of holding these shares. As a rule, the first and second block of 10 shares entitles the participant The models used in the valuation of the option plans are based on to receive one BASF share at no extra cost in each of the next the arbitrage-free valuation model according to Black-Scholes. The 10 years. fair values of the options were determined using the binomial model. Volatility was determined on the basis of the monthly closing prices The right to receive free BASF shares lapses if a participant sells the over a historical period corresponding to the remaining term of the individual investment in BASF shares, if the participant stops working options. for a Group company or one year after retirement. The number of free shares to be granted has developed as follows: As a result of a resolution by the Board of Executive Directors in 2002 to settle option rights in cash, all outstanding option rights Number of free shares to be granted under the 2014 to 2020 programs were valued at fair value as of Shares December 31, 2021. A proportionate provision is recognized for 2021 2020 programs in the vesting period. As of January 1 3,251,576 3,025,462 Newly acquired entitlements 498,765 942,685 The LTI provision for BOP decreased from €115 million as of Bonus shares issued –547,960 –490,050 December 31, 2020, to €110 million as of December 31, 2021, due Lapsed entitlements –123,258 –226,521 to lower fair values and a lower number of outstanding option rights. As of December 31 3,079,123 3,251,576 No utilizations were recognized in 2020, whereas €3 million was utilized in 2021 due to senior executives leaving the company. Income from the reduction in provisions totaled €2 million in 2021. The free shares to be provided by the company are measured at the The expense from the addition of provisions totaled €25 million in fair value on the grant date. Fair value is determined on the basis of 2020. €1 million was attributable to the disposal group for the the BASF share price, taking into account the present value of pigments business as of December 31, 2020. dividends, which are not paid during the term of the program. The
BASF Report 2021 Consoli dated Financial Statements – Notes 283 30 Compensation of the Board of Executive Directors and Supervisory Board 31 Related party transactions Compensation of the Board of Executive Directors and Supervisory Board Related parties are legal or natural entities that can exert influence Million € on the BASF Group or over which the BASF Group exercises control 2021 2020 or joint control, or a significant influence. These primarily include Non-performance-related and performance-related cash compensation of the Board of Executive Directors 31.1 9.7 nonconsolidated subsidiaries, joint ventures and associated Fair value of options and performance share units allocated to the Board of Executive Directors in the fiscal year 12.3 12.1 companies. as of allocation datea Total compensation of the Board of Executive Directors 43.4 21.8 The following tables show the volume of business with related Service costs for members of the Board of Executive Directors 3.6 3.7 parties that are included in the Consolidated Financial Statements at amortized cost or accounted for using the equity method. The Compensation of the Supervisory Board 3.3 2.9 values include sales, receivables, other receivables, liabilities and Total compensation of former members of the Board of Executive Directors and their surviving dependents 14.3 12.5 other liabilities with respect to the disposal groups and/or discontinued operations. Pension provisions for former members of the Board of Executive Directors and their surviving dependents 196.9 209.0 Guarantees assumed for members of the Board of Executive Directors and the Supervisory Board – – Sales and trade accounts receivable from and trade accounts a Members of the Board of Executive Directors were allocated option rights under the long-term incentive (LTI) program for the last time in 2020. payable to related parties mainly included business with own products and merchandise, agency and licensing businesses, and other operating businesses. The STI performance bonus is based on the performance of the In 2021, members of the Board of Executive Directors were Board of Executive Directors as a whole and the return on capital allocated 187,618 performance share units (PSUs) under the LTI Other receivables and liabilities primarily arose from financing employed (ROCE) of the BASF Group. Subject to certain conditions, performance share program (2020: 151,247 PSUs). Market activities, from accounts used for cash pooling, outstanding dividend ROCE is adjusted for special items from acquisitions and divesti- valuation of the PSUs of members of the Board of Executive payments, profit and loss transfer agreements, and other finance- tures. The conditions for a ROCE adjustment were not met in 2021. Directors resulted in an expense totaling €9.6 million in 2021 related and operating activities and transactions. (2020: €2.9 million). In the final allocation of options under the BOP LTI program in 2020, The Compensation Report is available at basf.com/compensationreport The increase in other receivables from nonconsolidated subsidiaries 166,272 option rights were allocated to the Board of Executive For more information on the members of the Supervisory Board and Board of Executive Directors, as well as the decrease from associated companies resulted Directors. including their memberships on other boards, see page 174 onward primarily from other finance-related receivables. Market valuation of the option rights of active and former members The decline in other liabilities to associated companies resulted from of the Board of Executive Directors resulted in income totaling other finance-related liabilities and contract liabilities. €0.8 million in 2021. In 2020, option rights led to an expense in the amount of €1.1 million.
BASF Report 2021 Consoli dated Financial Statements – Notes 284 Sales to related parties Obligations arising from purchase contracts with joint ventures Million € amounted to €4 million as of December 31, 2021, and €6 million as Services rendered Services received of December 31, 2020. December 31, 2021 December 31, 2020 December 31, 2021 December 31, 2020 Nonconsolidated subsidiaries 872 691 340 295 Annual minimum rental payments for an office building including a Joint ventures 1,386 921 1,703 935 parking area payable by BASF SE to BASF Pensionskasse VVaG for Associated companies 459 432 1,294 586 the nonterminable basic rental period until 2029 amounted to €7 million. Trade accounts receivable from / trade accounts payable to related parties BASF SE had other finance-related receivables from BASF Pen- Million € sionskasse VVaG in the amount of €83 million as of Decem- Accounts Accounts ber 31, 2021, and €3 million as of December 31, 2020. receivable, trade payable, trade December 31, 2021 December 31, 2020 December 31, 2021 December 31, 2020 There were no reportable related party transactions with members Nonconsolidated subsidiaries 266 213 136 98 of the Board of Executive Directors or the Supervisory Board and Joint ventures 210 149 189 136 their related parties in 2021. Associated companies 34 64 221 43 For more information on subsidiaries, joint ventures and associated companies, see the 2021 BASF Group list of shares held on page 213 For more information about defined benefit plans, the division of risk between Group companies, see Provisions for pensions and similar obligations from page 254 onward Other receivables from / liabilities to related parties For more information on the members of the Board of Executive Directors and the Supervisory Board, Million € see Management and Supervisory Boards from page 174 onward Other receivables Other liabilities The Compensation Report is available at basf.com/compensationreport December 31, 2021 December 31, 2020 December 31, 2021 December 31, 2020 Nonconsolidated subsidiaries 237 192 214 198 Joint ventures 19 47 35 62 Associated companies 4 55 106 240 Balances outstanding to related parties were generally not hedged BASF had obligations from guarantees and other financial obligations and were settled in cash. in favor of nonconsolidated subsidiaries in the amount of €21 million as of December 31, 2021 (December 31, 2020: €8 million), and in The balance of valuation allowances on other receivables from favor of associated companies in the amount of €389 million as of nonconsolidated subsidiaries declined from €105 million as of December 31, 2021 (December 31, 2020: €28 million). Furthermor e, December 31, 2020, to €100 million as of December 31, 2021. there were obligations from guarantees in the amount of €341 mil- lion favoring a joint venture as of December 31, 2020. The balance of valuation allowances on trade accounts receivable from nonconsolidated subsidiaries was, as in the previous year, €3 million as of December 31, 2021.
BASF Report 2021 Consoli dated Financial Statements – Notes 285 32 Services provided by the external auditor 33 Declaration of Conformity with the German 34 Non-adjusting events after the balance sheet Corporate Governance Code date BASF Group companies used the following services from KPMG: Declaration pursuant to section 161 of the German Stock On January 4, 2022, the Board of Executive Directors approved a Services provided by the external auditor Corporation Act (AktG) share buyback program with a maximum volume of €3 billion to be Million € implemented between January 2022 and December 2023. The 2021 2020 The annual Declaration of Conformity with the German Corporate share buyback program is based on the authorization from Annual audit 19.2 19.6 Governance Code according to section 161 AktG was submitted by May 12, 2017. A proposal to renew the authorization to buy back of which domestic 6.8 7.1 the Board of Executive Directors and the Supervisory Board of own shares is planned for the 2022 Annual Shareholders’ Meeting, Audit-related services 0.7 1.0 BASF SE in December 2021 and is published online. which would authorize the continuation of the share buyback of which domestic 0.5 0.8 For more information, see basf.com/en/corporategovernance program already underway. Tax consultation services 0.2 0.2 For more information on the share buyback program, see Note 19 from page 249 onward of which domestic 0 0 Other services – – of which domestic – – Total 20.1 20.8 The services provided by the external auditor mainly include services for the annual audit and, to a lesser extent, confirmation services and tax consultation services. The line item annual audit relates to expenses for the audit of the Consolidated Financial Statements of the BASF Group, the legally required financial statements of BASF SE and of the subsidiaries and joint operations included in the Consolidated Financial Statements as well as the review of subgroups. Fees for audit- related services primarily include audits in connection with r egulatory demands as well as other confirmation services. Domestic tax consultation services related primarily to tax declaration adjustments for the Chemetall companies until the 2015 tax period.
BASF Report 2021 286 Contents Overviews To Our Shareholders Management’s Report Corporate Governance Consolidated Financial Statements 5 Overviews Ten-Year Summary 287 Glossary and Trademarks 289
BASF Report 2021 Overviews – Ten-Year Summary 287 Ten-Year Summary Million € 2012a 2013b 2014 2015 2016 2017 2018 2019 2020 2021 Statement of income c d Sales 72,129 73,973 74,326 70,449 57,550 61,223 60,220 59,316 59,149 78,598 Income from operations (EBIT) 6,742 7,160 7,626 6,248 6,275 7,587c 5,974d 4,201 −191 7,677 Income before income taxes 5,977 6,600 7,203 5,548 5,395 6,882c 5,233d 3,302 −1.562 7,448 d Income after taxes from continuing operations – – – – – 5,592 4,116 2,546 −1.471 6,018 d Income after taxes from discontinued operations – – – – – 760 863 5,945 396 −36 Income after taxes 5,067 5,113 5,492 4,301 4,255 6,352 4,979 8,491 −1.075 5,982 Net income 4,819 4,792 5,155 3,987 4,056 6,078 4,707 8,421 −1.060 5,523 c d Income from operations before depreciation and amortization (EBITDA) 10,009 10,432 11,043 10,649 10,526 10,765 8,970 8,185 6,494 11,355 EBIT before special items 6,647 7,077 7,357 6,739 6,309 7,645c 6,281d 4,643 3,560 7,768 Capital expenditures, depreciation and amortization Additions to property, plant and equipment and intangible assets 5,263 7,726 7,285 6,013 7,258 4,364 10,735 4,097 4,869 4,881 of which property, plant and equipment 4,084 6,428 6,369 5,742 4,377 4,028 5,040 3,842 4,075 4,410 d Depreciation and amortization of property, plant and equipment and intangible assets 3,267 3,272 3,417 4,401 4,251 4,202 3,750 4,146 6,685 3,678 of which property, plant and equipment 2,594 2,631 2,770 3,600 3,691 3,586 3,155d 3,408 5,189 3,064 Employees at year-end 110,782 112,206 113,292 112,435 113,830 115,490 122,404 117,628 110,302 111,047 Personnel expenses 8,963 9,285 9,224 9,982 10,165 10,610 10,659 10,924 10,576 11,097 c 1,994d 2,158 2,086 2,216 Research and development expenses 1,732 1,849 1,884 1,953 1,863 1,843 a We have applied International Reporting Standards IFRS 10 and 11 as well as International Accounting Standard 19 (revised) since January 1, 2013. Figures for 2012 have been restated; no restatement was made for 2011 and earlier. b Figures for 2013 have been adjusted to reflect the dissolution of the natural gas trading business disposal group. c Figures for 2017 were restated with the presentation of the oil and gas activities as discontinued operations. For more information, see Note 1.4 to the Consolidated Financial Statements from page 203 onward d Figures for 2018 were restated with the presentation of the construction chemicals activities as discontinued operations. For more information, see Note 1.4 to the Consolidated Financial Statements from page 203 onward
BASF Report 2021 Overviews – Ten-Year Summary 288 Million € 2012a 2013b 2014 2015 2016 2017 2018 2019 2020 2021 Balance sheet (IFRS) Total assets 62,726 64,204 71,359 70,836 76,496 78,768 86,556 86,950 80,292 87,383 Noncurrent assets 35,259 38,253 43,939 46,270 50,550 47,623 43,335 55,960 50,424 52,332 of which intangible assets 12,193 12,324 12,967 12,537 15,162 13,594 16,554 14,525 13,145 13,499 of which property, plant and equipment 16,610 19,229 23,496 25,260 26,413 25,258 20,780 21,792 19,647 21,553 Current assets 27,467 25,951 27,420 24,566 25,946 31,145 43,221 30,990 29,868 35,051 of which inventories 9,581 10,160 11,266 9,693 10,005 10,303 12,166 11,223 10,010 13,868 of which accounts receivable, trade 9,506 10,233 10,385 9,516 10,952 10,801 10,665 9,093 9,466 11,942 of which cash and cash equivalents 1,647 1,827 1,718 2,241 1,375 6,495 2,300 2,427 4,330 2,624 Equity 25,621 27,673 28,195 31,545 32,568 34,756 36,109 42,350 34,398 42,081 Total liabilities 37,105 36,531 43,164 39,291 43,928 44,012 50,447 44,600 45,894 45,301 of which financial indebtedness 12,798 14,407 15,384 15,197 16,312 18,032 20,841 18,377 19,214 17,184 Key data c Earnings per share € 5.25 5.22 5.61 4.34 4.42 6.62 5.12 9.17 –1.15 6.01 c Adjusted earnings per share € 5.64 5.31 5.44 5.00 4.83 6.44 5.87 4.00 3.21 6.76 Cash flows from operating activities 6,602 8,100 6,958 9,446 7,717 8,785 7,939 7,474 5,413 7,245 c d EBITDA margin % 13.9 14.1 14.9 15.1 18.3 17.6 14.9 13.8 11.0 14.4 c Return on assets % 11.0 11.5 11.7 8.7 8.2 9.5 7.1 4.5 –1.2 9.5 Return on equity after tax % 19.9 19.2 19.7 14.4 13.3 18.9 14.1 21.6 –2.8 15.6 d Return on capital employed (ROCE) % – – – – – 15.4 12.0 7.7 1.7 13.5 Appropriation of profits Net income of BASF SEe 2,880 2,826 5,853 2,158 2,808 3,130 2,982 3,899 3,946 3,928 f Dividend 2,388 2,480 2,572 2,664 2,755 2,847 2,939 3,031 3,031 3,123 Dividend per share € 2.60 2.70 2.80 2.90 3.00 3.10 3.20 3.30 3.30 3.40 Number of shares at year-end million 918.5 918.5 918.5 918.5 918.5 918.5 918.5 918.5 918.5 918.5 a We have applied International Reporting Standards IFRS 10 and 11 as well as International Accounting Standard 19 (revised) since January 1, 2013. Figures for 2012 have been restated; no restatement was made for 2011 and earlier. b Figures for 2013 have been adjusted to reflect the dissolution of the natural gas trading business disposal group. c Figures for 2017 were restated with the presentation of the oil and gas activities as discontinued operations. For more information, see Note 1.4 to the Consolidated Financial Statements from page 203 onward d Figures for 2018 were restated with the presentation of the construction chemicals activities as discontinued operations. For more information, see Note 1.4 to the Consolidated Financial Statements from page 203 onward^ e Calculated in accordance with German GAAP f Based on the number of outstanding shares as of December 31, 2021 (918,478,694)
BASF Report 2021 Overviews – Glossary and Trademarks 289 Glossary and Trademarks C P V CO equivalents Peak sales potential Value chain 2 CO equivalents are units for measuring the impact of greenhouse The peak sales potential of the Agricultural Solutions pipeline A value chain describes the successive steps in a production 2 gas emissions on the greenhouse effect. A factor known as the describes the total peak sales forecast for individual products in the process: from raw materials through various intermediate steps, global warming potential (GWP) shows the impact of the individual research and development pipeline. Peak sales are the highest sales such as transportation and production, to the finished product. gases compared with CO as the reference value. value to be expected from one year. The pipeline comprises innova- 2 tive products that have been on the market since 2021 or will be Verbund E launched on the market by 2031. In the BASF Verbund, plants are intelligently connected. In this Eco-Efficiency Analysis system, chemical processes consume less energy, produce higher The Eco-Efficiency Analysis is a method developed by BASF for S product yields and conserve resources. The by-products of one assessing the economic and environmental aspects of products SEEbalance® plant serve as feedstock elsewhere, creating efficient value chains – ® and processes. The aim is to compare products with regard to SEEbalance is the Socio-Eco-Efficiency analysis developed by from basic chemicals to high value-added solutions such as coat- profitability and environmental compatibility. BASF. It can be used to evaluate and compare the environmental ings or crop protection products. Our Verbund concept – realized impact, costs and social aspects of products and manufacturing in production, technologies, the market and digitalization – enables ® makes sustainable development measur- F processes. SEEbalance innovative solutions for a sustainable future. Formulation able and manageable for companies by combining the three Formulation describes the combination of one or more active sub- dimensions of sustainability – economy, environment and society – stances with excipients like emulsifiers, stabilizers and other inactive in an integrated product assessment tool. components in order to improve the applicability and effectiveness of various products, such as cosmetics, pharmaceuticals, agricul - Steam cracker Trademarksa tural chemicals, paints and coatings. A steam cracker is a plant in which steam is used to “crack” naphtha ® (petroleum) or natural gas. The resulting petrochemicals are the raw Net Promoter System G materials used to produce most of BASF’s products. Registered trademark of Bain & Company, Inc. Genome editing ® Genome editing refers to a series of new molecular biological T Responsible Care methods to make specific changes in the genome. Naturally occurr- Traits Registered trademark of the European Chemical Industry ing processes are used to make small changes to an organism’s Traits are commercial plant characteristics, such as an inherent Council genes to modify a specific characteristic. Such techniques have resistance to certain herbicides or an inherent defense against great potential for innovative solutions in healthcare, agriculture and certain insects. All other trademarks referred to in the BASF Report are industrial applications, for example. registered trademarks of the BASF Group (identified with the ® TM symbol), trademarks pending (identified with the symbol), or trademarks used by the BASF Group. a Trademarks are not registered/used in all countries.
Quarterly Statement Q1 2022 / Annual Shareholders’ Meeting 2022 Further information Published on February 25, 2022 April 29, 2022 You can find this and other BASF publications online at basf.com/publications Half-Year Financial Report 2022 July 27, 2022 Contact General inquiries Quarterly Statement Q3 2022 Phone: +49 621 60-0, email: global.info@basf.com Media Relations October 26, 2022 Jens Fey, phone: +49 621 60-99123 Sustainability Relations BASF Report 2022 Thorsten Pinkepank, phone: +49 621 60-41976 Investor Relations February 24, 2023 Dr. Stefanie Wettberg, phone: +49 621 60-48002 Internet Quarterly Statement Q1 2023 / Annual Shareholders’ Meeting 2023 basf.com April 27, 2023 BASF supports the chemical industry’s global Responsible Care initiative. COMS 2201 E