
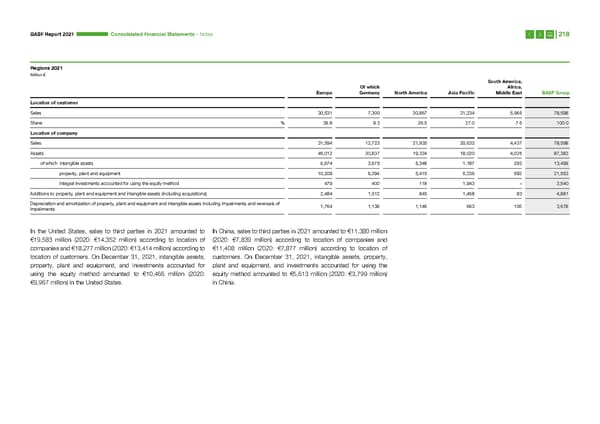
BASF Report 2021 Consoli dated Financial Statements – Notes 218 Regions 2021 Million € South America, Of which Africa, Europe Germany North America Asia Pacific Middle East BASF Group Location of customer Sales 30,531 7,300 20,867 21,234 5,965 78,598 Share % 38.8 9.3 26.5 27.0 7.6 100.0 Location of company Sales 31,594 12,722 21,935 20,632 4,437 78,598 Assets 46,012 30,837 19,324 18,020 4,026 87,383 of which intangible assets 6,674 3,675 5,348 1,187 292 13,499 property, plant and equipment 10,209 6,394 5,415 5,336 592 21,553 integral investments accounted for using the equity method 479 400 118 1,943 – 2,540 Additions to property, plant and equipment and intangible assets (including acquisitions) 2,484 1,512 845 1,468 83 4,881 Depreciation and amortization of property, plant and equipment and intangible assets including impairments and reversals of 1,764 1,138 1,146 663 105 3,678 impairments In the United States, sales to third parties in 2021 amounted to In China, sales to third parties in 2021 amounted to €11,380 million €19,583 million (2020: €14,352 million) according to location of (2020: €7,839 million) according to location of companies and companies and €18,277 million (2020: €13,414 million) according to €11,408 million (2020: €7,877 million) according to location of location of customers. On December 31, 2021, intangible assets, customers. On December 31, 2021, intangible assets, property, property, plant and equipment, and investments accounted for plant and equipment, and investments accounted for using the using the equity method amounted to €10,466 million (2020: equity method amounted to €5,613 million (2020: €3,799 million) €9,967 million) in the United States. in China.
 Integrated Report | BASF Page 217 Page 219